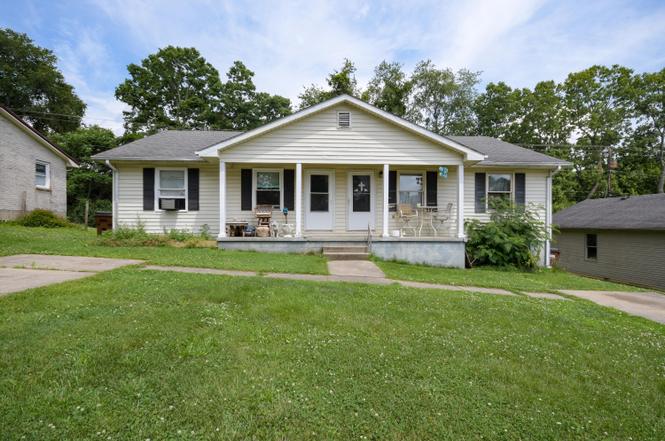
 Duplex
520 N Magnolia Dr · Mount Sterling, KY
Flood risk 1/10 · Minimal
- FEMA flood zone
- X (unshaded)
- Chance of flooding over 30 yrs
- 0.0%
- Est. flood insurance / yr
- $507 – $1,088
Fire risk 4/10 · Minor
- Est. fire insurance / yr
- $839 – $1,559
Heat risk 4/10 · Minor
- Hot days now (above 102°F)
- 7 days/yr
- Hot days in 30 yrs
- 19 days/yr
Wind risk 4/10 · Minor
- Chance of severe wind over 30 yrs
- 5.0%
Air-quality risk 1/10 · Minimal
- Unhealthy air days now
- 0 days/yr
- Unhealthy air days in 30 yrs
- 0 days/yr
Risk factors via First Street. Map © Google.
Why this score? — see what drove the B- grade
The composite is a weighted blend of 9 inputs, each scored 0–100. Each bar is that input's sub-score; the figure is the points it added to the 100-point composite (weight × sub-score).
- Cash flow +30.0/30.0
- 1% rule +10.0/10.0
- DSCR +10.0/10.0
- ARV discount +7.5/15.0
- Livability +3.2/5.0
- Schools +2.8/10.0
- Rent growth +2.5/5.0
- Condition / age +2.5/5.0
- Appreciation +0.0/10.0
$100,000
🖨 Deal sheet (PDF) 📄 Offer letter ✓ Due diligence
Multi-family units
County records classify this as Multi-Family (2-4 Unit). Listing-text estimate: 2 units. confirmed
Listing remarks
* * ABSOLUTE AUCTION * * Starting 6/20/26 @ DJSauctionsUSA.com ending with a Live Onsite Simulcast @ 770 Bedford Rd Jeffersonville KY at 12:00 noon on Saturday 7/11/2026 Johnnie C Tabor Estate Opportunity awaits with this income-producing duplex conveniently located in the heart of Mount Sterling! Whether you're looking to expand your investment portfolio, live in one unit while renting the other, or add a low-maintenance property to your holdings, this versatile duplex offers excellent potential. Each unit features 2 bedrooms and 1 bathroom with comfortable living spaces, functional layouts, and private entrances, providing convenience and privacy for occupants. The interiors offer spac
Key facts
- Generous lot
- Ample cabinetry
- Ample green space
Tags
Property features AI
Finance
- Other: 2 total units
Exterior
- Parking: On-site open parking
- Utilities: Cable available; Electricity connected; Phone available; Sewer connected; Water connected
- Home design: Duplex; Single-story
- Construction: 1,488 total building area
- Exterior features: Composition/shingle roof; Lot approximately 0.195 acres
Interior
- Bathrooms: 2 full bathrooms
- Heating & cooling: Heat pump heating; Central air conditioning
- Interior features: Washer hookup on main level; Electric dryer hookup on main level
- Laundry & utility: Washer hookup; Electric dryer hookup
Neighborhood map
What this means for you Summary
Snapshot
- This is a 2 × 2-bed/1.0-bath units multifamily listed at $100k.
Deal economics
- At list price, monthly cash flow is $882 ($11k/yr) — positive. Per door: $441/mo.
- The deal already cash-flows at list — no discount required.
- Meets the 1% rule at list price ($2k rent vs $100k).
- Cap rate 16.9% vs local median 3.4% in Mount Sterling — top-decile yield for the area; either an underpriced asset or a hidden risk that comps aren't pricing in. Stress-test before assuming the spread holds.
Location & tenants
- Location reads 64/100 on livability (#297 in KY) — a middle-class / working-renter tenant base. Strengths: cost of living A+, housing A+, crime B+; Watch: amenities F, commute F, employment F.
- Montgomery County (rural): math 24% / reading 44% proficiency, ranked #76 of 165 in KY (top 46%) — families likely to look elsewhere, expect single-tenant / working-renter base with shorter leases.
- Zoned schools: Montgomery County High School (math 29% / reading 39%, grade F, #89 of 254 statewide, top 36%, 1,279 students, 47% FRL) — zoned schools at 47% FRL track the district average.
- Market conditions: 114 active listings in the ZIP; 56 units permitted in Montgomery County in 2024 (0 in 5+ unit buildings).
- This rent runs 40% of the median local income ($57k/yr) — at the standard rent-burdened threshold; future hikes will face affordability resistance.
Forward outlook
- Local home prices are declining (-3.0%/yr); year-one equity from $691 of loan paydown is wiped out by about $3k of value loss. Plan a longer hold.
- Montgomery County population projected at +11% by 2050 — modest demand growth; plan on rents tracking national, not racing it.
- At projected returns (-3.0% appreciation + 3.0% rent growth), your $28k cash investment doubles in ~4 years — after that, you're playing with house money.
Negotiation context
- Only 3 days on market — expect competitive offers; lowballing is unlikely to land.
Questions for the listing agent
- Can we see the unit-by-unit rent roll, current vacancy, and any below-market leases? What's the average tenancy length?
- What capital expenditures (roof, boiler, parking lot, exteriors) have been made in the last 5 years, and what's planned in the next 2?
- Is there a deadline driving the sale (1031 exchange, divorce, estate, relocation)? That informs how much negotiation room exists.
- What's the average days-on-market for RENTAL listings here right now (not sales)? A rising rental-DOM trend means longer vacancies and softer asking-rent achievability than the comps imply.
- What's the recent tenant-quality profile in this submarket — average credit score on applications, eviction rate, late-payment / NSF rate, and stable-employment percentage? A property-management company in the area should have these aggregated.
- How much new apartment / multifamily construction is in the pipeline within 1–3 miles? Heavy new supply (>2% of stock underway) typically softens rents 12–24 months out; light construction supports rent growth.
Investment metrics
- 1% rule
- 1.89% ✓
- Cap rate
- 16.88%
- Cash-on-cash
- 37.81%
- DSCR
- 2.68
- GRM
- 4.4
CMA / ARV
No comps found within radius.
Projected returns pro-forma
-3.0% appreciation · 3.0% rent growth · sell at horizon
- IRR
- 33.8%
- Equity multiple
- 2.43×
- Total profit
- $39,968
- Equity at exit
- $14,910
- IRR
- 40.7%
- Equity multiple
- 4.82×
- Total profit
- $107,073
- Equity at exit
- $8,646
Cash invested: $28,000 (down + closing). Projections, not guarantees.
Landlord ↔ Tenant lean methodology
- Overall (STATE)
- 83 Strongly Landlord-Friendly
- State Kentucky
- 83 Strongly Landlord-Friendly · R+16
- County
- — inherits STATE
- City
- — inherits STATE
ZIP-level market 40353
- Home prices YoY
- -24.4%
- Active inventory
- 114
- Price-to-rent
- 8.8×
Monthly cashflow live
- Estimated rent
- $1,888 medium interval (Pro) →
- Mortgage (P&I)
- −$524
- Tax from tax record
- −$43 /mo · $518/yr
- Insurance
- −$42
- HOA
- −$0
- Vacancy / Maint / Mgmt
- −$396
- Net cashflow
- $882
Break-even live
Sensitivity live
| Price | -10% $939 | -5% $911 | +0% $882 | +5% $854 | +10% $826 |
|---|---|---|---|---|---|
| Rent | -10% $733 | -5% $808 | +0% $882 | +5% $957 | +10% $1,031 |
| Rate | -1.0pp $933 | -0.5pp $908 | base $882 | +0.5pp $856 | +1.0pp $830 |
2-unit breakdown (identical units grouped — click to expand)
| Units | Beds | Baths | Est. rent |
|---|---|---|---|
| 2× units | 2 | 1 | $1,888 |
| #1 | 2 | 1 | $944 |
| #2 | 2 | 1 | $944 |
| Total (2 units) | $1,888 | ||
UW: 25.0% down · 7.5% · 30yr · 1.5% tax · 5.0% vac · 8.0% maint · 8.0% mgmt
Financing live
Cash to close
- Down payment
- $25,000
- Closing costs
- $3,000
- Reserves months
- —
- Total cash needed
- —
Loan-product check · same deal, 3 products live
Conventional
25% down · 7.5% · 30yr
- Down + closing
- —
- Monthly P&I
- —
- Monthly cashflow
- —
- DSCR
- —
- Eligible?
- —
Personal DTI + credit; lowest rate.
DSCR
20% down · 8.5% · 30yr
- Down + closing
- —
- Monthly P&I
- —
- Monthly cashflow
- —
- DSCR
- —
- Eligible?
- —
No personal income docs; deal must DSCR.
Hard money
10% down · 12.0% · 12mo
- Down + closing
- —
- Monthly P&I
- —
- Monthly cashflow
- —
- DSCR
- —
- Eligible?
- —
Short-term bridge; refi at stabilization.
Listing history 4 events
-
2026-06-18days on market $100,000 Active 3 DOM
-
2026-06-17days on market $100,000 Active 2 DOM
-
2026-06-16remarks 699-char remark
-
2026-06-16$100,000 Active 1 DOM
ⓘ Source: listings_history table (triggers on properties + properties_extension) + one-shot
backfill from property_details.listing_events for pre-trigger history.
Tax reassessment forecast KY · Resets to sale price
- Current annual tax
- $518 · $43/mo
- Projected year-2 tax
- $860 · $72/mo
- Expected delta
- +$342/yr (+$29/mo · 66.1%)
ⓘ Screening estimate from a state-policy table — verify with the county assessor before closing.
Climate risk First Street
- Flood 1/10 Low FEMA zone X (unshaded) · 0% chance over 30 yrs
- Wildfire 4/10 Moderate
- Heat 4/10 Moderate 7 d/yr ≥102°F today · 19 d/yr by 30 yrs out
- Wind 4/10 Moderate 5% chance of damaging wind over 30 yrs
- Air quality 1/10 Low 0 unhealthy d/yr today · 0 by 30 yrs out
Nearby sold comps map
Loading sold comps map…
Walkable amenities ~0.75 mi
Loading nearby amenities…
Taxation est. · year 1
- Rental income
- $22,656
- − Mortgage interest
- −$5,602
- − Property taxes
- −$518
- − Insurance
- −$500
- − Repairs & maintenance
- −$1,812
- − Management
- −$1,812
- − Depreciation
- −$2,909
- Taxable income
- $9,503
- Est. tax owed @ 24.0%
- −$2,281
- After-tax cash flow
- $8,307/yr
For passive investors: Depreciation is non-cash, so a rental often shows a tax loss while cash-flowing — sheltering income. Rental losses are passive: they offset passive income freely, and up to $25,000/yr can offset ordinary (W-2) income if you actively participate and your MAGI is under $100k (phasing out to $0 by $150k); unused losses carry forward. On sale, claimed depreciation is recaptured at up to 25%, and gains may owe capital-gains tax (a 1031 exchange can defer both). Figures are a year-1 estimate at your 24.0% rate — not tax advice; consult a CPA.
Schools (NCES district)
- District
- Montgomery County
- NCES district ID
- 2104250
- Math proficiency
- 24% ▼ -21.00%
- Reading proficiency
- 44% ▼ -14.00%
- Median HH income
- $38,262
- Composite
- 28.32/100
- National rank
- #6782
- State rank
- #76 of 165 in KY
Livability — Mount Sterling
- Score
- 64/100
- State rank
- #297
- US rank
- #14214
Category grades
Schools grade is shown separately in the Schools card above.
Census & demographics
- Census place
- Mount Sterling, KY
- County
- Montgomery County · 22,725 people
- City population
- 22,725
- Metro
- Mount Sterling, KY
- Population (ZIP)
- 22,725
- Household income
- $57,329
- Rent vs Own
- Severe rent burden
- 454.0
Population outlook (Montgomery County) Hauer SSP2
- Today (2025)
- 29,814 people
- By 2030
- 30,705 · +3.0%
- By 2040
- 32,189 · +8.0%
- By 2050
- 33,131 · +11.1%
- By 2075
- 33,991 · +14.0%
- By 2100
- 32,097 · +7.7%
Race, ethnicity, and origin ACS 2023
- Neighborhood character
- Predominantly White (91%)
- Race & ethnicity
- White 91% Hispanic / Latino 4% Two or more races 4% Black 3%
- Common ancestry
- Italian 2% Slovak 1% Scottish 1%
- Foreign-born
- 1% · Canada
- Languages at home
- 95% English-only · Spanish 4% Other Indo-European 1%
Political lean MEDSL · Montgomery
- 2024 margin
- Solid R (+46.6) · D 26.0% · R 72.6% · Other 1.5%
- 2008→2024 swing
- -30.0pp toward R · 2008: -16.6pp · 2024: -46.6pp
- All cycles
- 2024: R+46.6 2020: R+41.8 2016: R+41.1 2012: R+26.3 2008: R+16.6
Not yet ingested
- Civics
- —
Market trends
- HPI YoY
- ▼ -73.89%
- Current HPI
- 229.2128
- Rent YoY
- —
- Metro
- Mount Sterling, KY
- State GDP YoY
- ▲ 1.81%
- F500 in state
- 4
Industry mix (Fortune 500 HQ in KY)
| Industry | F500 HQs | Revenue |
|---|---|---|
| Healthcare | 1 | $118B |
|
||
| Food / Beverage | 1 | $7B |
|
||
Price history
1 event — show timeline
- 2026-06-15 Listed $100,000 ImagineMLS
Cash-flow waterfall
monthlySold comps — $/sqft
last 12 mo · ≤1 miLoading sold comps…