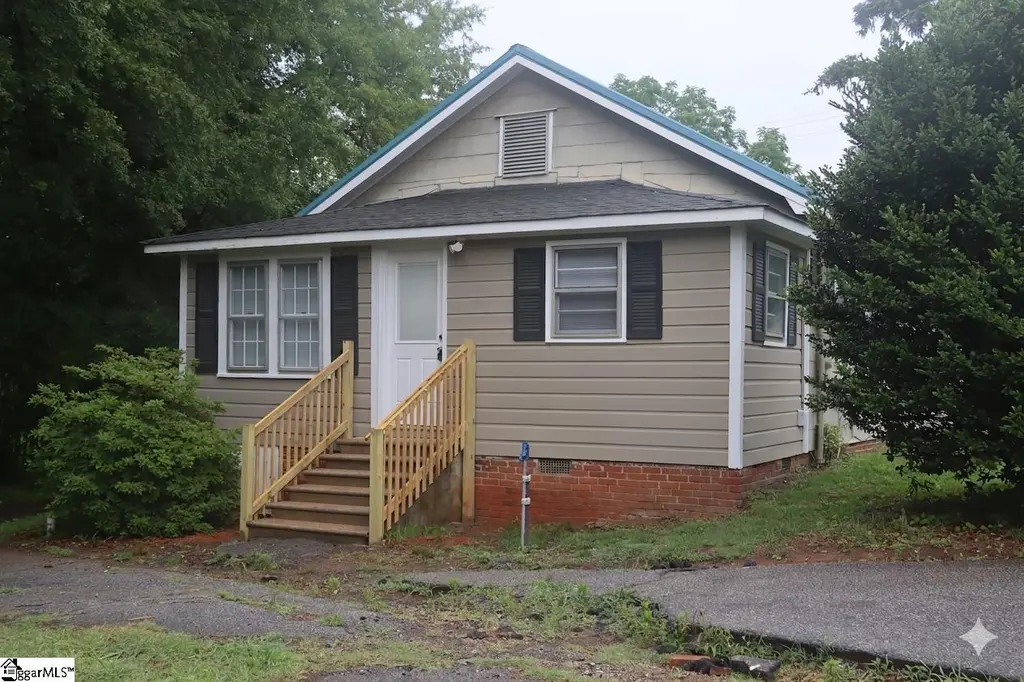
190 S Cash Ave · Chesnee, SC
Flood risk 1/10 · Minimal
- FEMA flood zone
- X (unshaded)
- Chance of flooding over 30 yrs
- 0.0%
- Est. flood insurance / yr
- $507 – $1,088
Fire risk 2/10 · Minimal
- Est. fire insurance / yr
- $783 – $1,453
Heat risk 6/10 · Moderate
- Hot days now (above 104°F)
- 7 days/yr
- Hot days in 30 yrs
- 17 days/yr
Wind risk 2/10 · Minimal
- Chance of severe wind over 30 yrs
- 2.0%
Air-quality risk 3/10 · Minor
- Unhealthy air days now
- 3 days/yr
- Unhealthy air days in 30 yrs
- 3 days/yr
Risk factors via First Street. Map © Google.
Why this score? — see what drove the C- grade
The composite is a weighted blend of 9 inputs, each scored 0–100. Each bar is that input's sub-score; the figure is the points it added to the 100-point composite (weight × sub-score).
- Cash flow +20.5/30.0
- ARV discount +10.0/15.0
- DSCR +6.5/10.0
- 1% rule +4.6/10.0
- Schools +4.5/10.0
- Livability +3.4/5.0
- Rent growth +2.5/5.0
- Condition / age +2.5/5.0
- Appreciation +0.0/10.0
$149,000
🖨 Deal sheet (PDF) 📄 Offer letter ✓ Due diligence
Listing remarks MLS
Well kept older home situated on large corner lot! Features include updated paint and carpet, nice kitchen with separate dining room, living room with fireplace equipped with gas heater, large laundry/utility room, sunroom, outbuilding with electricity and more! Small room off master bedroom could be office or nursery! Quality built home in great location.
Key facts
- Move-in ready
- Remodeled
- New flooring
Tags
Property features AI
Finance
- HOA & community: No HOA fees
Exterior
- Parking: Assigned parking for 2 spaces; Paved concrete driveway
- Utilities: Public water; Septic system; Private garbage pickup
- Home design: Single-story home; Approximate age 31–50 years; Crawl space foundation
- Construction: Vinyl siding exterior; Composition shingle roof
- Exterior features: Screened porch; Patio; Level lot
Interior
- Kitchen: Kitchen approx. 12 x 12; Smooth cooktop; Refrigerator
- Bedrooms: Two bedrooms on the main level; Primary bedroom with tub/shower (approx. 10 x 12); Second bedroom approx. 10 x 8
- Flooring: Luxury vinyl tile/plank
- Bathrooms: One full bathroom on the main level
- Heating & cooling: Electric heating; Electric cooling; Electric water heater
- Interior features: Smooth ceilings; Smoke detector; Laminate countertops; All window treatments remain; Second living quarters on the main level; Office/Study
- Laundry & utility: Laundry on the first floor; Washer connection; Electric dryer hookup
Neighborhood map
What this means for you Summary
Snapshot
- This is a 3-bed/1.0-bath single-family listed at $149k.
Deal economics
- At list price, monthly cash flow is $195 ($2k/yr) — positive.
- The deal already cash-flows at list — no discount required.
- To meet the 1% rule (rent ≥ 1% of price), the offer needs to be $143k (4.2% below list).
- Recommended offer: $143k (4.2% below list) — sets the bar for 1% rule.
- Cap rate 7.9% vs local median 2.7% in Chesnee — top-decile yield for the area; either an underpriced asset or a hidden risk that comps aren't pricing in. Stress-test before assuming the spread holds.
Location & tenants
- Location reads 67/100 on livability (#107 in SC) — a middle-class / working-renter tenant base. Strengths: cost of living A+, health & safety A+, housing B+; Watch: crime F, amenities F, commute F.
- Spartanburg 02 (suburban): math 49% / reading 56% proficiency, ranked #6 of 80 in SC (top 8%) — acceptable for families but not a draw, mixed tenant base, ~2y average lease.
- Zoned schools: Chesnee Elementary (math 62% / reading 52%, grade C+, #102 of 597 statewide, top 18%, 606 students, 71% FRL); Chesnee Middle (math 36% / reading 48%, grade D-, #64 of 229 statewide, top 29%, 534 students, 69% FRL); Chesnee High (math 62% / reading 87%, grade B+, #38 of 196 statewide, top 20%, 704 students, 63% FRL) — zoned schools average 68% FRL vs 44% district-wide (23 pts higher); higher-poverty schools than district average — tighter screening recommended.
- Market conditions: 308 active listings in the ZIP; 3,129 units permitted in Spartanburg County in 2024 (40 in 5+ unit buildings).
Forward outlook
- Local home prices are declining (-3.0%/yr); year-one equity from $1k of loan paydown is wiped out by about $4k of value loss. Plan a longer hold.
- Spartanburg County population projected at +18% by 2050 — long-run rental-demand tailwind backs the buy-and-hold thesis.
Negotiation context
- Only 9 days on market — expect competitive offers; lowballing is unlikely to land.
- 3 sale attempts since 15y ago with the ask held roughly flat each time — persistent listings suggest the price (not the market) is what's stuck; bring a comps-based counter.
- Current owner paid $42k; list at $149k implies a 255% gain — meaningful room to come down on a strong offer.
Risks & watch-outs
- Watch-outs: built in 1900 — expect roof / HVAC / electrical / plumbing capex.
- Climate carrying-cost: extreme-heat days projected 7→17/yr by 2055 (HVAC capex compounding) — expect insurance premiums to compound above CPI over the hold.
Questions for the listing agent
- Built in 1900 — when were the roof, HVAC, electrical panel, plumbing, and water heater last replaced?
- Is there a deadline driving the sale (1031 exchange, divorce, estate, relocation)? That informs how much negotiation room exists.
- Schools are D-rated, which usually means shorter tenancies and higher turnover. Who's the typical renter profile here, and what's been the actual vacancy rate?
- Crime grade is F in this area — have there been break-ins, vandalism, or insurance claims at this property in the last 3 years? What carrier currently insures it and at what premium?
- What's the average days-on-market for RENTAL listings here right now (not sales)? A rising rental-DOM trend means longer vacancies and softer asking-rent achievability than the comps imply.
- What's the recent tenant-quality profile in this submarket — average credit score on applications, eviction rate, late-payment / NSF rate, and stable-employment percentage? A property-management company in the area should have these aggregated.
- How much new for-sale + rental construction is in the pipeline within 1–3 miles? Heavy new supply typically softens prices + rents 12–24 months out; constrained supply supports both.
Investment metrics
- 1% rule
- 0.96% ✗
- Cap rate
- 7.86%
- Cash-on-cash
- 5.61%
- DSCR
- 1.25
- GRM
- 8.7
CMA / ARV
- ARV (on-the-fly)
- $157,648
- Comps found
- 6
Show comp detail 6 sales within ~0.75 mi
| Address | Dist | Beds/Ba | Sqft | Sold | Price | $/sf | Match |
|---|---|---|---|---|---|---|---|
| 405 Edgefield Street St | 0.13mi | 2/1.0 (-1) | 810 (-14%) | 4mo | $164,900 | $204 | 62 |
| 207 Streamside Dr | 0.62mi | 2/1.0 (-1) | 870 (-8%) | 5mo | $109,000 | $125 | 49 |
| 614 S Kentucky Ave Ave | 0.61mi | 2/1.0 (-1) | 986 (+4%) | 12mo | $150,000 | $152 | 49 |
| 312 S Lee St | 0.19mi | 2/1.0 (-1) | 820 (-13%) | 19mo | $50,000 | $61 | 48 |
| 611 Mcarthur St | 0.57mi | 3/2.0 | 1,058 (+12%) | 15mo | $176,500 | $167 | 37 |
| 315 Richland St | 0.74mi | 2/1.0 (-1) | 805 (-15%) | 20mo | $152,000 | $189 | 19 |
Match score weights: distance 35% · size 25% · config 20% · recency 20%. Top-matched comps best support the ARV.
Projected returns pro-forma
-3.0% appreciation · 3.0% rent growth · sell at horizon
- IRR
- -7.6%
- Equity multiple
- 0.72×
- Total profit
- $-11,760
- Equity at exit
- $22,216
- IRR
- 1.9%
- Equity multiple
- 1.13×
- Total profit
- $5,601
- Equity at exit
- $12,883
Cash invested: $41,720 (down + closing). Projections, not guarantees.
Landlord ↔ Tenant lean methodology
- Overall (STATE)
- 90 Strongly Landlord-Friendly
- State South Carolina
- 90 Strongly Landlord-Friendly · R+6
- County
- — inherits STATE
- City
- — inherits STATE
ZIP-level market 29323
- Home prices YoY
- -8.0%
- Active inventory
- 308
- Price-to-rent
- 8.7×
Monthly cashflow live
- Estimated rent
- $1,428 medium interval (Pro) →
- Mortgage (P&I)
- −$781
- Tax from tax record
- −$89 /mo · $1,071/yr
- Insurance
- −$62
- HOA
- −$0
- Vacancy / Maint / Mgmt
- −$300
- Net cashflow
- $195
Break-even live
Sensitivity live
| Price | -10% $279 | -5% $237 | +0% $195 | +5% $153 | +10% $111 |
|---|---|---|---|---|---|
| Rent | -10% $82 | -5% $139 | +0% $195 | +5% $251 | +10% $308 |
| Rate | -1.0pp $270 | -0.5pp $233 | base $195 | +0.5pp $156 | +1.0pp $117 |
UW: 25.0% down · 7.5% · 30yr · 1.5% tax · 5.0% vac · 8.0% maint · 8.0% mgmt
Financing live
Cash to close
- Down payment
- $37,250
- Closing costs
- $4,470
- Reserves months
- —
- Total cash needed
- —
Loan-product check · same deal, 3 products live
Conventional
25% down · 7.5% · 30yr
- Down + closing
- —
- Monthly P&I
- —
- Monthly cashflow
- —
- DSCR
- —
- Eligible?
- —
Personal DTI + credit; lowest rate.
DSCR
20% down · 8.5% · 30yr
- Down + closing
- —
- Monthly P&I
- —
- Monthly cashflow
- —
- DSCR
- —
- Eligible?
- —
No personal income docs; deal must DSCR.
Hard money
10% down · 12.0% · 12mo
- Down + closing
- —
- Monthly P&I
- —
- Monthly cashflow
- —
- DSCR
- —
- Eligible?
- —
Short-term bridge; refi at stabilization.
Listing history 7 events
-
2026-06-21days on market $149,000 Active 9 DOM
-
2026-06-18days on market $149,000 Active 6 DOM
-
2026-06-17days on market $149,000 Active 5 DOM
-
2026-06-16days on market $149,000 Active 4 DOM
-
2026-06-15days on market $149,000 Active 3 DOM
-
2026-06-13remarks 569-char remark
-
2026-06-13$149,000 Active 1 DOM
ⓘ Source: listings_history table (triggers on properties + properties_extension) + one-shot
backfill from property_details.listing_events for pre-trigger history.
Tax reassessment forecast SC · Resets to sale price
- Current annual tax
- $1,071 · $89/mo
- Projected year-2 tax
- $1,071 · $89/mo
- Expected delta
- $0/yr ($0/mo · 0.0%)
ⓘ Screening estimate from a state-policy table — verify with the county assessor before closing.
Climate risk First Street
- Flood 1/10 Low FEMA zone X (unshaded) · 0% chance over 30 yrs
- Wildfire 2/10 Low
- Heat 6/10 Major 7 d/yr ≥104°F today · 17 d/yr by 30 yrs out
- Wind 2/10 Low 2% chance of damaging wind over 30 yrs
- Air quality 3/10 Moderate 3 unhealthy d/yr today · 3 by 30 yrs out
Nearby sold comps map
Loading sold comps map…
Walkable amenities ~0.75 mi
Loading nearby amenities…
Taxation est. · year 1
- Rental income
- $17,130
- − Mortgage interest
- −$8,346
- − Property taxes
- −$1,071
- − Insurance
- −$745
- − Repairs & maintenance
- −$1,370
- − Management
- −$1,370
- − Depreciation
- −$4,335
- Taxable loss
- −$107
- Est. tax savings @ 24.0%
- +$26
- After-tax cash flow
- $2,366/yr
For passive investors: Depreciation is non-cash, so a rental often shows a tax loss while cash-flowing — sheltering income. Rental losses are passive: they offset passive income freely, and up to $25,000/yr can offset ordinary (W-2) income if you actively participate and your MAGI is under $100k (phasing out to $0 by $150k); unused losses carry forward. On sale, claimed depreciation is recaptured at up to 25%, and gains may owe capital-gains tax (a 1031 exchange can defer both). Figures are a year-1 estimate at your 24.0% rate — not tax advice; consult a CPA.
Schools (NCES district)
- District
- Spartanburg 02
- NCES district ID
- 4503510
- Math proficiency
- 49% ▼ -7.00%
- Reading proficiency
- 56% ▲ 2.00%
- Median HH income
- $49,591
- Composite
- 44.79/100
- National rank
- #2742
- State rank
- #6 of 80 in SC
Livability — Chesnee
- Score
- 67/100
- State rank
- #107
- US rank
- #11076
Category grades
Schools grade is shown separately in the Schools card above.
Census & demographics
- Census place
- Chesnee, SC
- Population (ZIP)
- 15,087
Population outlook (Spartanburg County) Hauer SSP2
- Today (2025)
- 325,495 people
- By 2030
- 338,800 · +4.1%
- By 2040
- 363,471 · +11.7%
- By 2050
- 384,156 · +18.0%
- By 2075
- 430,137 · +32.1%
- By 2100
- 442,733 · +36.0%
Race, ethnicity, and origin ACS 2023
- Neighborhood character
- Predominantly White (82%)
- Race & ethnicity
- White 82% Hispanic / Latino 7% Black 5% Two or more races 4% Asian 3%
- Hispanic origin (detail)
- Mexican 6%
- Common ancestry
- Slovak 4% Romanian 2% Serbian 2%
- Foreign-born
- 6% · Canada, Jamaica
- Languages at home
- 90% English-only · Spanish 5% Russian/Polish/Slavic 3% Other Asian/Pacific 2%
Political lean MEDSL · Spartanburg
- 2024 margin
- Solid R (+33.6) · D 32.6% · R 66.2% · Other 1.2%
- 2008→2024 swing
- -12.0pp toward R · 2008: -21.6pp · 2024: -33.6pp
- All cycles
- 2024: R+33.6 2020: R+27.3 2016: R+30.0 2012: R+23.1 2008: R+21.6
Not yet ingested
- Civics
- —
Market trends
- HPI YoY
- ▼ -25.81%
- Current HPI
- 297.6589
- Rent YoY
- —
- Metro
- —
- State GDP YoY
- ▲ 4.51%
- F500 in state
- 2
Industry mix (Fortune 500 HQ in SC)
| Industry | F500 HQs | Revenue |
|---|---|---|
| Packaging | 1 | $7B |
|
||
Price history
+220.4% since first listed5 events — show timeline
- 2026-06-10 Listed $149,000 Greater Greenville MLS
- 2024-12-07 Delisted — SPMLS
- 2024-11-12 Listed $125,000 SPMLS
- 2011-06-29 Sold (MLS) $42,000 SPMLS
- 2011-03-11 Listed $46,500 SPMLS
Property tax history
+4.9%/yrLatest (2025): $1,071 · +8.8% YoY. Source: county tax records.
Cash-flow waterfall
monthlySold comps — $/sqft
last 12 mo · ≤1 miLoading sold comps…