 5-Plex
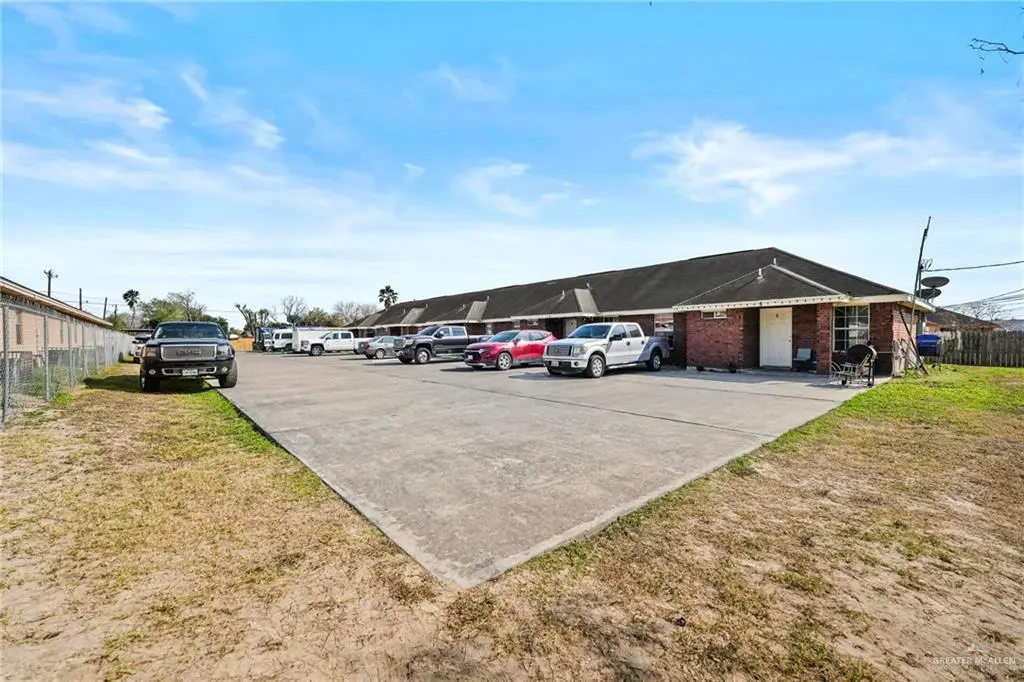
407 S Minnesota Rd · Palmview, TX
Flood risk 1/10 · Minimal
- FEMA flood zone
- —
- Chance of flooding over 30 yrs
- 0.0%
- Est. flood insurance / yr
- —
Fire risk 8/10 · Major
- Est. fire insurance / yr
- $1,222 – $2,270
Heat risk 9/10 · Severe
- Hot days now (above 112°F)
- 7 days/yr
- Hot days in 30 yrs
- 22 days/yr
Wind risk 8/10 · Major
- Chance of severe wind over 30 yrs
- 94.0%
Air-quality risk 1/10 · Minimal
- Unhealthy air days now
- 0 days/yr
- Unhealthy air days in 30 yrs
- 0 days/yr
Risk factors via First Street. Map © Google.
Why this score? — see what drove the D grade
The composite is a weighted blend of 9 inputs, each scored 0–100. Each bar is that input's sub-score; the figure is the points it added to the 100-point composite (weight × sub-score).
- Cash flow +19.8/30.0
- DSCR +6.3/10.0
- 1% rule +5.3/10.0
- Livability +2.9/5.0
- Rent growth +2.7/5.0
- Condition / age +2.2/5.0
- Schools +1.9/10.0
- ARV discount +0.0/15.0
- Appreciation +0.0/10.0
$535,000
🖨 Deal sheet (PDF) 📄 Offer letter ✓ Due diligence
Multi-family units
County records classify this as Multi-Family (5+ Unit). Listing-text estimate: 5 units. confirmed
5+ unit building — per-unit beds/baths from public records are typically unavailable; the breakdown below (if shown) is an estimate from the listing text.
Listing remarks MLS
Investment Opportunity: 5-Plex at 407 S Minnesota, Palmview, Mission This fully occupied 5-plex offers steady cash flow with 2-bed, 2-bath units. A solid, income-generating asset for investors seeking growth. All units are leased, ensuring immediate returns. The well-maintained property offers a tranquil environment with low tenant turnover, maximizing investment stability. Situated in a desirable area with easy access to local amenities, this 5-plex is an ideal addition to any real estate portfolio. Don’t miss out on this income-producing property.
Key facts
- Steady cash flow
- Low tenant turnover
- Desirable area
Tags
Neighborhood map
What this means for you Summary
Snapshot
- This is a 5 × 2-bed/2-bath units multifamily listed at $535k. Condition is rated fair.
Deal economics
- At list price, monthly cash flow is $637 ($8k/yr) — positive. Per door: $127/mo.
- The deal already cash-flows at list — no discount required.
- Meets the 1% rule at list price ($5k rent vs $535k).
- Recommended offer: $471k (12.0% below list) — sets the bar for market timing.
- Cap rate 7.7% vs local median 4.2% in Palmview — top-decile yield for the area; either an underpriced asset or a hidden risk that comps aren't pricing in. Stress-test before assuming the spread holds.
Location & tenants
- Location reads 57/100 on livability (#1,267 in TX) — a working-class tenant base; expect higher turnover. Strengths: cost of living A+, housing A; Watch: crime D, amenities F, commute F.
- La Joya ISD (suburban): math 18% / reading 29% proficiency, ranked #759 of 826 in TX (top 92%) — low school quality limits family demand, transient renter base, plan for 1-2y turnover.
- Zoned schools: Leo J Leo El (math 27% / reading 32%, grade F, #2,525 of 4,322 statewide, top 62%, 372 students, 92% FRL); Cesar Chavez Middle (math 25% / reading 35%, grade F, #1,056 of 1,662 statewide, top 65%, 666 students, 90% FRL); La Joya Palmview H S (math 20% / reading 37%, grade F, #1,157 of 1,632 statewide, top 72%, 2,155 students, 91% FRL) — zoned schools average 91% FRL vs 54% district-wide (38 pts higher); higher-poverty schools than district average — tighter screening recommended.
- Market conditions: Rents flat; 852 active listings in the ZIP; 7,378 units permitted in Hidalgo County in 2024 (641 in 5+ unit buildings).
- At $5,486/mo this rent would consume 121% of the median local household income ($54k/yr) (locally 1714% of renters already pay >50% of income on rent) — very limited rent-growth headroom before tenants either downsize or default.
Forward outlook
- Local home prices are declining (-3.0%/yr); year-one equity from $4k of loan paydown is wiped out by about $16k of value loss. Plan a longer hold.
- Hidalgo County population projected at +28% by 2050 — long-run rental-demand tailwind backs the buy-and-hold thesis.
Negotiation context
- It's been on market 493 days — a 12% lower offer ($471k) is reasonable based on typical stale-listing flexibility.
Risks & watch-outs
- Climate carrying-cost: severe wind risk, 94% chance of damaging wind over 30y; severe wildfire risk; extreme-heat days projected 7→22/yr by 2055 (HVAC capex compounding) — expect insurance premiums to compound above CPI over the hold.
Questions for the listing agent
- It's been on market 493 days. Have you received any prior offers? Is the seller open to a 12% concession, seller financing, or rate buy-down credit?
- Can we see the unit-by-unit rent roll, current vacancy, and any below-market leases? What's the average tenancy length?
- What capital expenditures (roof, boiler, parking lot, exteriors) have been made in the last 5 years, and what's planned in the next 2?
- Have any recent inspections been done? Can we get a copy of the seller's disclosures and any deferred-maintenance estimates?
- Why hasn't it sold? Are there any deal-killer items the seller is aware of (foundation, flood, title, zoning, code violations)?
- Is there a deadline driving the sale (1031 exchange, divorce, estate, relocation)? That informs how much negotiation room exists.
- Schools are F-rated, which usually means shorter tenancies and higher turnover. Who's the typical renter profile here, and what's been the actual vacancy rate?
- Crime grade is D in this area — have there been break-ins, vandalism, or insurance claims at this property in the last 3 years? What carrier currently insures it and at what premium?
- The area grade is low — what's the realistic commute time and amenity access for the typical tenant pool here? Any planned neighborhood developments (good or bad) we should know about?
- What's the average days-on-market for RENTAL listings here right now (not sales)? A rising rental-DOM trend means longer vacancies and softer asking-rent achievability than the comps imply.
- What's the recent tenant-quality profile in this submarket — average credit score on applications, eviction rate, late-payment / NSF rate, and stable-employment percentage? A property-management company in the area should have these aggregated.
- How much new apartment / multifamily construction is in the pipeline within 1–3 miles? Heavy new supply (>2% of stock underway) typically softens rents 12–24 months out; light construction supports rent growth.
Investment metrics
- 1% rule
- 1.03% ✓
- Cap rate
- 7.72%
- Cash-on-cash
- 5.10%
- DSCR
- 1.23
- GRM
- 8.1
CMA / ARV
- ARV (median comp)
- $413,294
- List price
- $535,000
- Delta
- 29.45%
- Verdict
- OVERPRICED
- Comps
- 3 within 2.0 mi
Projected returns pro-forma
-3.0% appreciation · 0.93% rent growth · sell at horizon
- IRR
- -10.7%
- Equity multiple
- 0.62×
- Total profit
- $-57,255
- Equity at exit
- $79,770
- IRR
- -4.6%
- Equity multiple
- 0.72×
- Total profit
- $-41,376
- Equity at exit
- $46,257
Cash invested: $149,800 (down + closing). Projections, not guarantees.
Landlord ↔ Tenant lean methodology
- Overall (STATE)
- 87 Strongly Landlord-Friendly
- State Texas
- 87 Strongly Landlord-Friendly · R+5
- County
- — inherits STATE
- City
- — inherits STATE
ZIP-level market 78572
- Home prices YoY
- -22.9%
- Rents YoY
- 0.9%
- Active inventory
- 852
- Price-to-rent
- 40.6×
Monthly cashflow live
- Estimated rent
- $5,486 medium interval (Pro) →
- Mortgage (P&I)
- −$2,806
- Tax est. 1.5%
- −$669 /mo · $8,025/yr
- Insurance
- −$223
- HOA
- −$0
- Vacancy / Maint / Mgmt
- −$1,152
- Net cashflow
- $637
Break-even live
Sensitivity live
| Price | -10% $1,006 | -5% $822 | +0% $637 | +5% $452 | +10% $267 |
|---|---|---|---|---|---|
| Rent | -10% $203 | -5% $420 | +0% $637 | +5% $853 | +10% $1,070 |
| Rate | -1.0pp $906 | -0.5pp $773 | base $637 | +0.5pp $498 | +1.0pp $357 |
5-unit breakdown (identical units grouped — click to expand)
| Units | Beds | Baths | Est. rent |
|---|---|---|---|
| 5× units | 2 | 2 | $5,485 |
| #1 | 2 | 2 | $1,097 |
| #2 | 2 | 2 | $1,097 |
| #3 | 2 | 2 | $1,097 |
| #4 | 2 | 2 | $1,097 |
| #5 | 2 | 2 | $1,097 |
| Total (5 units) | $5,486 | ||
UW: 25.0% down · 7.5% · 30yr · 1.5% tax · 5.0% vac · 8.0% maint · 8.0% mgmt
Financing live
Cash to close
- Down payment
- $133,750
- Closing costs
- $16,050
- Reserves months
- —
- Total cash needed
- —
Loan-product check · same deal, 3 products live
Conventional
25% down · 7.5% · 30yr
- Down + closing
- —
- Monthly P&I
- —
- Monthly cashflow
- —
- DSCR
- —
- Eligible?
- —
Personal DTI + credit; lowest rate.
DSCR
20% down · 8.5% · 30yr
- Down + closing
- —
- Monthly P&I
- —
- Monthly cashflow
- —
- DSCR
- —
- Eligible?
- —
No personal income docs; deal must DSCR.
Hard money
10% down · 12.0% · 12mo
- Down + closing
- —
- Monthly P&I
- —
- Monthly cashflow
- —
- DSCR
- —
- Eligible?
- —
Short-term bridge; refi at stabilization.
Listing history 18 events
-
2026-06-22days on market $535,000 Active 493 DOM
-
2026-06-18days on market $535,000 Active 490 DOM
-
2026-06-17days on market $535,000 Active 489 DOM
-
2026-06-16days on market $535,000 Active 488 DOM
-
2026-06-15days on market $535,000 Active 487 DOM
-
2026-06-14days on market $535,000 Active 485 DOM
-
2026-06-13days on market $535,000 Active 484 DOM
-
2026-06-10days on market $535,000 Active 482 DOM
-
2026-06-09days on market $535,000 Active 481 DOM
-
2026-06-08days on market $535,000 Active 480 DOM
-
2026-06-07days on market $535,000 Active 479 DOM
-
2026-06-05days on market $535,000 Active 476 DOM
-
2026-06-03days on market $535,000 Active 475 DOM
-
2026-06-02days on market $535,000 Active 474 DOM
-
2026-06-01days on market $535,000 Active 473 DOM
-
2026-05-31days on market $535,000 Active 472 DOM
-
2026-05-31days on market $535,000 Active 471 DOM
-
2025-02-13$535,000 Active 562-char remark
Show marketing remark (562 chars)
Investment Opportunity: 5-Plex at 407 S Minnesota, Palmview, Mission This fully occupied 5-plex offers steady cash flow with 2-bed, 2-bath units. A solid, income-generating asset for investors seeking growth. All units are leased, ensuring immediate returns. The well-maintained property offers a tranquil environment with low tenant turnover, maximizing investment stability. Situated in a desirable area with easy access to local amenities, this 5-plex is an ideal addition to any real estate portfolio. Don’t miss out on this income-producing property.
ⓘ Source: listings_history table (triggers on properties + properties_extension) + one-shot
backfill from property_details.listing_events for pre-trigger history.
Climate risk First Street
- Flood 1/10 Low 0% chance over 30 yrs
- Wildfire 8/10 Severe
- Heat 9/10 Extreme 7 d/yr ≥112°F today · 22 d/yr by 30 yrs out
- Wind 8/10 Severe 94% chance of damaging wind over 30 yrs
- Air quality 1/10 Low 0 unhealthy d/yr today · 0 by 30 yrs out
Nearby sold comps map
Loading sold comps map…
Walkable amenities ~0.75 mi
Loading nearby amenities…
Taxation est. · year 1
- Rental income
- $65,832
- − Mortgage interest
- −$29,968
- − Property taxes
- −$8,025
- − Insurance
- −$2,675
- − Repairs & maintenance
- −$5,267
- − Management
- −$5,267
- − Depreciation
- −$15,564
- Taxable loss
- −$933
- Est. tax savings @ 24.0%
- +$224
- After-tax cash flow
- $7,864/yr
For passive investors: Depreciation is non-cash, so a rental often shows a tax loss while cash-flowing — sheltering income. Rental losses are passive: they offset passive income freely, and up to $25,000/yr can offset ordinary (W-2) income if you actively participate and your MAGI is under $100k (phasing out to $0 by $150k); unused losses carry forward. On sale, claimed depreciation is recaptured at up to 25%, and gains may owe capital-gains tax (a 1031 exchange can defer both). Figures are a year-1 estimate at your 24.0% rate — not tax advice; consult a CPA.
Condition & rehab AI · 10 photos
This 5-plex requires moderate renovations to update the kitchen and bathrooms, and paint the interior walls. These updates will significantly increase its resale and rental value.
Repairs flagged
- Moderate kitchen cabinets — dated and worn
- Moderate bathroom fixtures — outdated and worn
- Minor exterior siding — some wear
Value-add opportunities
- Both update kitchen cabinets and fixtures — modernizes and increases appeal
- Both paint interior walls — enhances appearance and value
- Both replace bathroom fixtures — modernizes and increases appeal
Renovation cost estimate screening
| Repair item | Severity | Est. cost |
|---|---|---|
| kitchen cabinets · dated and worn | Moderate | $3,000–15,000 |
| bathroom fixtures · outdated and worn | Moderate | $3,000–15,000 |
| exterior siding · some wear | Minor | $500–3,000 |
| Total estimated repair cost · 3 items | $6,500–33,000 |
Value-add ROI direction
- Both update kitchen cabinets and fixtures — modernizes and increases appeal ↑
- Both paint interior walls — enhances appearance and value ↑
- Both replace bathroom fixtures — modernizes and increases appeal ↑
ⓘ Cost ranges are severity-bucket heuristics (US national rule-of-thumb). Get contractor quotes + a written scope before underwriting a rehab budget.
Schools (NCES district)
- District
- La Joya ISD
- NCES district ID
- 4826130
- Math proficiency
- 18% ▼ -35.00%
- Reading proficiency
- 29% ▼ -10.00%
- Median HH income
- $27,845
- Composite
- 18.65/100
- National rank
- #8891
- State rank
- #759 of 826 in TX
Livability — Palmview
- Score
- 57/100
- State rank
- #1267
- US rank
- #22043
Category grades
Schools grade is shown separately in the Schools card above.
Census & demographics
- Census place
- Palmview, TX
- County
- Hidalgo County · 623,128 people
- Metro
- McAllen-Edinburg-Mission, TX
- Population (ZIP)
- 78,024
- Household income
- $54,298
- Rent vs Own
- Severe rent burden
- 1714.0
Population outlook (Hidalgo County) Hauer SSP2
- Today (2025)
- 955,232 people
- By 2030
- 1,009,774 · +5.7%
- By 2040
- 1,120,332 · +17.3%
- By 2050
- 1,225,036 · +28.2%
- By 2075
- 1,439,189 · +50.7%
- By 2100
- 1,533,429 · +60.5%
Race, ethnicity, and origin ACS 2023
- Neighborhood character
- Predominantly Hispanic (85%)
- Race & ethnicity
- Hispanic / Latino 85% Two or more races 47% White 12% Asian 2%
- Hispanic origin (detail)
- Mexican 80%
- Common ancestry
- Slovak 1% Portuguese 0%
- Foreign-born
- 28% · Canada, South Korea
- Languages at home
- 22% English-only · Spanish 76%
Political lean MEDSL · Hidalgo
- 2024 margin
- Toss-up / Even · D 48.1% · R 51.0%
- 2008→2024 swing
- -41.6pp toward R · 2008: 38.7pp · 2024: -2.9pp
- All cycles
- 2024: R+2.9 2020: D+17.1 2016: D+40.5 2012: D+41.8 2008: D+38.7
Not yet ingested
- Civics
- —
Market trends
- HPI YoY
- ▼ -62.35%
- Current HPI
- 209.3573
- Rent YoY
- ▲ 0.93%
- Metro
- McAllen-Edinburg-Mission, TX
- State GDP YoY
- ▲ 3.95%
- F500 in state
- 110
Industry mix (Fortune 500 HQ in TX)
| Industry | F500 HQs | Revenue |
|---|---|---|
| Energy | 16 | $1,198B |
|
||
| Technology | 5 | $198B |
|
||
| Engineering / Construction | 4 | $72B |
|
||
| Energy Services | 3 | $60B |
|
||
| Utilities | 3 | $41B |
|
||
| Healthcare | 2 | $330B |
|
||
Price history
1 event — show timeline
- 2025-02-13 Listed $535,000 MCALLENMLS
Cash-flow waterfall
monthlySold comps — $/sqft
last 12 mo · ≤1 miLoading sold comps…