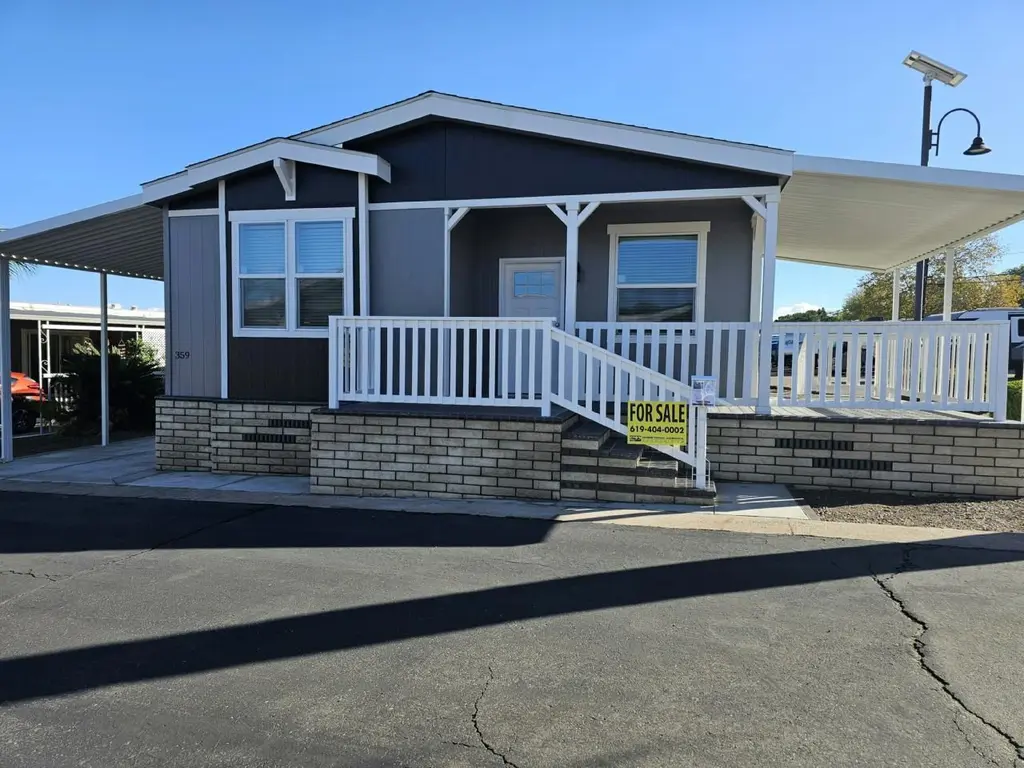
8545 Mission Gorge Rd #359 · Santee, CA
Flood risk 1/10 · Minimal
- FEMA flood zone
- X (unshaded)
- Chance of flooding over 30 yrs
- 0.0%
- Est. flood insurance / yr
- $507 – $1,088
Fire risk 5/10 · Moderate
- Est. fire insurance / yr
- $659 – $1,223
Heat risk 5/10 · Moderate
- Hot days now (above 98°F)
- 4 days/yr
- Hot days in 30 yrs
- 12 days/yr
Wind risk 1/10 · Minimal
- Chance of severe wind over 30 yrs
- —
Air-quality risk 3/10 · Minor
- Unhealthy air days now
- 4 days/yr
- Unhealthy air days in 30 yrs
- 4 days/yr
Risk factors via First Street. Map © Google.
Why this score? — see what drove the C- grade
The composite is a weighted blend of 9 inputs, each scored 0–100. Each bar is that input's sub-score; the figure is the points it added to the 100-point composite (weight × sub-score).
- Cash flow +22.7/30.0
- DSCR +7.3/10.0
- 1% rule +5.9/10.0
- Schools +4.5/10.0
- Condition / age +4.0/5.0
- Livability +3.2/5.0
- Rent growth +2.7/5.0
- ARV discount +0.0/15.0
- Appreciation +0.0/10.0
$339,900
🖨 Deal sheet 📄 Offer letter ✓ Due diligence
Listing remarks
LAST New Home at this price. Packed with value and a must see! Call today and learn about this amazing deal. Own your own home in a quiet, well-maintained neighborhood! Flexible financing options--you could pay less to own your own home than you are to rent an apartment! Call us today to schedule a showing and see all the benefits of living at Mission Gorge Villa, a professionally managed community. This BRAND new home won't last long! Call us today to view your piece of paradise!
Key facts
- Built 2026
- Listed 21 days
Property features AI
Finance
- Financial info: List price $339,900
Exterior
- Home design: Condo / Apartment unit at 8545 Mission Gorge Rd #359, Santee, CA; Spec inventory, active listing
Interior
- Bedrooms: 3 bedrooms
- Bathrooms: 2 full bathrooms
- Interior features: Living area approximately 1,568
Neighborhood map
What this means for you Summary
Snapshot
- This is a 3-bed/2.0-bath manufactured listed at $340k. Condition is rated good.
Deal economics
- At list price, monthly cash flow is $588 ($7k/yr) — positive.
- The deal already cash-flows at list — no discount required.
- Meets the 1% rule at list price ($4k rent vs $340k).
- Recommended offer: $335k (1.5% below list) — sets the bar for market timing.
- Cap rate 8.4% vs local median 2.6% in Santee — top-decile yield for the area; either an underpriced asset or a hidden risk that comps aren't pricing in. Stress-test before assuming the spread holds.
Location & tenants
- Location reads 65/100 on livability (#361 in CA) — a middle-class / working-renter tenant base. Strengths: commute A+, employment A+, crime A-; Watch: health & safety C-, amenities D, cost of living F.
- Santee (suburban): math 46% / reading 54% proficiency, ranked #130 of 517 in CA (top 25%) — acceptable for families but not a draw, mixed tenant base, ~2y average lease.
- Market conditions: Rents flat; 197 active listings in the ZIP; 9 comparable units currently listed for rent nearby; rentals leasing fast (median 3d on market — plan ~1-2 weeks tenant-placement turnaround); high-income renter base; 11,759 units permitted in San Diego County in 2024 (7,244 in 5+ unit buildings).
- This rent runs 39% of the median local income ($114k/yr) — at the standard rent-burdened threshold; future hikes will face affordability resistance.
Forward outlook
- Local home prices are declining (-3.0%/yr); year-one equity from $2k of loan paydown is wiped out by about $10k of value loss. Plan a longer hold.
- San Diego County population projected at +20% by 2050 — long-run rental-demand tailwind backs the buy-and-hold thesis.
Negotiation context
- It's been on market 21 days — a 2% lower offer ($335k) is reasonable based on typical stale-listing flexibility.
Risks & watch-outs
- Climate carrying-cost: moderate wildfire risk; extreme-heat days projected 4→12/yr by 2055 (HVAC capex compounding) — expect insurance premiums to compound above CPI over the hold.
Questions for the listing agent
- Is there a deadline driving the sale (1031 exchange, divorce, estate, relocation)? That informs how much negotiation room exists.
- What's the average days-on-market for RENTAL listings here right now (not sales)? A rising rental-DOM trend means longer vacancies and softer asking-rent achievability than the comps imply.
- What's the recent tenant-quality profile in this submarket — average credit score on applications, eviction rate, late-payment / NSF rate, and stable-employment percentage? A property-management company in the area should have these aggregated.
- How much new for-sale + rental construction is in the pipeline within 1–3 miles? Heavy new supply typically softens prices + rents 12–24 months out; constrained supply supports both.
Investment metrics
- 1% rule
- 1.09% ✓
- Cap rate
- 8.37%
- Cash-on-cash
- 7.41%
- DSCR
- 1.33
- GRM
- 7.6
CMA / ARV
- ARV (on-the-fly)
- $255,584
- Comps found
- 12
Show comp detail 12 sales within ~0.75 mi
| Address | Dist | Beds/Ba | Sqft | Sold | Price | $/sf | Match |
|---|---|---|---|---|---|---|---|
| 8301 Mission Gorge Rd #32 | 0.42mi | 3/2.0 | 1,556 (-1%) | 2mo | $199,000 | $128 | 78 |
| 8301 Mission Gorge Rd #233 | 0.36mi | 3/2.0 | 1,440 (-8%) | 1mo | $299,900 | $208 | 69 |
| 8301 Mission Gorge Rd #208 | 0.34mi | 3/2.0 | 1,440 (-8%) | 3mo | $280,000 | $194 | 68 |
| 8301 Mission Gorge Rd #331 | 0.34mi | 3/2.0 | 1,440 (-8%) | 3mo | $299,000 | $208 | 68 |
| 8301 Mission Gorge Rd #253 | 0.42mi | 3/2.0 | 1,440 (-8%) | 2mo | $235,000 | $163 | 65 |
| 8301 Mission Gorge Rd #325 | 0.36mi | 2/2.0 (-1) | 1,440 (-8%) | 3mo | $175,000 | $122 | 62 |
| 8301 Mission Gorge Rd #274 | 0.42mi | 3/2.0 | 1,392 (-11%) | 0mo | $310,000 | $223 | 62 |
| 8301 Mission Gorge Rd #131 | 0.42mi | 2/2.0 (-1) | 1,440 (-8%) | 1mo | $160,000 | $111 | 61 |
| 8301 Mission Gorge Rd #248 | 0.42mi | 3/2.0 | 1,420 (-9%) | 5mo | $141,200 | $99 | 61 |
| 8301 Mission Gorge Rd #124 | 0.36mi | 2/2.0 (-1) | 1,368 (-13%) | 0mo | $100,000 | $73 | 57 |
| 8301 Mission Gorge Rd #286 | 0.42mi | 2/2.0 (-1) | 1,368 (-13%) | 4mo | $189,000 | $138 | 51 |
| 8301 Mission Gorge Rd #172 | 0.41mi | 2/2.0 (-1) | 1,344 (-14%) | 3mo | $220,000 | $164 | 49 |
Match score weights: distance 35% · size 25% · config 20% · recency 20%. Top-matched comps best support the ARV.
Projected returns pro-forma
-3.0% appreciation · 0.85% rent growth · sell at horizon
- IRR
- -7.4%
- Equity multiple
- 0.73×
- Total profit
- $-25,474
- Equity at exit
- $50,680
- IRR
- -0.8%
- Equity multiple
- 0.95×
- Total profit
- $-4,710
- Equity at exit
- $29,388
Cash invested: $95,172 (down + closing). Projections, not guarantees.
Landlord ↔ Tenant lean methodology
- Overall (STATE)
- 18 Strongly Tenant-Friendly
- State California
- 18 Strongly Tenant-Friendly · D+13
- County
- — inherits STATE
- City
- — inherits STATE
ZIP-level market 92071
- Rents YoY
- 0.8%
- Active inventory
- 197
- Price-to-rent
- 7.6×
Monthly cashflow live
- Estimated rent
- $3,717 high interval (Pro) →
- Mortgage (P&I)
- −$1,782
- Tax est. 1.5%
- −$425 /mo · $5,098/yr
- Insurance
- −$142
- HOA
- −$0
- Vacancy / Maint / Mgmt
- −$781
- Net cashflow
- $588
Break-even live
UW: 25.0% down · 7.5% · 30yr · 1.5% tax · 5.0% vac · 8.0% maint · 8.0% mgmt
Financing live
Cash to close
- Down payment
- $84,975
- Closing costs
- $10,197
- Reserves months
- —
- Total cash needed
- —
Loan-product check · same deal, 3 products live
Conventional
25% down · 7.5% · 30yr
- Down + closing
- —
- Monthly P&I
- —
- Monthly cashflow
- —
- DSCR
- —
- Eligible?
- —
Personal DTI + credit; lowest rate.
DSCR
20% down · 8.5% · 30yr
- Down + closing
- —
- Monthly P&I
- —
- Monthly cashflow
- —
- DSCR
- —
- Eligible?
- —
No personal income docs; deal must DSCR.
Hard money
10% down · 12.0% · 12mo
- Down + closing
- —
- Monthly P&I
- —
- Monthly cashflow
- —
- DSCR
- —
- Eligible?
- —
Short-term bridge; refi at stabilization.
Rent comps 9 comps
| Address | Beds | Baths | Sqft | Rent | $/sqft | DOM | Units | Dist |
|---|---|---|---|---|---|---|---|---|
| 8745 Redwood Dr Santee, CA | 2.0–3.0 | 1.5–2.5 | 1264 | $3,100 | $2.45 | 1d | 1 | 0.69mi |
| 8714 Aruba Ln Santee, CA | 3.0 | 3.0 | 1864 | $4,300 | $2.31 | 10d | 1 | 0.69mi |
| 177 Via Montisi Santee, CA | 2.0 | 2.5 | 1239 | $3,450 | $2.78 | 1d | 1 | 0.86mi |
| 69 Via Sovana Santee, CA | 3.0 | 3.0 | 1342 | $3,600 | $2.68 | 1d | 1 | 0.86mi |
| 8434 Kreiner Way Santee, CA | 3.0 | 2.0 | 1305 | $4,213 | $3.23 | 21d | 1 | 0.93mi |
| 8621 Willow Ter Santee, CA | 3.0 | 2.0 | 1457 | $3,600 | $2.47 | 3d | 1 | 1.17mi |
| 2388 Windmill View Rd El Cajon, CA | 4.0 | 3.0 | 1962 | $5,250 | $2.68 | 21d | 1 | 1.25mi |
| 9409 Lake Murray Blvd San Diego, CA | 2.0 | 2.5 | 1290 | $3,300 | $2.56 | 17d | 1 | 1.30mi |
| 8617 Bushy Hill Dr Santee, CA | 2.0–3.0 | 2.0–3.0 | 1299 | $2,900 | $2.23 | 1d | 1 | 1.37mi |
Listing history 14 events
-
2026-06-18days on market $339,900 Active 21 DOM
-
2026-06-17days on market $339,900 Active 20 DOM
-
2026-06-16days on market $339,900 Active 19 DOM
-
2026-06-15days on market $339,900 Active 18 DOM
-
2026-06-13days on market $339,900 Active 16 DOM
-
2026-06-13days on market $339,900 Active 15 DOM
-
2026-06-09days on market $339,900 Active 12 DOM
-
2026-06-08days on market $339,900 Active 11 DOM
-
2026-06-07days on market $339,900 Active 10 DOM
-
2026-06-04days on market $339,900 Active 7 DOM
-
2026-06-03days on market $339,900 Active 6 DOM
-
2026-06-02days on market $339,900 Active 5 DOM
-
2026-06-01days on market $339,900 Active 4 DOM
-
2026-05-31days on market $339,900 Active 3 DOM
ⓘ Source: listings_history table (triggers on properties + properties_extension) + one-shot
backfill from property_details.listing_events for pre-trigger history.
Climate risk First Street
- Flood 1/10 Low FEMA zone X (unshaded) · 0% chance over 30 yrs
- Wildfire 5/10 Major
- Heat 5/10 Major 4 d/yr ≥98°F today · 12 d/yr by 30 yrs out
- Wind 1/10 Low
- Air quality 3/10 Moderate 4 unhealthy d/yr today · 4 by 30 yrs out
Nearby sold comps map
Loading sold comps map…
Walkable amenities ~0.75 mi
Loading nearby amenities…
Taxation est. · year 1
- Rental income
- $44,605
- − Mortgage interest
- −$19,040
- − Property taxes
- −$5,098
- − Insurance
- −$1,700
- − Repairs & maintenance
- −$3,568
- − Management
- −$3,568
- − Depreciation
- −$9,888
- Taxable income
- $1,743
- Est. tax owed @ 24.0%
- −$418
- After-tax cash flow
- $6,632/yr
For passive investors: Depreciation is non-cash, so a rental often shows a tax loss while cash-flowing — sheltering income. Rental losses are passive: they offset passive income freely, and up to $25,000/yr can offset ordinary (W-2) income if you actively participate and your MAGI is under $100k (phasing out to $0 by $150k); unused losses carry forward. On sale, claimed depreciation is recaptured at up to 25%, and gains may owe capital-gains tax (a 1031 exchange can defer both). Figures are a year-1 estimate at your 24.0% rate — not tax advice; consult a CPA.
Condition & rehab AI · 12 photos
This well-maintained and modern manufactured home is move-in ready with a good condition score and minimal repairs needed. Upgrades in paint, landscaping, and appliances can further enhance its value for resale or rental.
Value-add opportunities
- Both Painting the exterior and interior walls — Fresh paint can enhance curb appeal and interior aesthetics.
- Both Landscaping improvements — Enhanced landscaping can increase curb appeal and property value.
- Resale Upgrading the flooring in the bathrooms — Modern flooring can improve the look of the bathrooms and attract more buyers.
- Resale Upgrading the kitchen appliances — Modern appliances can make the kitchen more appealing to potential buyers.
- Both Upgrading the HVAC system — A more efficient HVAC system can improve comfort and energy efficiency, benefiting both resale and rental value.
Renovation cost estimate screening
Value-add ROI direction
- Both Painting the exterior and interior walls — Fresh paint can enhance curb appeal and interior aesthetics. ↑
- Both Landscaping improvements — Enhanced landscaping can increase curb appeal and property value. ↑
- Resale Upgrading the flooring in the bathrooms — Modern flooring can improve the look of the bathrooms and attract more buyers. ↑
- Resale Upgrading the kitchen appliances — Modern appliances can make the kitchen more appealing to potential buyers. ↑
- Both Upgrading the HVAC system — A more efficient HVAC system can improve comfort and energy efficiency, benefiting both resale and rental value. ↑
ⓘ Cost ranges are severity-bucket heuristics (US national rule-of-thumb). Get contractor quotes + a written scope before underwriting a rehab budget.
Schools (NCES district)
- District
- Santee
- NCES district ID
- 0635880
- Math proficiency
- 46% ▼ -3.00%
- Reading proficiency
- 54% ▼ -2.00%
- Median HH income
- $73,452
- Composite
- 45.0/100
- National rank
- #2698
- State rank
- #130 of 517 in CA
Livability — Santee
- Score
- 65/100
- State rank
- #361
- US rank
- #12272
Category grades
Schools grade is shown separately in the Schools card above.
Census & demographics
- Census place
- Santee, CA
- County
- San Diego County · 3,178,799 people
- City population
- 59,590
- Metro
- San Diego-Chula Vista-Carlsbad, CA
- Population (ZIP)
- 59,590
- Household income
- $113,618
- Rent vs Own
- Severe rent burden
- 1719.0
Population outlook (San Diego County) Hauer SSP2
- Today (2025)
- 3,678,185 people
- By 2030
- 3,856,546 · +4.8%
- By 2040
- 4,171,407 · +13.4%
- By 2050
- 4,421,607 · +20.2%
- By 2075
- 4,831,599 · +31.4%
- By 2100
- 4,832,502 · +31.4%
Race, ethnicity, and origin ACS 2023
- Neighborhood character
- Majority White (63%)
- Race & ethnicity
- White 63% Hispanic / Latino 22% Two or more races 16% Asian 5% Black 2%
- Hispanic origin (detail)
- Mexican 18%
- Common ancestry
- Slovak 3% Italian 3% Lithuanian 2%
- Foreign-born
- 13% · Canada, Vietnam, China
- Languages at home
- 81% English-only · Spanish 8% Arabic 3% Other Asian/Pacific 1%
Political lean MEDSL · San Diego
- 2024 margin
- D (+16.8) · D 56.9% · R 40.1% · Other 2.9%
- 2008→2024 swing
- +6.6pp toward D · 2008: 10.2pp · 2024: 16.8pp
- All cycles
- 2024: D+16.8 2020: D+22.8 2016: D+17.8 2012: D+5.1 2008: D+10.2
Not yet ingested
- Civics
- —
Market trends
- HPI YoY
- ▼ -607.00%
- Current HPI
- 393.1781
- Rent YoY
- ▲ 0.85%
- Metro
- San Diego-Chula Vista-Carlsbad, CA
- State GDP YoY
- ▲ 3.21%
- F500 in state
- 116
Industry mix (Fortune 500 HQ in CA)
| Industry | F500 HQs | Revenue |
|---|---|---|
| Technology | 27 | $1,492B |
|
||
| Financial Services | 3 | $174B |
|
||
| Retail | 3 | $44B |
|
||
| Insurance | 3 | $26B |
|
||
| Media / Entertainment | 2 | $115B |
|
||
| Pharmaceuticals / Biotech | 2 | $62B |
|
||
Cash-flow waterfall
monthlySold comps — $/sqft
last 12 mo · ≤1 miLoading sold comps…