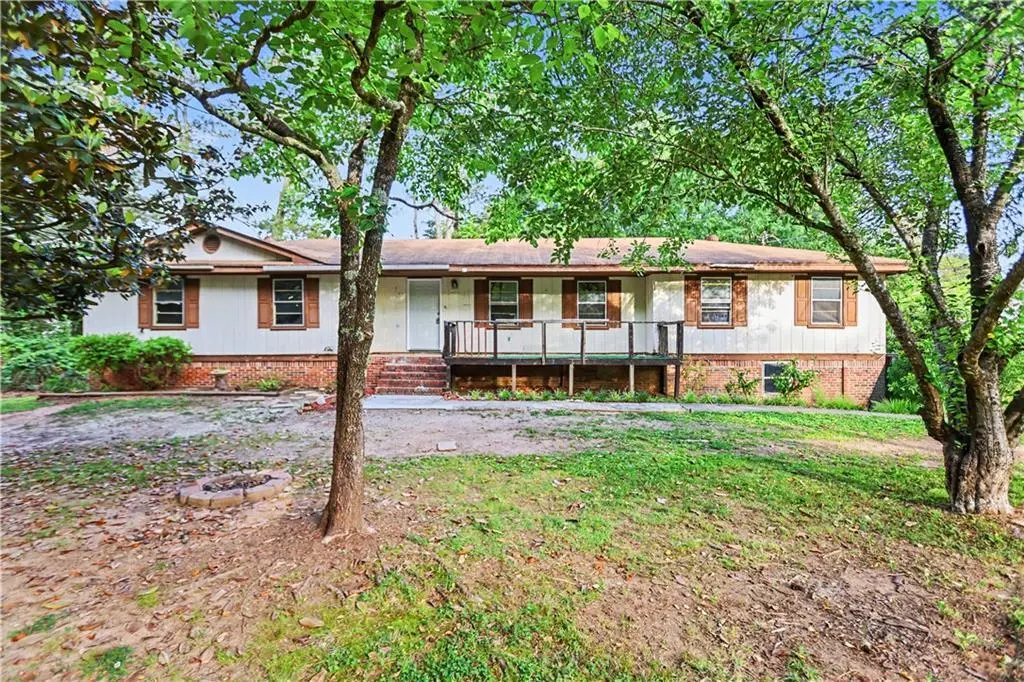
9218 Westview Dr SW · Covington, GA
Flood risk No data
- FEMA flood zone
- —
- Chance of flooding over 30 yrs
- —
- Est. flood insurance / yr
- —
Fire risk No data
- Est. fire insurance / yr
- —
Heat risk No data
- Hot days now (above threshold)
- —
- Hot days in 30 yrs
- —
Wind risk No data
- Chance of severe wind over 30 yrs
- —
Air-quality risk No data
- Unhealthy air days now
- —
- Unhealthy air days in 30 yrs
- —
Risk factors via First Street. Map © Google.
Why this score? — see what drove the C- grade
The composite is a weighted blend of 9 inputs, each scored 0–100. Each bar is that input's sub-score; the figure is the points it added to the 100-point composite (weight × sub-score).
- Cash flow +21.7/30.0
- ARV discount +7.5/15.0
- DSCR +6.9/10.0
- 1% rule +5.6/10.0
- Livability +3.0/5.0
- Rent growth +2.6/5.0
- Condition / age +2.5/5.0
- Schools +1.9/10.0
- Appreciation +0.0/10.0
$189,000
🖨 Deal sheet (PDF) 📄 Offer letter ✓ Due diligence
Listing remarks MLS
Opportunity knocks in rapidly growing Covington! This spacious brick home sits on a generous lot in an established neighborhood and is loaded with potential for the savvy investor, flipper, or creative buyer ready to bring their vision to life. With nearly 4,000 square feet, multiple living areas, and a flexible layout, the possibilities are endless - renovate and resell, create a long-term rental, or design your dream custom retreat. Nearby renovated homes and newer construction in the area continue to drive value and demand. Conveniently located near Downtown Covington, shopping, dining, and I-20, this property offers the perfect combination of location, size, and upside potential. Sold as-is with tremendous opportunity for equity growth. Don't miss your chance to transform this hidden gem into something truly special!
Key facts
- Generous lot
- Flexible layout
- Newer construction
Tags
Property features AI
Finance
- HOA & community: Near public transport, schools, shopping, trails/greenway, and restaurants
Exterior
- Parking: Driveway parking; Open parking available
- Utilities: Public water; Public sewer; 220-volt electrical service; Cable available; Electricity available; Natural gas available; Phone available
- Home design: One-level home; Basement with daylight, full, unfinished space and walk-out/exterior and interior entry; Fixer condition
- Construction: Brick, frame, and wood siding construction; Composition roof; Block foundation; Built on two combined 0.5-acre lots
- Exterior features: Private yard; Deck; Front porch; Rear porch; Patio
Interior
- Kitchen: Double oven; Stain-finished cabinets; Solid-surface or other counters; Kitchen views to the family room
- Bedrooms: Four main-level bedrooms; Double master suite; Master on main; Roommate floor plan
- Flooring: Tile flooring; Vinyl flooring; Other flooring
- Bathrooms: Three full bathrooms; Master bathroom with tub/shower combo
- Heating & cooling: Ceiling fan(s); Other heating; Other cooling
- Interior features: No common walls; Wood frame windows; Other interior features
- Laundry & utility: Main-level laundry room; Mud room; Additional laundry features
Neighborhood map
What this means for you Summary
Snapshot
- This is a 4-bed/2.0-bath single-family listed at $189k.
Deal economics
- At list price, monthly cash flow is $290 ($3k/yr) — positive.
- The deal already cash-flows at list — no discount required.
- Meets the 1% rule at list price ($2k rent vs $189k).
- Recommended offer: $183k (3.0% below list) — sets the bar for market timing.
- Cap rate 8.1% vs local median 3.8% in Covington — top-decile yield for the area; either an underpriced asset or a hidden risk that comps aren't pricing in. Stress-test before assuming the spread holds.
Location & tenants
- Location reads 59/100 on livability (#396 in GA) — a working-class tenant base; expect higher turnover. Strengths: cost of living A+, housing A+, health & safety B+; Watch: crime F, amenities F, commute F.
- Newton County (suburban): math 17% / reading 26% proficiency, ranked #137 of 174 in GA (top 79%) — low school quality limits family demand, transient renter base, plan for 1-2y turnover.
- Zoned schools: Porterdale Elementary School (math 8% / reading 12%, grade F, #1,092 of 1,228 statewide, top 91%, 417 students, 85% FRL); Clements Middle School (math 6% / reading 17%, grade F, #424 of 470 statewide, top 90%, 754 students, 85% FRL); Newton High School (math 8% / reading 12%, grade F, #365 of 424 statewide, top 88%, 2,472 students, 85% FRL) — zoned schools average 85% FRL vs 59% district-wide (26 pts higher); higher-poverty schools than district average — tighter screening recommended.
- Market conditions: Rents flat; 486 active listings in the ZIP; 1,480 units permitted in Newton County in 2024 (702 in 5+ unit buildings).
- This rent runs 33% of the median local income ($72k/yr) — at the standard rent-burdened threshold; future hikes will face affordability resistance.
Forward outlook
- Local home prices are declining (-3.0%/yr); year-one equity from $1k of loan paydown is wiped out by about $6k of value loss. Plan a longer hold.
- Newton County population projected at +23% by 2050 — long-run rental-demand tailwind backs the buy-and-hold thesis.
Negotiation context
- It's been on market 38 days — a 3% lower offer ($183k) is reasonable based on typical stale-listing flexibility.
- 13 sale attempts since 3y ago; this cycle's ask has dropped $10k (5%) from the opening price — seller is motivated, your offer sets the floor, not the list.
- Current owner paid $44k; list at $189k implies a 330% gain — meaningful room to come down on a strong offer.
Questions for the listing agent
- It's been on market 38 days. Have you received any prior offers? Is the seller open to a 3% concession, seller financing, or rate buy-down credit?
- Built in 1977 — when were the roof, HVAC, electrical panel, plumbing, and water heater last replaced?
- Is there a deadline driving the sale (1031 exchange, divorce, estate, relocation)? That informs how much negotiation room exists.
- Schools are F-rated, which usually means shorter tenancies and higher turnover. Who's the typical renter profile here, and what's been the actual vacancy rate?
- Crime grade is F in this area — have there been break-ins, vandalism, or insurance claims at this property in the last 3 years? What carrier currently insures it and at what premium?
- What's the average days-on-market for RENTAL listings here right now (not sales)? A rising rental-DOM trend means longer vacancies and softer asking-rent achievability than the comps imply.
- What's the recent tenant-quality profile in this submarket — average credit score on applications, eviction rate, late-payment / NSF rate, and stable-employment percentage? A property-management company in the area should have these aggregated.
- How much new for-sale + rental construction is in the pipeline within 1–3 miles? Heavy new supply typically softens prices + rents 12–24 months out; constrained supply supports both.
Investment metrics
- 1% rule
- 1.06% ✓
- Cap rate
- 8.14%
- Cash-on-cash
- 6.58%
- DSCR
- 1.29
- GRM
- 7.9
CMA / ARV
- ARV (median comp)
- $415,624
- List price
- $189,000
- Delta
- -54.53%
- Verdict
- UNDERPRICED
- Comps
- 20 within 1.0 mi
Show comp detail 1 sale within ~0.75 mi
| Address | Dist | Beds/Ba | Sqft | Sold | Price | $/sf | Match |
|---|---|---|---|---|---|---|---|
| 50 Riverstone Dr | 0.41mi | 5/3.0 (+1) | 3,588 (-8%) | 13mo | $454,900 | $127 | 48 |
Match score weights: distance 35% · size 25% · config 20% · recency 20%. Top-matched comps best support the ARV.
Projected returns pro-forma
-3.0% appreciation · 0.52% rent growth · sell at horizon
- IRR
- -9.0%
- Equity multiple
- 0.68×
- Total profit
- $-16,981
- Equity at exit
- $28,181
- IRR
- -3.1%
- Equity multiple
- 0.81×
- Total profit
- $-9,896
- Equity at exit
- $16,341
Cash invested: $52,920 (down + closing). Projections, not guarantees.
Landlord ↔ Tenant lean methodology
- Overall (STATE)
- 90 Strongly Landlord-Friendly
- State Georgia
- 90 Strongly Landlord-Friendly · R+3
- County
- — inherits STATE
- City
- — inherits STATE
ZIP-level market 30014
- Home prices YoY
- -19.2%
- Rents YoY
- 0.5%
- Active inventory
- 486
- Price-to-rent
- 7.9×
Monthly cashflow live
- Estimated rent
- $1,998 medium interval (Pro) →
- Mortgage (P&I)
- −$991
- Tax from tax record
- −$218 /mo · $2,622/yr
- Insurance
- −$79
- HOA
- −$0
- Vacancy / Maint / Mgmt
- −$420
- Net cashflow
- $290
Break-even live
Sensitivity live
| Price | -10% $397 | -5% $344 | +0% $290 | +5% $237 | +10% $183 |
|---|---|---|---|---|---|
| Rent | -10% $132 | -5% $211 | +0% $290 | +5% $369 | +10% $448 |
| Rate | -1.0pp $386 | -0.5pp $338 | base $290 | +0.5pp $241 | +1.0pp $192 |
UW: 25.0% down · 7.5% · 30yr · 1.5% tax · 5.0% vac · 8.0% maint · 8.0% mgmt
Financing live
Cash to close
- Down payment
- $47,250
- Closing costs
- $5,670
- Reserves months
- —
- Total cash needed
- —
Loan-product check · same deal, 3 products live
Conventional
25% down · 7.5% · 30yr
- Down + closing
- —
- Monthly P&I
- —
- Monthly cashflow
- —
- DSCR
- —
- Eligible?
- —
Personal DTI + credit; lowest rate.
DSCR
20% down · 8.5% · 30yr
- Down + closing
- —
- Monthly P&I
- —
- Monthly cashflow
- —
- DSCR
- —
- Eligible?
- —
No personal income docs; deal must DSCR.
Hard money
10% down · 12.0% · 12mo
- Down + closing
- —
- Monthly P&I
- —
- Monthly cashflow
- —
- DSCR
- —
- Eligible?
- —
Short-term bridge; refi at stabilization.
Listing history 48 events
-
2026-06-21days on market $189,000 Active 38 DOM
-
2026-06-18days on market $189,000 Active 35 DOM
-
2026-06-17days on market $189,000 Active 34 DOM
-
2026-06-16days on market $189,000 Active 33 DOM
-
2026-06-15days on market $189,000 Active 32 DOM
-
2026-06-13days on market $189,000 Active 30 DOM
-
2026-06-13days on market $189,000 Active 29 DOM
-
2026-06-09days on market $189,000 Active 26 DOM
-
2026-06-08days on market $189,000 Active 25 DOM
-
2026-06-07days on market $189,000 Active 24 DOM
-
2026-06-04days on market $189,000 Active 21 DOM
-
2026-06-03days on market $189,000 Active 20 DOM
-
2026-06-02days on market $189,000 Active 19 DOM
-
2026-06-01days on market $189,000 Active 18 DOM
-
2026-05-31days on market $189,000 Active 17 DOM
-
2026-05-14$199,000 New 832-char remark
Show marketing remark (832 chars)
Opportunity knocks in rapidly growing Covington! This spacious brick home sits on a generous lot in an established neighborhood and is loaded with potential for the savvy investor, flipper, or creative buyer ready to bring their vision to life. With nearly 4,000 square feet, multiple living areas, and a flexible layout, the possibilities are endless - renovate and resell, create a long-term rental, or design your dream custom retreat. Nearby renovated homes and newer construction in the area continue to drive value and demand. Conveniently located near Downtown Covington, shopping, dining, and I-20, this property offers the perfect combination of location, size, and upside potential. Sold as-is with tremendous opportunity for equity growth. Don't miss your chance to transform this hidden gem into something truly special!
-
2026-05-14$199,000 Active 844-char remark
Show marketing remark (832 chars)
Opportunity knocks in rapidly growing Covington! This spacious brick home sits on a generous lot in an established neighborhood and is loaded with potential for the savvy investor, flipper, or creative buyer ready to bring their vision to life. With nearly 4,000 square feet, multiple living areas, and a flexible layout, the possibilities are endless - renovate and resell, create a long-term rental, or design your dream custom retreat. Nearby renovated homes and newer construction in the area continue to drive value and demand. Conveniently located near Downtown Covington, shopping, dining, and I-20, this property offers the perfect combination of location, size, and upside potential. Sold as-is with tremendous opportunity for equity growth. Don't miss your chance to transform this hidden gem into something truly special!
-
2024-10-23status Active
-
2024-10-22historical
-
2024-04-12status Pending
-
2024-04-12status Under Contract
-
2024-04-08historical
-
2024-04-02price $159,500
-
2024-04-02price $159,500
-
2024-03-06price $168,500
-
2024-03-06price $168,500
-
2024-03-04status Back On Market
-
2024-03-04status Active
-
2024-02-21historical Active Under Contract
-
2024-02-21historical Active Under Contract
-
2024-02-20status Active
-
2024-02-20status Back On Market
-
2024-02-13status Under Contract
-
2024-02-13status Pending
-
2024-02-07price $172,500
-
2024-02-07price $172,500
-
2024-01-15$175,000 Active
-
2023-12-31historical
-
2023-12-07status Back On Market
-
2023-11-07historical On Hold
-
2023-11-03status Back On Market
-
2023-05-18historical
-
2023-05-13status Back On Market
-
2023-04-12historical On Hold
-
2023-03-22price $174,000
-
2023-02-27$175,000 New
-
2023-02-27$179,000 Active
-
1976-05-17soldstatus $44,000
ⓘ Source: listings_history table (triggers on properties + properties_extension) + one-shot
backfill from property_details.listing_events for pre-trigger history.
Tax reassessment forecast GA · Resets to sale price
- Current annual tax
- $2,622 · $218/mo
- Projected year-2 tax
- $2,622 · $218/mo
- Expected delta
- $0/yr ($0/mo · 0.0%)
ⓘ Screening estimate from a state-policy table — verify with the county assessor before closing.
Nearby sold comps map
Loading sold comps map…
Walkable amenities ~0.75 mi
Loading nearby amenities…
Taxation est. · year 1
- Rental income
- $23,981
- − Mortgage interest
- −$10,587
- − Property taxes
- −$2,622
- − Insurance
- −$945
- − Repairs & maintenance
- −$1,918
- − Management
- −$1,918
- − Depreciation
- −$5,498
- Taxable income
- $492
- Est. tax owed @ 24.0%
- −$118
- After-tax cash flow
- $3,366/yr
For passive investors: Depreciation is non-cash, so a rental often shows a tax loss while cash-flowing — sheltering income. Rental losses are passive: they offset passive income freely, and up to $25,000/yr can offset ordinary (W-2) income if you actively participate and your MAGI is under $100k (phasing out to $0 by $150k); unused losses carry forward. On sale, claimed depreciation is recaptured at up to 25%, and gains may owe capital-gains tax (a 1031 exchange can defer both). Figures are a year-1 estimate at your 24.0% rate — not tax advice; consult a CPA.
Schools (NCES district)
- District
- Newton County
- NCES district ID
- 1303930
- Math proficiency
- 17% ▼ -13.00%
- Reading proficiency
- 26% ▼ -8.00%
- Median HH income
- $50,768
- Composite
- 19.2/100
- National rank
- #8816
- State rank
- #137 of 174 in GA
Livability — Covington
- Score
- 59/100
- State rank
- #396
- US rank
- #19602
Category grades
Schools grade is shown separately in the Schools card above.
Census & demographics
- Census place
- Covington, GA
- County
- Newton County · 104,393 people
- City population
- 104,393
- Metro
- Atlanta-Sandy Springs-Alpharetta, GA
- Population (ZIP)
- 41,425
- Household income
- $72,254
- Rent vs Own
- Severe rent burden
- 1934.0
Population outlook (Newton County) Hauer SSP2
- Today (2025)
- 118,372 people
- By 2030
- 124,234 · +5.0%
- By 2040
- 135,550 · +14.5%
- By 2050
- 145,309 · +22.8%
- By 2075
- 166,843 · +40.9%
- By 2100
- 175,800 · +48.5%
Race, ethnicity, and origin ACS 2023
- Neighborhood character
- Diverse neighborhood (Simpson 0.59)
- Race & ethnicity
- White 53% Black 35% Hispanic / Latino 7% Two or more races 6% Asian 2%
- Hispanic origin (detail)
- Mexican 3%
- Common ancestry
- Italian 2% Slovak 2% Serbian 1%
- Foreign-born
- 7% · Canada
- Languages at home
- 93% English-only · Spanish 5% Other Indo-European 1%
Political lean MEDSL · Newton
- 2024 margin
- D (+15.1) · D 57.3% · R 42.2%
- 2008→2024 swing
- +14.0pp toward D · 2008: 1.2pp · 2024: 15.1pp
- All cycles
- 2024: D+15.1 2020: D+10.9 2016: D+2.4 2012: D+2.0 2008: D+1.2
Not yet ingested
- Civics
- —
Market trends
- HPI YoY
- ▼ -64.50%
- Current HPI
- 270.9868
- Rent YoY
- ▲ 0.52%
- Metro
- Atlanta-Sandy Springs-Alpharetta, GA
- State GDP YoY
- ▲ 2.66%
- F500 in state
- 28
Industry mix (Fortune 500 HQ in GA)
| Industry | F500 HQs | Revenue |
|---|---|---|
| Paper / Packaging | 2 | $29B |
|
||
| Retail | 1 | $160B |
|
||
| Transportation / Logistics | 1 | $91B |
|
||
| Airlines | 1 | $62B |
|
||
| Consumer Goods | 1 | $47B |
|
||
| Utilities | 1 | $25B |
|
||
Price history
+329.5% since first listed35 events — show timeline
- 2026-05-29 Price Changed $189,000 GAMLS
- 2026-05-29 Price Changed $189,000 FMLS
- 2026-05-14 Listed $199,000 FMLS
- 2026-05-14 Listed $199,000 GAMLS
- 2024-10-23 Relisted — FMLS
- 2024-10-22 Listing Removed — FMLS
- 2024-04-12 Pending — FMLS
- 2024-04-12 Pending — GAMLS
- 2024-04-08 Listing Removed — GAMLS
- 2024-04-02 Price Changed $159,500 FMLS
- 2024-04-02 Price Changed $159,500 GAMLS
- 2024-03-06 Price Changed $168,500 FMLS
- 2024-03-06 Price Changed $168,500 GAMLS
- 2024-03-04 Relisted — GAMLS
- 2024-03-04 Relisted — FMLS
- 2024-02-21 Contingent — GAMLS
- 2024-02-21 Contingent — FMLS
- 2024-02-20 Relisted — FMLS
- 2024-02-20 Relisted — GAMLS
- 2024-02-13 Pending — GAMLS
- 2024-02-13 Pending — FMLS
- 2024-02-07 Price Changed $172,500 FMLS
- 2024-02-07 Price Changed $172,500 GAMLS
- 2024-01-15 Listed $175,000 FMLS
- 2023-12-31 Listing Removed — GAMLS
- 2023-12-07 Relisted — GAMLS
- 2023-11-07 Delisted — GAMLS
- 2023-11-03 Relisted — GAMLS
- 2023-05-18 Listing Removed — GAMLS
- 2023-05-13 Relisted — GAMLS
- 2023-04-12 Delisted — GAMLS
- 2023-03-22 Price Changed $174,000 GAMLS
- 2023-02-27 Listed $179,000 GAMLS
- 2023-02-27 Listed $175,000 GAMLS
- 1976-05-17 Sold (Public Records) $44,000 Public Records
Property tax history
+7.7%/yrLatest (2025): $2,622 · +17.3% YoY. Source: county tax records.
Cash-flow waterfall
monthlySold comps — $/sqft
last 12 mo · ≤1 miLoading sold comps…