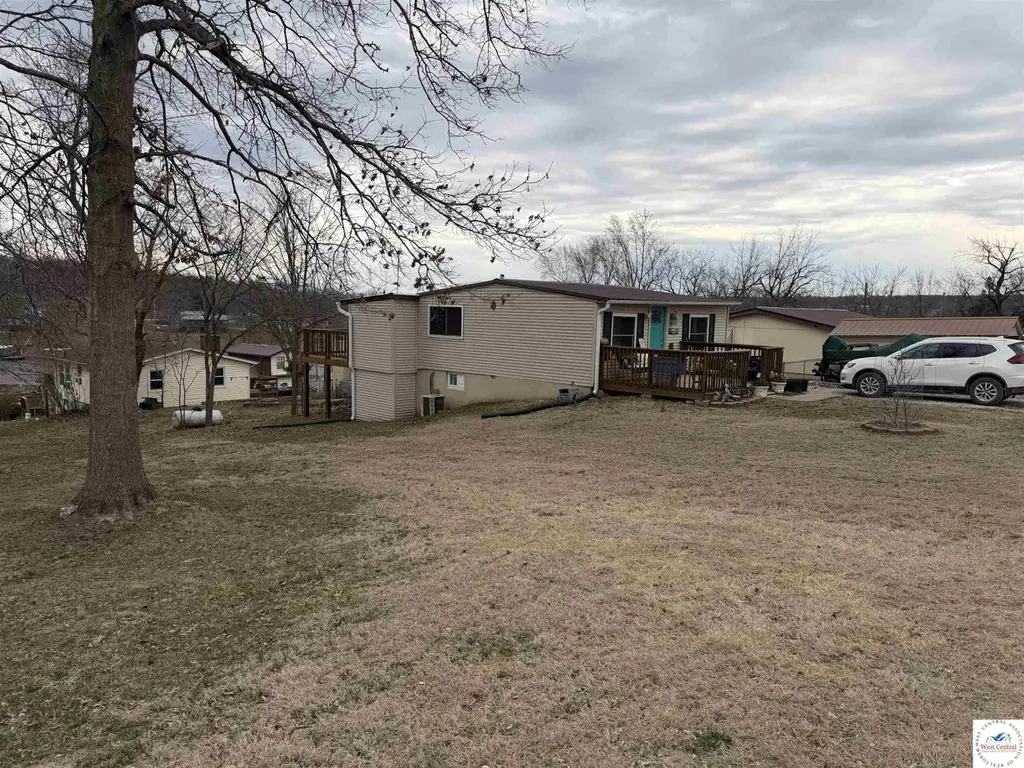
28464 Bali Ave · Warsaw, MO
Flood risk 6/10 · Moderate
- FEMA flood zone
- X (unshaded)
- Chance of flooding over 30 yrs
- 0.68%
- Est. flood insurance / yr
- $473 – $860
Fire risk 2/10 · Minimal
- Est. fire insurance / yr
- $1,054 – $1,958
Heat risk 4/10 · Minor
- Hot days now (above 108°F)
- 7 days/yr
- Hot days in 30 yrs
- 18 days/yr
Wind risk 2/10 · Minimal
- Chance of severe wind over 30 yrs
- 0.0%
Air-quality risk 1/10 · Minimal
- Unhealthy air days now
- 0 days/yr
- Unhealthy air days in 30 yrs
- 0 days/yr
Risk factors via First Street. Map © Google.
Why this score? — see what drove the C grade
The composite is a weighted blend of 9 inputs, each scored 0–100. Each bar is that input's sub-score; the figure is the points it added to the 100-point composite (weight × sub-score).
- Cash flow +16.0/30.0
- ARV discount +15.0/15.0
- Appreciation +7.7/10.0
- DSCR +4.9/10.0
- 1% rule +4.4/10.0
- Livability +3.2/5.0
- Schools +3.0/10.0
- Rent growth +2.5/5.0
- Condition / age +2.5/5.0
$139,900
🖨 Deal sheet 📄 Offer letter ✓ Due diligence
Listing remarks MLS
Welcome to this charming 4-bedroom, 1-bath second-tier home near the Lake of the Ozarks, perfectly positioned to capture beautiful lake views near the 84 Mile Marker. This inviting lake property offers the perfect blend of comfort, outdoor living, and extra space for all your lake toys. The home features new windows that bring in plenty of natural light and highlight the surrounding lake scenery. Enjoy relaxing mornings and peaceful evenings on the welcoming front porch, or entertain friends and family on the large wrap-around back deck while taking in the view of the water. Boating enthusiasts will appreciate the community dock access, making it easy to get out on the lake for fishing, cruising, or a day on the water. This property also includes a second lot, providing valuable additional space with a large carport—perfect for parking boats, vehicles, or extra lake equipment. Whether you’re searching for a weekend lake retreat, full-time residence, or investment property, this beautiful Lake of the Ozarks home offers incredible views, extra parking, and the true lake lifestyle.
Key facts
- Lake views
- Large carport
- 5,400 sq ft lot
Tags
Neighborhood map
What this means for you Summary
Snapshot
- This is a 4-bed/1.0-bath other listed at $140k.
Deal economics
- At list price, monthly cash flow is $68 ($822/yr) — positive.
- The deal already cash-flows at list — no discount required.
- To meet the 1% rule (rent ≥ 1% of price), the offer needs to be $132k (5.9% below list).
- Recommended offer: $127k (9.0% below list) — sets the bar for market timing.
- Cap rate 6.9% vs local median 3.3% in Warsaw — top-decile yield for the area; either an underpriced asset or a hidden risk that comps aren't pricing in. Stress-test before assuming the spread holds.
Location & tenants
- Location reads 63/100 on livability (#332 in MO) — a middle-class / working-renter tenant base. Strengths: cost of living A+, housing A+; Watch: schools F, crime D-, amenities F.
- Warsaw R-IX (rural): math 30% / reading 42% proficiency, ranked #222 of 324 in MO (top 68%) — families likely to look elsewhere, expect single-tenant / working-renter base with shorter leases; 61% free/reduced lunch — lower-income household profile, screen leases tightly.
- Market conditions: 259 active listings in the ZIP; 9 units permitted in Benton County in 2024 (0 in 5+ unit buildings).
Forward outlook
- In year one you build about $9k of equity ($967 loan paydown + $8k appreciation (5.5% local appreciation)).
- Benton County population projected at -21% by 2050 — secular population decline; favor cash flow + early exit over multi-decade hold.
- At projected returns (5.5% appreciation + 3.0% rent growth), your $39k cash investment doubles in ~4 years — after that, you're playing with house money.
- By year 5, paydown + projected appreciation supports a ~$38k cash-out refi (75% LTV) — recoverable capital for the next deal without selling this one.
Negotiation context
- It's been on market 98 days — a 9% lower offer ($127k) is reasonable based on typical stale-listing flexibility.
- 6 sale attempts since 2y ago; this cycle's ask has dropped $20k (13%) from the opening price — seller is motivated, your offer sets the floor, not the list.
Risks & watch-outs
- Watch-outs: built in 1955 — expect roof / HVAC / electrical / plumbing capex.
- Climate carrying-cost: major flood risk — expect insurance premiums to compound above CPI over the hold.
Questions for the listing agent
- It's been on market 98 days. Have you received any prior offers? Is the seller open to a 9% concession, seller financing, or rate buy-down credit?
- Built in 1955 — when were the roof, HVAC, electrical panel, plumbing, and water heater last replaced?
- What does the HOA fee cover, when was the last increase, and are there any pending special assessments or reserve-fund shortfalls?
- Why hasn't it sold? Are there any deal-killer items the seller is aware of (foundation, flood, title, zoning, code violations)?
- Is there a deadline driving the sale (1031 exchange, divorce, estate, relocation)? That informs how much negotiation room exists.
- Schools are F-rated, which usually means shorter tenancies and higher turnover. Who's the typical renter profile here, and what's been the actual vacancy rate?
- Crime grade is D in this area — have there been break-ins, vandalism, or insurance claims at this property in the last 3 years? What carrier currently insures it and at what premium?
- What's the average days-on-market for RENTAL listings here right now (not sales)? A rising rental-DOM trend means longer vacancies and softer asking-rent achievability than the comps imply.
- What's the recent tenant-quality profile in this submarket — average credit score on applications, eviction rate, late-payment / NSF rate, and stable-employment percentage? A property-management company in the area should have these aggregated.
- How much new for-sale + rental construction is in the pipeline within 1–3 miles? Heavy new supply typically softens prices + rents 12–24 months out; constrained supply supports both.
Investment metrics
- 1% rule
- 0.94% ✗
- Cap rate
- 6.88%
- Cash-on-cash
- 2.10%
- DSCR
- 1.09
- GRM
- 8.9
CMA / ARV
- ARV (median comp)
- $251,372
- List price
- $139,900
- Delta
- -44.35%
- Verdict
- UNDERPRICED
- Comps
- 3 within 1.0 mi
Projected returns pro-forma
5.45% appreciation · 3.0% rent growth · sell at horizon
- IRR
- 15.8%
- Equity multiple
- 2.03×
- Total profit
- $40,252
- Equity at exit
- $83,134
- IRR
- 16.0%
- Equity multiple
- 3.97×
- Total profit
- $116,381
- Equity at exit
- $146,772
Cash invested: $39,172 (down + closing). Projections, not guarantees.
Landlord ↔ Tenant lean methodology
- Overall (STATE)
- 81 Strongly Landlord-Friendly
- State Missouri
- 81 Strongly Landlord-Friendly · R+10
- County
- — inherits STATE
- City
- — inherits STATE
ZIP-level market 65355
- Home prices YoY
- 2.4%
- Active inventory
- 259
- Price-to-rent
- 8.9×
Monthly cashflow live
- Estimated rent
- $1,317 medium interval (Pro) →
- Mortgage (P&I)
- −$734
- Tax est. 1.5%
- −$175 /mo · $2,098/yr
- Insurance
- −$58
- HOA
- −$5
- Vacancy / Maint / Mgmt
- −$277
- Net cashflow
- $68
Break-even live
UW: 25.0% down · 7.5% · 30yr · 1.5% tax · 5.0% vac · 8.0% maint · 8.0% mgmt
Financing live
Cash to close
- Down payment
- $34,975
- Closing costs
- $4,197
- Reserves months
- —
- Total cash needed
- —
Loan-product check · same deal, 3 products live
Conventional
25% down · 7.5% · 30yr
- Down + closing
- —
- Monthly P&I
- —
- Monthly cashflow
- —
- DSCR
- —
- Eligible?
- —
Personal DTI + credit; lowest rate.
DSCR
20% down · 8.5% · 30yr
- Down + closing
- —
- Monthly P&I
- —
- Monthly cashflow
- —
- DSCR
- —
- Eligible?
- —
No personal income docs; deal must DSCR.
Hard money
10% down · 12.0% · 12mo
- Down + closing
- —
- Monthly P&I
- —
- Monthly cashflow
- —
- DSCR
- —
- Eligible?
- —
Short-term bridge; refi at stabilization.
HOA detail
- Monthly dues
- $5 · $60/yr
- Likely covers
- water
Listing history 29 events
-
2026-06-18days on market $139,900 Active 98 DOM
-
2026-06-17days on market $139,900 Active 97 DOM
-
2026-06-16days on market $139,900 Active 96 DOM
-
2026-06-15days on market $139,900 Active 95 DOM
-
2026-06-13days on market $139,900 Active 93 DOM
-
2026-06-12days on market $139,900 Active 92 DOM
-
2026-06-09days on market $139,900 Active 89 DOM
-
2026-06-08days on market $139,900 Active 88 DOM
-
2026-06-07days on market $139,900 Active 87 DOM
-
2026-06-07days on market $139,900 Active 86 DOM
-
2026-06-04days on market $139,900 Active 83 DOM
-
2026-06-03price $139,900 Active 82 DOM
-
2026-06-02days on market $149,900 Active 82 DOM
-
2026-06-01days on market $149,900 Active 81 DOM
-
2026-05-31days on market $149,900 Active 80 DOM
-
2026-05-31days on market $149,900 Active 79 DOM
-
2026-03-12$159,900 Active 1107-char remark
Show marketing remark (1107 chars)
Welcome to this charming 4-bedroom, 1-bath second-tier home near the Lake of the Ozarks, perfectly positioned to capture beautiful lake views near the 84 Mile Marker. This inviting lake property offers the perfect blend of comfort, outdoor living, and extra space for all your lake toys. The home features new windows that bring in plenty of natural light and highlight the surrounding lake scenery. Enjoy relaxing mornings and peaceful evenings on the welcoming front porch, or entertain friends and family on the large wrap-around back deck while taking in the view of the water. Boating enthusiasts will appreciate the community dock access, making it easy to get out on the lake for fishing, cruising, or a day on the water. This property also includes a second lot, providing valuable additional space with a large carport—perfect for parking boats, vehicles, or extra lake equipment. Whether you’re searching for a weekend lake retreat, full-time residence, or investment property, this beautiful Lake of the Ozarks home offers incredible views, extra parking, and the true lake lifestyle.
-
2026-01-13historical
-
2025-07-25price $160,000
-
2025-07-25price $160,000
-
2025-07-25price $160,000
-
2025-07-01$170,000 Active
-
2025-07-01$170,000 Active
-
2025-06-30historical
-
2025-04-15historical
-
2025-02-25$170,000 Active
-
2025-02-25$170,000 Active
-
2024-10-15$170,000 Active
-
1990-04-01soldstatus
ⓘ Source: listings_history table (triggers on properties + properties_extension) + one-shot
backfill from property_details.listing_events for pre-trigger history.
Climate risk First Street
- Flood 6/10 Major FEMA zone X (unshaded) · 68% chance over 30 yrs
- Wildfire 2/10 Low
- Heat 4/10 Moderate 7 d/yr ≥108°F today · 18 d/yr by 30 yrs out
- Wind 2/10 Low 0% chance of damaging wind over 30 yrs
- Air quality 1/10 Low 0 unhealthy d/yr today · 0 by 30 yrs out
Nearby sold comps map
Loading sold comps map…
Walkable amenities ~0.75 mi
Loading nearby amenities…
Taxation est. · year 1
- Rental income
- $15,802
- − Mortgage interest
- −$7,837
- − Property taxes
- −$2,098
- − Insurance
- −$700
- − Repairs & maintenance
- −$1,264
- − Management
- −$1,264
- − HOA
- −$60
- − Depreciation
- −$4,070
- Taxable loss
- −$1,491
- Est. tax savings @ 24.0%
- +$358
- After-tax cash flow
- $1,179/yr
For passive investors: Depreciation is non-cash, so a rental often shows a tax loss while cash-flowing — sheltering income. Rental losses are passive: they offset passive income freely, and up to $25,000/yr can offset ordinary (W-2) income if you actively participate and your MAGI is under $100k (phasing out to $0 by $150k); unused losses carry forward. On sale, claimed depreciation is recaptured at up to 25%, and gains may owe capital-gains tax (a 1031 exchange can defer both). Figures are a year-1 estimate at your 24.0% rate — not tax advice; consult a CPA.
Schools (NCES district)
- District
- Warsaw R-IX
- NCES district ID
- 2931070
- Math proficiency
- 30% ▬ 0.00%
- Reading proficiency
- 42% ▲ 4.00%
- Median HH income
- $33,160
- Composite
- 29.53/100
- National rank
- #6495
- State rank
- #222 of 324 in MO
Livability — Warsaw
- Score
- 63/100
- State rank
- #332
- US rank
- #15201
Category grades
Schools grade is shown separately in the Schools card above.
Census & demographics
- Population (ZIP)
- 11,029
Population outlook (Benton County) Hauer SSP2
- Today (2025)
- 17,355 people
- By 2030
- 16,513 · -4.9%
- By 2040
- 14,898 · -14.2%
- By 2050
- 13,662 · -21.3%
- By 2075
- 11,308 · -34.8%
- By 2100
- 8,755 · -49.6%
Race, ethnicity, and origin ACS 2023
- Neighborhood character
- Predominantly White (92%)
- Race & ethnicity
- White 92% Two or more races 6% Hispanic / Latino 2% Native American 1%
- Common ancestry
- Slovak 3% Italian 2% Iranian 2%
- Foreign-born
- 1% · Canada
Political lean MEDSL · Benton
- 2024 margin
- Solid R (+59.1) · D 20.1% · R 79.2%
- 2008→2024 swing
- -36.8pp toward R · 2008: -22.3pp · 2024: -59.1pp
- All cycles
- 2024: R+59.1 2020: R+56.6 2016: R+54.1 2012: R+34.3 2008: R+22.3
Not yet ingested
- Civics
- —
Market trends
- HPI YoY
- ▲ 5.45%
- Current HPI
- 232.6924
- Rent YoY
- —
- Metro
- —
- State GDP YoY
- ▲ 1.84%
- F500 in state
- 20
Industry mix (Fortune 500 HQ in MO)
| Industry | F500 HQs | Revenue |
|---|---|---|
| Healthcare | 1 | $163B |
|
||
| Insurance | 1 | $21B |
|
||
| Industrial Technology | 1 | $17B |
|
||
| Retail | 1 | $16B |
|
||
| Industrial Distribution | 1 | $10B |
|
||
| Utilities | 1 | $9B |
|
||
Price history
-5.9% since first listed13 events — show timeline
- 2026-03-12 Listed $159,900 WCAR
- 2026-01-13 Listing Removed — Heartland MLS as Distributed by MLS Grid
- 2025-07-25 Price Changed $160,000 WCAR
- 2025-07-25 Price Changed $160,000 LOBR
- 2025-07-25 Price Changed $160,000 Heartland MLS as Distributed by MLS Grid
- 2025-07-01 Listed $170,000 WCAR
- 2025-07-01 Listed $170,000 Heartland MLS as Distributed by MLS Grid
- 2025-06-30 Coming Soon — Heartland MLS as Distributed by MLS Grid
- 2025-04-15 Listing Removed — Heartland MLS as Distributed by MLS Grid
- 2025-02-25 Listed $170,000 Heartland MLS as Distributed by MLS Grid
- 2025-02-25 Listed $170,000 WCAR
- 2024-10-15 Listed $170,000 WCAR
- 1990-04-01 Sold (Public Records) — Public Records
Property tax history
+2.7%/yrLatest (2025): $258 · +5.8% YoY. Source: county tax records.
Cash-flow waterfall
monthlySold comps — $/sqft
last 12 mo · ≤1 miLoading sold comps…