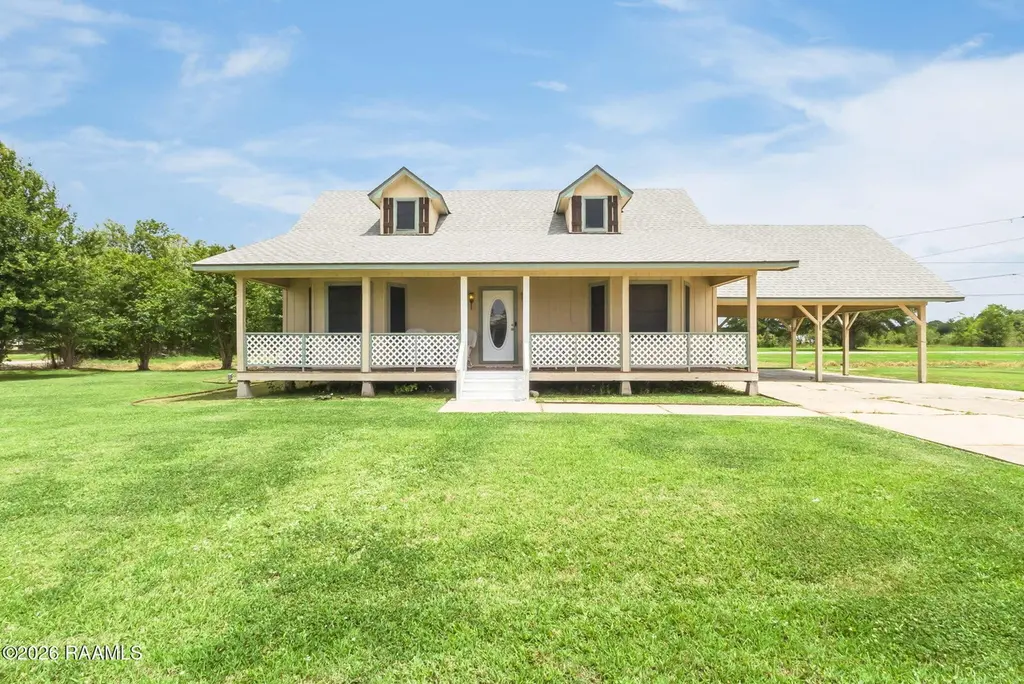
101 Lynda St · Ossun, LA
Flood risk 7/10 · Major
- FEMA flood zone
- X (unshaded)
- Chance of flooding over 30 yrs
- 0.99%
- Est. flood insurance / yr
- $507 – $1,088
Fire risk 3/10 · Minor
- Est. fire insurance / yr
- $1,269 – $2,357
Heat risk 8/10 · Major
- Hot days now (above 109°F)
- 7 days/yr
- Hot days in 30 yrs
- 20 days/yr
Wind risk 9/10 · Severe
- Chance of severe wind over 30 yrs
- 99.0%
Air-quality risk 2/10 · Minimal
- Unhealthy air days now
- 1 days/yr
- Unhealthy air days in 30 yrs
- 1 days/yr
Risk factors via First Street. Map © Google.
Why this score? — see what drove the B- grade
The composite is a weighted blend of 9 inputs, each scored 0–100. Each bar is that input's sub-score; the figure is the points it added to the 100-point composite (weight × sub-score).
- Cash flow +25.5/30.0
- ARV discount +15.0/15.0
- DSCR +8.4/10.0
- 1% rule +5.6/10.0
- Schools +3.6/10.0
- Livability +3.0/5.0
- Rent growth +2.5/5.0
- Condition / age +2.5/5.0
- Appreciation +0.0/10.0
$174,900
🖨 Deal sheet (PDF) 📄 Offer letter ✓ Due diligence
Listing remarks MLS
Country living at its best! This 2,200sf, 2 story, 3 bed 2 bath spacious home sits on just under half an acre. You are minutes away from local Carencro shopping. This home has beautiful landscaping and a great size yard with a fantastic living room that is ready for a growing family! This home has never flooded.The boat cover and storage building closest to the boat cover are reserved.
Key facts
- 0.48 acre lot
- 2 parking spots
- Built 1982
Property features AI
Exterior
- Parking: Carport (2 covered spaces)
- Utilities: Septic tank; Electric service: SLEMCO
- Home design: Single family residence; Fixer condition
- Construction: HardiPlank and frame construction; Asbestos shingle roof
- Exterior features: Porch; Barbed wire fencing
Interior
- Kitchen: Dishwasher; Refrigerator; Electric stove/convection
- Bathrooms: 2 full bathrooms
- Heating & cooling: Central heating; Central air; Multiple cooling units
- Interior features: Double vanity
- Laundry & utility: Washer hookup; Electric dryer hookup
Neighborhood map
What this means for you Summary
Snapshot
- This is a 3-bed/2.0-bath single-family listed at $175k.
Deal economics
- At list price, monthly cash flow is $339 ($4k/yr) — positive.
- The deal already cash-flows at list — no discount required.
- Meets the 1% rule at list price ($2k rent vs $175k).
- Recommended offer: $172k (1.5% below list) — sets the bar for market timing.
- Cap rate 9.1% vs local median 3.9% in Ossun — top-decile yield for the area; either an underpriced asset or a hidden risk that comps aren't pricing in. Stress-test before assuming the spread holds.
Location & tenants
- Location reads 59/100 on livability (#274 in LA) — a working-class tenant base; expect higher turnover. Strengths: cost of living A+, housing A, crime B; Watch: employment D+, amenities F, commute F.
- Lafayette Parish (urban): math 38% / reading 46% proficiency, ranked #19 of 98 in LA (top 19%) — families likely to look elsewhere, expect single-tenant / working-renter base with shorter leases.
- Zoned schools: Ossun Elementary School (math 35% / reading 38%, grade F, #269 of 646 statewide, top 42%, 519 students, 76% FRL); Carencro Middle School (math 18% / reading 28%, grade F, #145 of 218 statewide, top 69%, 665 students, 75% FRL); Carencro High School (math 30% / reading 29%, grade F, #127 of 265 statewide, top 49%, 1,096 students, 69% FRL) — zoned schools average 73% FRL vs 56% district-wide (17 pts higher); higher-poverty schools than district average — tighter screening recommended.
- Zoned-school proficiency averages 30% at this address vs 42% district-wide (-12 pts) — the specific schools serving this property underperform the Lafayette Parish average; the district grade overstates school quality for this exact location.
- Market conditions: 281 active listings in the ZIP; 12 comparable units currently listed for rent nearby; rentals at typical pace (median 23d on market — plan ~3-4 weeks tenant-placement turnaround); 42% of comp listings sitting > 30 days — soft ceiling on asking rent; 1,585 units permitted in Lafayette Parish in 2024 (10 in 5+ unit buildings).
Forward outlook
- Local home prices are declining (-3.0%/yr); year-one equity from $1k of loan paydown is wiped out by about $5k of value loss. Plan a longer hold.
- Lafayette County population projected at +34% by 2050 — long-run rental-demand tailwind backs the buy-and-hold thesis.
Negotiation context
- It's been on market 17 days — a 2% lower offer ($172k) is reasonable based on typical stale-listing flexibility.
- 2 sale attempts since 6y ago with the ask held roughly flat each time — persistent listings suggest the price (not the market) is what's stuck; bring a comps-based counter.
Risks & watch-outs
- Watch-outs: flood insurance adds $66/mo.
- Climate carrying-cost: major flood risk; severe wind risk, 99% chance of damaging wind over 30y; extreme-heat days projected 7→20/yr by 2055 (HVAC capex compounding) — expect insurance premiums to compound above CPI over the hold.
Questions for the listing agent
- What's the actual annual flood-insurance premium (NFIP or private), and is the property in a SFHA with mandatory coverage?
- Is there a deadline driving the sale (1031 exchange, divorce, estate, relocation)? That informs how much negotiation room exists.
- Schools are F-rated, which usually means shorter tenancies and higher turnover. Who's the typical renter profile here, and what's been the actual vacancy rate?
- What's the average days-on-market for RENTAL listings here right now (not sales)? A rising rental-DOM trend means longer vacancies and softer asking-rent achievability than the comps imply.
- What's the recent tenant-quality profile in this submarket — average credit score on applications, eviction rate, late-payment / NSF rate, and stable-employment percentage? A property-management company in the area should have these aggregated.
- How much new for-sale + rental construction is in the pipeline within 1–3 miles? Heavy new supply typically softens prices + rents 12–24 months out; constrained supply supports both.
Investment metrics
- 1% rule
- 1.06% ✓
- Cap rate
- 9.08%
- Cash-on-cash
- 9.95%
- DSCR
- 1.44
- GRM
- 7.9
CMA / ARV
- ARV (median comp)
- $269,970
- List price
- $174,900
- Delta
- -35.21%
- Verdict
- UNDERPRICED
- Comps
- 20 within 1.0 mi
Show comp detail 12 sales within ~0.75 mi
| Address | Dist | Beds/Ba | Sqft | Sold | Price | $/sf | Match |
|---|---|---|---|---|---|---|---|
| 100 Harvest Sugar | 0.22mi | 3/2.0 | 1,765 (-8%) | 6mo | $240,000 | $136 | 72 |
| 105 Harvest Sugar Row | 0.23mi | 3/2.0 | 1,766 (-8%) | 11mo | $171,000 | $97 | 67 |
| 309 Gun Runner Dr | 0.51mi | 4/2.0 (+1) | 1,873 (-2%) | 4mo | $289,900 | $155 | 64 |
| 110 Gun Runner Dr | 0.50mi | 4/2.5 (+1) | 1,895 (-1%) | 8mo | $292,500 | $154 | 62 |
| 108 Gun Runner Dr | 0.50mi | 4/2.0 (+1) | 1,816 (-5%) | 8mo | $284,500 | $157 | 57 |
| 307 Gun Runner Dr | 0.53mi | 3/2.0 | 1,719 (-10%) | 6mo | $278,900 | $162 | 54 |
| 116 Blushing Groom Dr | 0.47mi | 4/2.0 (+1) | 1,816 (-5%) | 14mo | $289,000 | $159 | 54 |
| 319 Gun Runner Dr | 0.47mi | 3/2.5 | 1,818 (-5%) | 18mo | $284,500 | $156 | 53 |
| 207 Gun Runner Dr | 0.53mi | 4/2.0 (+1) | 1,684 (-12%) | 2mo | $274,000 | $163 | 49 |
| 311 Gun Runner Dr | 0.50mi | 3/2.0 | 1,639 (-14%) | 10mo | $272,600 | $166 | 45 |
| 100 Gun Runner Dr | 0.47mi | 4/2.0 (+1) | 1,682 (-12%) | 11mo | $274,000 | $163 | 44 |
| 313 Gun Runner Dr | 0.48mi | 4/2.0 (+1) | 1,684 (-12%) | 12mo | $265,000 | $157 | 43 |
Match score weights: distance 35% · size 25% · config 20% · recency 20%. Top-matched comps best support the ARV.
Projected returns pro-forma
-3.0% appreciation · 3.0% rent growth · sell at horizon
- IRR
- -3.7%
- Equity multiple
- 0.86×
- Total profit
- $-6,742
- Equity at exit
- $26,078
- IRR
- 6.0%
- Equity multiple
- 1.45×
- Total profit
- $21,877
- Equity at exit
- $15,122
Cash invested: $48,972 (down + closing). Projections, not guarantees.
Landlord ↔ Tenant lean methodology
- Overall (STATE)
- 90 Strongly Landlord-Friendly
- State Louisiana
- 90 Strongly Landlord-Friendly · R+12
- County
- — inherits STATE
- City
- — inherits STATE
ZIP-level market 70520
- Home prices YoY
- -17.6%
- Active inventory
- 281
- Price-to-rent
- 7.9×
Monthly cashflow live
- Estimated rent
- $1,855 high interval (Pro) →
- Mortgage (P&I)
- −$917
- Tax from tax record
- −$69 /mo · $830/yr
- Insurance
- −$73
- Flood insurance flood zone
- −$66 /mo · $798/yr
- HOA
- −$0
- Vacancy / Maint / Mgmt
- −$389
- Net cashflow
- $339
Break-even live
Sensitivity live
| Price | -10% $438 | -5% $389 | +0% $339 | +5% $290 | +10% $240 |
|---|---|---|---|---|---|
| Rent | -10% $193 | -5% $266 | +0% $339 | +5% $413 | +10% $486 |
| Rate | -1.0pp $428 | -0.5pp $384 | base $339 | +0.5pp $294 | +1.0pp $248 |
UW: 25.0% down · 7.5% · 30yr · 1.5% tax · 5.0% vac · 8.0% maint · 8.0% mgmt
Financing live
Cash to close
- Down payment
- $43,725
- Closing costs
- $5,247
- Reserves months
- —
- Total cash needed
- —
Loan-product check · same deal, 3 products live
Conventional
25% down · 7.5% · 30yr
- Down + closing
- —
- Monthly P&I
- —
- Monthly cashflow
- —
- DSCR
- —
- Eligible?
- —
Personal DTI + credit; lowest rate.
DSCR
20% down · 8.5% · 30yr
- Down + closing
- —
- Monthly P&I
- —
- Monthly cashflow
- —
- DSCR
- —
- Eligible?
- —
No personal income docs; deal must DSCR.
Hard money
10% down · 12.0% · 12mo
- Down + closing
- —
- Monthly P&I
- —
- Monthly cashflow
- —
- DSCR
- —
- Eligible?
- —
Short-term bridge; refi at stabilization.
Rent comps 12 comps
| Address | Beds | Baths | Sqft | Rent | $/sqft | DOM | Units | Dist |
|---|---|---|---|---|---|---|---|---|
| 2308 W Gloria Switch Rd Carencro, LA | 3.0 | 2.0 | 1567 | $1,600 | $1.02 | 45d | 1 | 0.48mi |
| 102 Yardley Ct Lafayette, LA | 3.0 | 2.0 | 1298 | $1,645 | $1.27 | 45d | 1 | 0.92mi |
| 108 Santiago Ct Lafayette, LA | 3.0 | 2.0 | 1613 | $1,890 | $1.17 | 22d | 1 | 0.98mi |
| 108 Santiago Ct Lafayette, LA | 3.0 | 2.0 | 1613 | $1,890 | $1.17 | 45d | 1 | 0.98mi |
| 116 Yardley Ct Lafayette, LA | 3.0 | 2.0 | 1613 | $1,890 | $1.17 | 45d | 1 | 0.98mi |
| 109 Santiago Ct Lafayette, LA | 4.0 | 2.0 | 1786 | $1,965 | $1.10 | 15d | 1 | 0.99mi |
| 121 Yardley Ct Lafayette, LA | 4.0 | 2.0 | 1786 | $1,965 | $1.10 | 15d | 1 | 1.01mi |
| 124 Yardley Ct Lafayette, LA | 4.0 | 2.0 | 1786 | $1,945 | $1.09 | 22d | 1 | 1.02mi |
| 122 SANTIAGO Ct Lafayette, LA | 3.0 | 2.0 | 1613 | $1,890 | $1.17 | 22d | 1 | 1.04mi |
| 117 ORTHELLO Ct Lafayette, LA | 3.0 | 2.0 | 1613 | $1,890 | $1.17 | 45d | 1 | 1.06mi |
| 117 ORTHELLO Ct Lafayette, LA | 3.0 | 2.0 | 1613 | $1,890 | $1.17 | 22d | 1 | 1.06mi |
| 417 Mango Dr Lafayette, LA | 3.0 | 2.0 | 1613 | $2,015 | $1.25 | 15d | 1 | 1.11mi |
Listing history 6 events
-
2026-05-16status Pending 518-char remark
-
2026-05-12price $174,900 518-char remark
-
2026-04-29$179,900 Active 518-char remark
-
2020-12-17soldstatus $156,750
-
2020-12-04soldstatus $156,750 388-char remark
Show marketing remark (388 chars)
Country living at its best! This 2,200sf, 2 story, 3 bed 2 bath spacious home sits on just under half an acre. You are minutes away from local Carencro shopping. This home has beautiful landscaping and a great size yard with a fantastic living room that is ready for a growing family! This home has never flooded.The boat cover and storage building closest to the boat cover are reserved.
-
2020-04-07$172,500 388-char remark
Show marketing remark (388 chars)
Country living at its best! This 2,200sf, 2 story, 3 bed 2 bath spacious home sits on just under half an acre. You are minutes away from local Carencro shopping. This home has beautiful landscaping and a great size yard with a fantastic living room that is ready for a growing family! This home has never flooded.The boat cover and storage building closest to the boat cover are reserved.
ⓘ Source: listings_history table (triggers on properties + properties_extension) + one-shot
backfill from property_details.listing_events for pre-trigger history.
Tax reassessment forecast LA · Resets to sale price
- Current annual tax
- $830 · $69/mo
- Projected year-2 tax
- $962 · $80/mo
- Expected delta
- +$132/yr (+$11/mo · 15.9%)
ⓘ Screening estimate from a state-policy table — verify with the county assessor before closing.
Climate risk First Street
- Flood 7/10 Severe FEMA zone X (unshaded) · 99% chance over 30 yrs
- Wildfire 3/10 Moderate
- Heat 8/10 Severe 7 d/yr ≥109°F today · 20 d/yr by 30 yrs out
- Wind 9/10 Extreme 99% chance of damaging wind over 30 yrs
- Air quality 2/10 Low 1 unhealthy d/yr today · 1 by 30 yrs out
Nearby sold comps map
Loading sold comps map…
Walkable amenities ~0.75 mi
Loading nearby amenities…
Taxation est. · year 1
- Rental income
- $22,256
- − Mortgage interest
- −$9,797
- − Property taxes
- −$830
- − Insurance
- −$1,672
- − Repairs & maintenance
- −$1,780
- − Management
- −$1,780
- − Depreciation
- −$5,088
- Taxable income
- $1,308
- Est. tax owed @ 24.0%
- −$314
- After-tax cash flow
- $3,760/yr
For passive investors: Depreciation is non-cash, so a rental often shows a tax loss while cash-flowing — sheltering income. Rental losses are passive: they offset passive income freely, and up to $25,000/yr can offset ordinary (W-2) income if you actively participate and your MAGI is under $100k (phasing out to $0 by $150k); unused losses carry forward. On sale, claimed depreciation is recaptured at up to 25%, and gains may owe capital-gains tax (a 1031 exchange can defer both). Figures are a year-1 estimate at your 24.0% rate — not tax advice; consult a CPA.
Schools (NCES district)
- District
- Lafayette Parish
- NCES district ID
- 2200870
- Math proficiency
- 38% ▼ -32.00%
- Reading proficiency
- 46% ▼ -24.00%
- Median HH income
- $50,238
- Composite
- 36.15/100
- National rank
- #4741
- State rank
- #19 of 98 in LA
Livability — Ossun
- Score
- 59/100
- State rank
- #274
- US rank
- #19977
Category grades
Schools grade is shown separately in the Schools card above.
Census & demographics
- City population
- 20,134
- Population (ZIP)
- 20,134
Population outlook (Lafayette County) Hauer SSP2
- Today (2025)
- 280,930 people
- By 2030
- 301,092 · +7.2%
- By 2040
- 339,456 · +20.8%
- By 2050
- 375,156 · +33.5%
- By 2075
- 451,672 · +60.8%
- By 2100
- 497,203 · +77.0%
Race, ethnicity, and origin ACS 2023
- Neighborhood character
- Diverse neighborhood (Simpson 0.56)
- Race & ethnicity
- White 58% Black 32% Two or more races 5% Hispanic / Latino 3% Asian 2%
- Common ancestry
- Lithuanian 13% Scotch-Irish 2% Italian 1%
- Foreign-born
- 2% · Canada
- Languages at home
- 92% English-only · French/Haitian/Cajun 5% Spanish 1% Other Indo-European 1%
Political lean MEDSL · Lafayette
- 2024 margin
- Solid R (+31.4) · D 33.5% · R 64.8% · Other 1.7%
- 2008→2024 swing
- -0.1pp no change · 2008: -31.3pp · 2024: -31.4pp
- All cycles
- 2024: R+31.4 2020: R+28.7 2016: R+33.6 2012: R+33.7 2008: R+31.3
Not yet ingested
- Civics
- —
Market trends
- HPI YoY
- ▼ -33.62%
- Current HPI
- 157.0194
- Rent YoY
- —
- Metro
- —
- State GDP YoY
- ▲ 3.29%
- F500 in state
- 10
Industry mix (Fortune 500 HQ in LA)
| Industry | F500 HQs | Revenue |
|---|---|---|
| Telecommunications | 2 | $23B |
|
||
| Utilities | 1 | $12B |
|
||
| Wholesale / Distribution | 1 | $5B |
|
||
| Advertising | 1 | $2B |
|
||
Price history
+1.4% since first listed6 events — show timeline
- 2026-05-16 Pending — AcadianaMLS
- 2026-05-12 Price Changed $174,900 AcadianaMLS
- 2026-04-29 Listed $179,900 AcadianaMLS
- 2020-12-17 Sold (Public Records) $156,750 Public Records
- 2020-12-04 Sold (MLS) $156,750 AcadianaMLS
- 2020-04-07 Listed $172,500 AcadianaMLS
Property tax history
+22.3%/yrLatest (2025): $830 · -1.3% YoY. Source: county tax records.
Cash-flow waterfall
monthlySold comps — $/sqft
last 12 mo · ≤1 miLoading sold comps…