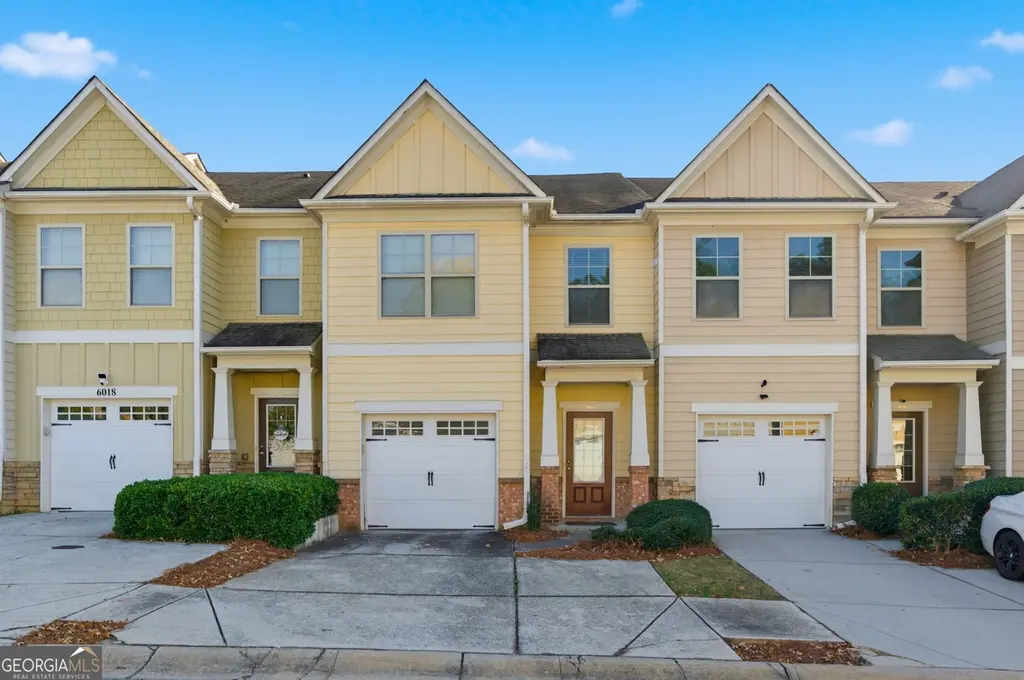
6022 Centennial Run · South Fulton, GA
Flood risk 1/10 · Minimal
- FEMA flood zone
- X (unshaded)
- Chance of flooding over 30 yrs
- 0.0%
- Est. flood insurance / yr
- $507 – $1,088
Fire risk 3/10 · Minor
- Est. fire insurance / yr
- $963 – $1,789
Heat risk 6/10 · Moderate
- Hot days now (above 104°F)
- 7 days/yr
- Hot days in 30 yrs
- 18 days/yr
Wind risk 5/10 · Moderate
- Chance of severe wind over 30 yrs
- 26.0%
Air-quality risk 4/10 · Minor
- Unhealthy air days now
- 4 days/yr
- Unhealthy air days in 30 yrs
- 6 days/yr
Risk factors via First Street. Map © Google.
Why this score? — see what drove the D grade
The composite is a weighted blend of 9 inputs, each scored 0–100. Each bar is that input's sub-score; the figure is the points it added to the 100-point composite (weight × sub-score).
- Appreciation +10.0/10.0
- Cash flow +9.1/30.0
- ARV discount +6.6/15.0
- Schools +4.5/10.0
- Rent growth +2.7/5.0
- 1% rule +2.6/10.0
- DSCR +2.5/10.0
- Livability +2.5/5.0
- Condition / age +2.5/5.0
$250,000
🖨 Deal sheet (PDF) 📄 Offer letter ✓ Due diligence
Listing remarks MLS
Look no further! The perfect home for a first time home buyer or anyone looking to have fast access to Atlanta's airport! This home is nestled in a gated community with a newly renovated kitchen and a spacious owners suite.
Key facts
- Gated community
- Garage
- Built 2006
Tags
Neighborhood map
What this means for you Summary
Snapshot
- This is a 3-bed/2.5-bath townhouse listed at $250k.
Deal economics
- At list price, monthly cash flow is $-191 ($-2k/yr) — negative.
- To cash-flow at today's rent, offer at most $216k (13.5% below list).
- To meet the 1% rule (rent ≥ 1% of price), the offer needs to be $191k (23.7% below list).
- Recommended offer: $191k (23.7% below list) — sets the bar for 1% rule.
Location & tenants
- Location reads: area grade D — affects rentability + tenant quality, not the cash-flow math above.
- Fulton County (suburban): math 49% / reading 53% proficiency, ranked #12 of 174 in GA (top 7%) — acceptable for families but not a draw, mixed tenant base, ~2y average lease.
- Market conditions: Rents flat; 656 active listings in the ZIP; 40 comparable units currently listed for rent nearby; rentals at typical pace (median 25d on market — plan ~3-4 weeks tenant-placement turnaround); 40% of comp listings sitting > 30 days — soft ceiling on asking rent; 11,565 units permitted in Fulton County in 2024 (8,159 in 5+ unit buildings).
- This rent runs 34% of the median local income ($67k/yr) — at the standard rent-burdened threshold; future hikes will face affordability resistance.
Forward outlook
- In year one you build about $27k of equity ($2k loan paydown + $25k appreciation (10.0% local appreciation)).
- Fulton County population projected at +38% by 2050 — long-run rental-demand tailwind backs the buy-and-hold thesis.
- By year 2, paydown + projected appreciation supports a ~$43k cash-out refi (75% LTV) — recoverable capital for the next deal without selling this one.
Negotiation context
- It's been on market 241 days — a 12% lower offer ($220k) is reasonable based on typical stale-listing flexibility.
- 9 sale attempts since 14y ago with the ask held roughly flat each time — persistent listings suggest the price (not the market) is what's stuck; bring a comps-based counter.
- Current owner paid $210k; 19% above their basis — modest negotiation headroom, anchor on the comps not their cost.
Risks & watch-outs
- Climate carrying-cost: moderate wind risk, 26% chance of damaging wind over 30y; extreme-heat days projected 7→18/yr by 2055 (HVAC capex compounding) — expect insurance premiums to compound above CPI over the hold.
Questions for the listing agent
- What do current leases actually rent for vs. the listed asking? Can we see a recent rent roll and the last 12 months of T-12 income?
- It's been on market 241 days. Have you received any prior offers? Is the seller open to a 24% concession, seller financing, or rate buy-down credit?
- Why hasn't it sold? Are there any deal-killer items the seller is aware of (foundation, flood, title, zoning, code violations)?
- Is there a deadline driving the sale (1031 exchange, divorce, estate, relocation)? That informs how much negotiation room exists.
- The area grade is low — what's the realistic commute time and amenity access for the typical tenant pool here? Any planned neighborhood developments (good or bad) we should know about?
- What's the average days-on-market for RENTAL listings here right now (not sales)? A rising rental-DOM trend means longer vacancies and softer asking-rent achievability than the comps imply.
- What's the recent tenant-quality profile in this submarket — average credit score on applications, eviction rate, late-payment / NSF rate, and stable-employment percentage? A property-management company in the area should have these aggregated.
- How much new for-sale + rental construction is in the pipeline within 1–3 miles? Heavy new supply typically softens prices + rents 12–24 months out; constrained supply supports both.
Investment metrics
- 1% rule
- 0.76% ✗
- Cap rate
- 5.37%
- Cash-on-cash
- -3.28%
- DSCR
- 0.85
- GRM
- 10.9
CMA / ARV
- ARV (median comp)
- $245,207
- List price
- $250,000
- Delta
- 1.95%
- Verdict
- FAIR
- Comps
- 20 within 1.0 mi
Show comp detail 12 sales within ~0.75 mi
| Address | Dist | Beds/Ba | Sqft | Sold | Price | $/sf | Match |
|---|---|---|---|---|---|---|---|
| 6159 Centennial Run | 0.15mi | 3/2.5 | 1,810 (+6%) | 1mo | $269,900 | $149 | 83 |
| 6087 Centennial Run | 0.05mi | 3/2.5 | 1,736 (+1%) | 21mo | $230,000 | $132 | 78 |
| 6179 Centennial Run | 0.17mi | 3/2.5 | 1,810 (+6%) | 13mo | $255,000 | $141 | 72 |
| 2555 Flat Shoals Rd #1607 | 0.11mi | 2/2.5 (-1) | 1,823 (+6%) | 23mo | $229,900 | $126 | 60 |
| 2555 Flat Shoals Rd #2403 | 0.23mi | 3/2.5 | 1,590 (-7%) | 23mo | $240,000 | $151 | 58 |
| 2555 Flat Shoals Rd #3105 | 0.17mi | 3/2.5 | 1,550 (-10%) | 23mo | $250,000 | $161 | 57 |
| 3473 Shoal Oak Ct | 0.48mi | 3/2.5 | 1,507 (-12%) | 11mo | $257,000 | $171 | 48 |
| 6001 Oak Bend Ct | 0.40mi | 3/2.5 | 1,456 (-15%) | 11mo | $240,000 | $165 | 47 |
| 6021 Oak Bend Ct | 0.40mi | 3/2.5 | 1,539 (-10%) | 22mo | $261,000 | $170 | 46 |
| 6000 Oak Bend Ct | 0.43mi | 3/2.5 | 1,504 (-12%) | 22mo | $260,000 | $173 | 41 |
| 2183 Olmadison Vw | 0.73mi | 3/2.5 | 1,776 (+4%) | 23mo | $230,000 | $130 | 41 |
| 6106 Oak Bend Ct | 0.51mi | 3/2.5 | 1,513 (-12%) | 22mo | $265,000 | $175 | 39 |
Match score weights: distance 35% · size 25% · config 20% · recency 20%. Top-matched comps best support the ARV.
Projected returns pro-forma
10.0% appreciation · 0.95% rent growth · sell at horizon
- IRR
- 21.3%
- Equity multiple
- 2.72×
- Total profit
- $120,121
- Equity at exit
- $225,220
- IRR
- 18.9%
- Equity multiple
- 6.09×
- Total profit
- $356,155
- Equity at exit
- $485,695
Cash invested: $70,000 (down + closing). Projections, not guarantees.
Landlord ↔ Tenant lean methodology
- Overall (STATE)
- 90 Strongly Landlord-Friendly
- State Georgia
- 90 Strongly Landlord-Friendly · R+3
- County
- — inherits STATE
- City
- — inherits STATE
ZIP-level market 30349
- Home prices YoY
- 4.6%
- Rents YoY
- 0.9%
- Active inventory
- 656
- Price-to-rent
- 10.9×
Monthly cashflow live
- Estimated rent
- $1,908 high interval (Pro) →
- Mortgage (P&I)
- −$1,311
- Tax from tax record
- −$284 /mo · $3,405/yr
- Insurance
- −$104
- HOA
- −$0
- Vacancy / Maint / Mgmt
- −$401
- Net cashflow
- $-191
Break-even live
Sensitivity live
| Price | -10% $-50 | -5% $-121 | +0% $-191 | +5% $-262 | +10% $-333 |
|---|---|---|---|---|---|
| Rent | -10% $-342 | -5% $-267 | +0% $-191 | +5% $-116 | +10% $-41 |
| Rate | -1.0pp $-65 | -0.5pp $-128 | base $-191 | +0.5pp $-256 | +1.0pp $-322 |
UW: 25.0% down · 7.5% · 30yr · 1.5% tax · 5.0% vac · 8.0% maint · 8.0% mgmt
Financing live
Cash to close
- Down payment
- $62,500
- Closing costs
- $7,500
- Reserves months
- —
- Total cash needed
- —
Loan-product check · same deal, 3 products live
Conventional
25% down · 7.5% · 30yr
- Down + closing
- —
- Monthly P&I
- —
- Monthly cashflow
- —
- DSCR
- —
- Eligible?
- —
Personal DTI + credit; lowest rate.
DSCR
20% down · 8.5% · 30yr
- Down + closing
- —
- Monthly P&I
- —
- Monthly cashflow
- —
- DSCR
- —
- Eligible?
- —
No personal income docs; deal must DSCR.
Hard money
10% down · 12.0% · 12mo
- Down + closing
- —
- Monthly P&I
- —
- Monthly cashflow
- —
- DSCR
- —
- Eligible?
- —
Short-term bridge; refi at stabilization.
Rent comps 40 comps
| Address | Beds | Baths | Sqft | Rent | $/sqft | DOM | Units | Dist |
|---|---|---|---|---|---|---|---|---|
| 2555 Flat Shoals Rd #404 College Park, GA | 3.0 | 2.5 | 1408 | $1,700 | $1.21 | 25d | 1 | 0.14mi |
| 2555 Flat Shoals Rd #401 Atlanta, GA | 3.0 | 2.5 | 1550 | $2,050 | $1.32 | 44d | 1 | 0.15mi |
| 2555 Flat Shoals Rd #3005 Atlanta, GA | 3.0 | 2.5 | 1724 | $1,850 | $1.07 | 6d | 1 | 0.18mi |
| 320 Emerald Green Ct Atlanta, GA | 3.0 | 2.0 | 1575 | $2,050 | $1.30 | 44d | 1 | 0.22mi |
| 6090 Emerald Pointe Cir Atlanta, GA | 3.0 | 2.0 | 1200 | $1,875 | $1.56 | 19d | 1 | 0.23mi |
| 6056 Carriage Ct Atlanta, GA | 3.0 | 2.0 | 1400 | $1,599 | $1.14 | 6d | 1 | 0.25mi |
| 6120 Hemperly Rd Atlanta, GA | 4.0 | 2.5 | 1770 | $2,100 | $1.19 | 25d | 1 | 0.30mi |
| 6120 Hemperly Rd Atlanta, GA | 4.0 | 2.5 | 1770 | $2,100 | $1.19 | 4d | 1 | 0.30mi |
| 6560 Emerald Pointe Cir Atlanta, GA | 3.0 | 2.0 | 1309 | $1,500 | $1.15 | 23d | 1 | 0.40mi |
| 6278 Rockaway Rd Atlanta, GA | 3.0 | 2.5 | 1524 | $2,000 | $1.31 | 44d | 1 | 0.41mi |
| 6027 Oak Bend Ct Riverdale, GA | 3.0 | 2.5 | 1530 | $2,070 | $1.35 | 6d | 1 | 0.43mi |
| 855 Old Rocky Rd Atlanta, GA | 3.0 | 2.0 | 1310 | $1,710 | $1.31 | 25d | 1 | 0.46mi |
| 6048 Oak Bend Ct Riverdale, GA | 3.0 | 2.5 | 1500 | $1,750 | $1.17 | 23d | 1 | 0.47mi |
| 6078 Oak Bend Ct Riverdale, GA | 3.0 | 2.5 | 1622 | $1,800 | $1.11 | 25d | 1 | 0.50mi |
| 2592 Rocky Ct Atlanta, GA | 2.0 | 2.5 | 1424 | $2,000 | $1.40 | 44d | 1 | 0.53mi |
| 2865 Spruce Point Rd Atlanta, GA | 4.0 | 2.0 | 1050 | $1,910 | $1.82 | 44d | 1 | 0.55mi |
| 2667 Rocky Ct Atlanta, GA | 3.0 | 2.5 | 1432 | $2,200 | $1.54 | 44d | 1 | 0.55mi |
| 2250 Sandgate Cir Atlanta, GA | 4.0 | 3.0 | 1916 | $2,100 | $1.10 | 16d | 1 | 0.67mi |
| 5690 Hampton Ct Atlanta, GA | 2.0 | 3.0 | 1184 | $1,495 | $1.26 | 44d | 1 | 0.68mi |
| 3105 Garnet Way Atlanta, GA | 3.0 | 2.0 | 1470 | $1,660 | $1.13 | 13d | 1 | 0.69mi |
| 6368 Olmadison Pl Atlanta, GA | 3.0 | 2.5 | 1428 | $1,656 | $1.16 | 12d | 1 | 0.74mi |
| 6370 Olmadison Pl Atlanta, GA | 3.0 | 2.5 | 1440 | $1,795 | $1.25 | 44d | 1 | 0.74mi |
| 6230 Cedar Wood Dr Atlanta, GA | 3.0 | 2.0 | 1238 | $1,694 | $1.37 | 44d | 1 | 0.75mi |
| 5460 Hampton Ct Atlanta, GA | 2.0 | 3.5 | 1554 | $1,500 | $0.97 | 44d | 1 | 0.77mi |
| 2184 Olmadison Vw Atlanta, GA | 2.0 | 2.0 | 1236 | $1,985 | $1.61 | 19d | 1 | 0.79mi |
| 6345 Peppermill Ln Atlanta, GA | 3.0 | 2.5 | 1224 | $1,800 | $1.47 | 44d | 1 | 0.83mi |
| 2500 Pleasant Hill Rd Atlanta, GA | 2.0–3.0 | 1.5–2.5 | 1405 | $1,449 | $1.03 | 25d | 2 | 0.87mi |
| 2285 Bigwood Trl Atlanta, GA | 3.0 | 2.5 | 1580 | $1,740 | $1.10 | 2d | 1 | 0.88mi |
| 2373 Bigwood Trl Atlanta, GA | 3.0 | 2.5 | 1566 | $1,845 | $1.18 | 25d | 1 | 0.89mi |
| 2310 Bigwood Trl Atlanta, GA | 3.0 | 2.5 | 1580 | $2,600 | $1.65 | 25d | 1 | 0.89mi |
| 6450 Peppermill Ln Atlanta, GA | 4.0 | 2.0 | 1188 | $1,531 | $1.29 | 25d | 1 | 0.90mi |
| 6165 Radford Dr Riverdale, GA | 3.0 | 2.0 | 1232 | $1,750 | $1.42 | 23d | 1 | 0.93mi |
| 6165 Radford Dr Riverdale, GA | 3.0 | 2.0 | 1232 | $1,695 | $1.38 | 6d | 1 | 0.93mi |
| 6165 Radford Dr Riverdale, GA | 3.0 | 2.0 | 1232 | $1,799 | $1.46 | 44d | 1 | 0.93mi |
| 6165 Radford Dr Riverdale, GA | 3.0 | 2.0 | 1232 | $1,799 | $1.46 | 25d | 1 | 0.93mi |
| 336 Rocky Springs Ct Atlanta, GA | 4.0 | 2.0 | 1900 | $1,450 | $0.76 | 25d | 1 | 0.97mi |
| 5866 Summerglen Ln Atlanta, GA | 3.0 | 2.0 | 1400 | $1,450 | $1.04 | 44d | 1 | 1.06mi |
| 5410 Twin Lakes Dr Atlanta, GA | 3.0 | 2.0 | 1277 | $2,040 | $1.60 | 44d | 1 | 1.07mi |
| 5335 Willow Park Blvd Atlanta, GA | 4.0 | 2.5 | 1716 | $2,000 | $1.17 | 44d | 1 | 1.07mi |
| 2014 Radford Ct Riverdale, GA | 3.0 | 1.5 | 1190 | $1,665 | $1.40 | 44d | 1 | 1.08mi |
Listing history 41 events
-
2026-06-21days on market $250,000 Active 241 DOM
-
2026-06-18days on market $250,000 Active 238 DOM
-
2026-06-17days on market $250,000 Active 237 DOM
-
2026-06-16days on market $250,000 Active 236 DOM
-
2026-06-15days on market $250,000 Active 235 DOM
-
2026-06-13days on market $250,000 Active 233 DOM
-
2026-06-09days on market $250,000 Active 229 DOM
-
2026-06-08days on market $250,000 Active 228 DOM
-
2026-06-07days on market $250,000 Active 227 DOM
-
2026-06-04days on market $250,000 Active 224 DOM
-
2026-06-03days on market $250,000 Active 223 DOM
-
2026-06-01days on market $250,000 Active 221 DOM
-
2026-05-31days on market $250,000 Active 220 DOM
-
2026-04-06status Back On Market 223-char remark
Show marketing remark (223 chars)
Look no further! The perfect home for a first time home buyer or anyone looking to have fast access to Atlanta's airport! This home is nestled in a gated community with a newly renovated kitchen and a spacious owners suite.
-
2026-04-01historical 223-char remark
Show marketing remark (223 chars)
Look no further! The perfect home for a first time home buyer or anyone looking to have fast access to Atlanta's airport! This home is nestled in a gated community with a newly renovated kitchen and a spacious owners suite.
-
2026-02-01status Back On Market 223-char remark
Show marketing remark (223 chars)
Look no further! The perfect home for a first time home buyer or anyone looking to have fast access to Atlanta's airport! This home is nestled in a gated community with a newly renovated kitchen and a spacious owners suite.
-
2026-01-31historical 223-char remark
Show marketing remark (223 chars)
Look no further! The perfect home for a first time home buyer or anyone looking to have fast access to Atlanta's airport! This home is nestled in a gated community with a newly renovated kitchen and a spacious owners suite.
-
2025-10-17$250,000 New 223-char remark
Show marketing remark (223 chars)
Look no further! The perfect home for a first time home buyer or anyone looking to have fast access to Atlanta's airport! This home is nestled in a gated community with a newly renovated kitchen and a spacious owners suite.
-
2025-08-01historical
-
2025-04-01status Price Change
-
2025-04-01price $254,662
-
2025-03-31historical
-
2025-03-04price $259,662
-
2025-01-01$264,662 New
-
2022-04-04soldstatus $210,000
-
2022-04-01soldstatus $210,000 Closed
-
2022-04-01soldstatus $210,000 Sold
-
2022-03-07status Pending
-
2022-03-07status Under Contract
-
2022-03-03$205,000 Active
-
2022-03-03$205,000 New
-
2017-02-09price $42,500
-
2012-12-10soldstatus $45,000
-
2012-11-09historical
-
2012-11-09price $45,000
-
2012-11-05soldstatus $45,000 Sold
-
2012-10-15price $42,500
-
2012-08-30price $49,900
-
2012-08-29status Back On Market
-
2012-05-17historical
-
2012-03-26$57,500 New
ⓘ Source: listings_history table (triggers on properties + properties_extension) + one-shot
backfill from property_details.listing_events for pre-trigger history.
Tax reassessment forecast GA · Resets to sale price
- Current annual tax
- $3,405 · $284/mo
- Projected year-2 tax
- $3,405 · $284/mo
- Expected delta
- $0/yr ($0/mo · 0.0%)
ⓘ Screening estimate from a state-policy table — verify with the county assessor before closing.
Climate risk First Street
- Flood 1/10 Low FEMA zone X (unshaded) · 0% chance over 30 yrs
- Wildfire 3/10 Moderate
- Heat 6/10 Major 7 d/yr ≥104°F today · 18 d/yr by 30 yrs out
- Wind 5/10 Major 26% chance of damaging wind over 30 yrs
- Air quality 4/10 Moderate 4 unhealthy d/yr today · 6 by 30 yrs out
Nearby sold comps map
Loading sold comps map…
Walkable amenities ~0.75 mi
Loading nearby amenities…
Taxation est. · year 1
- Rental income
- $22,900
- − Mortgage interest
- −$14,004
- − Property taxes
- −$3,405
- − Insurance
- −$1,250
- − Repairs & maintenance
- −$1,832
- − Management
- −$1,832
- − Depreciation
- −$7,273
- Taxable loss
- −$6,696
- Est. tax savings @ 24.0%
- +$1,607
- After-tax cash flow
- $-690/yr
For passive investors: Depreciation is non-cash, so a rental often shows a tax loss while cash-flowing — sheltering income. Rental losses are passive: they offset passive income freely, and up to $25,000/yr can offset ordinary (W-2) income if you actively participate and your MAGI is under $100k (phasing out to $0 by $150k); unused losses carry forward. On sale, claimed depreciation is recaptured at up to 25%, and gains may owe capital-gains tax (a 1031 exchange can defer both). Figures are a year-1 estimate at your 24.0% rate — not tax advice; consult a CPA.
Schools (NCES district)
- District
- Fulton County
- NCES district ID
- 1302280
- Math proficiency
- 49% ▼ -2.00%
- Reading proficiency
- 53% ▬ 0.00%
- Median HH income
- $68,035
- Composite
- 45.33/100
- National rank
- #2640
- State rank
- #12 of 174 in GA
Livability — South Fulton
No livability data for this city. (Only ~50 U.S. cities are tracked.)
Census & demographics
- Census place
- South Fulton, GA
- County
- Fulton County · 1,094,430 people
- City population
- 127,674
- Metro
- Atlanta-Sandy Springs-Alpharetta, GA
- Population (ZIP)
- 79,872
- Household income
- $67,023
- Rent vs Own
- Severe rent burden
- 4258.0
Population outlook (Fulton County) Hauer SSP2
- Today (2025)
- 1,203,707 people
- By 2030
- 1,299,706 · +8.0%
- By 2040
- 1,488,256 · +23.6%
- By 2050
- 1,664,580 · +38.3%
- By 2075
- 2,036,072 · +69.2%
- By 2100
- 2,222,402 · +84.6%
Race, ethnicity, and origin ACS 2023
- Neighborhood character
- Predominantly Black (89%)
- Race & ethnicity
- Black 89% Hispanic / Latino 5% Two or more races 4% White 3%
- Foreign-born
- 9% · Canada
- Languages at home
- 88% English-only · Spanish 6% French/Haitian/Cajun 1%
Political lean MEDSL · Fulton
- 2024 margin
- Solid D (+44.9) · D 71.9% · R 27.0% · Other 1.1%
- 2008→2024 swing
- +9.8pp toward D · 2008: 35.0pp · 2024: 44.9pp
- All cycles
- 2024: D+44.9 2020: D+46.4 2016: D+42.1 2012: D+29.6 2008: D+35.0
Not yet ingested
- Civics
- —
Market trends
- HPI YoY
- ▲ 18.01%
- Current HPI
- 407.99
- Rent YoY
- ▲ 0.95%
- Metro
- Atlanta-Sandy Springs-Alpharetta, GA
- State GDP YoY
- ▲ 2.66%
- F500 in state
- 28
Industry mix (Fortune 500 HQ in GA)
| Industry | F500 HQs | Revenue |
|---|---|---|
| Paper / Packaging | 2 | $29B |
|
||
| Retail | 1 | $160B |
|
||
| Transportation / Logistics | 1 | $91B |
|
||
| Airlines | 1 | $62B |
|
||
| Consumer Goods | 1 | $47B |
|
||
| Utilities | 1 | $25B |
|
||
Price history
+334.8% since first listed28 events — show timeline
- 2026-04-06 Relisted — GAMLS
- 2026-04-01 Listing Removed — GAMLS
- 2026-02-01 Relisted — GAMLS
- 2026-01-31 Listing Removed — GAMLS
- 2025-10-17 Listed $250,000 GAMLS
- 2025-08-01 Listing Removed — GAMLS
- 2025-04-01 Relisted — GAMLS
- 2025-04-01 Price Changed $254,662 GAMLS
- 2025-03-31 Listing Removed — GAMLS
- 2025-03-04 Price Changed $259,662 GAMLS
- 2025-01-01 Listed $264,662 GAMLS
- 2022-04-04 Sold (Public Records) $210,000 Public Records
- 2022-04-01 Sold (MLS) $210,000 GAMLS
- 2022-04-01 Sold (MLS) $210,000 FMLS
- 2022-03-07 Pending — FMLS
- 2022-03-07 Pending — GAMLS
- 2022-03-03 Listed $205,000 GAMLS
- 2022-03-03 Listed $205,000 FMLS
- 2017-02-09 Price Changed $42,500 GAMLS
- 2012-12-10 Sold (Public Records) $45,000 Public Records
- 2012-11-09 Listing Removed — GAMLS
- 2012-11-09 Price Changed $45,000 GAMLS
- 2012-11-05 Sold (MLS) $45,000 GAMLS
- 2012-10-15 Price Changed $42,500 GAMLS
- 2012-08-30 Price Changed $49,900 GAMLS
- 2012-08-29 Relisted — GAMLS
- 2012-05-17 Listing Removed — GAMLS
- 2012-03-26 Listed $57,500 GAMLS
Property tax history
+3.9%/yrLatest (2025): $3,405 · -13.3% YoY. Source: county tax records.
Cash-flow waterfall
monthlySold comps — $/sqft
last 12 mo · ≤1 miLoading sold comps…