 Triplex
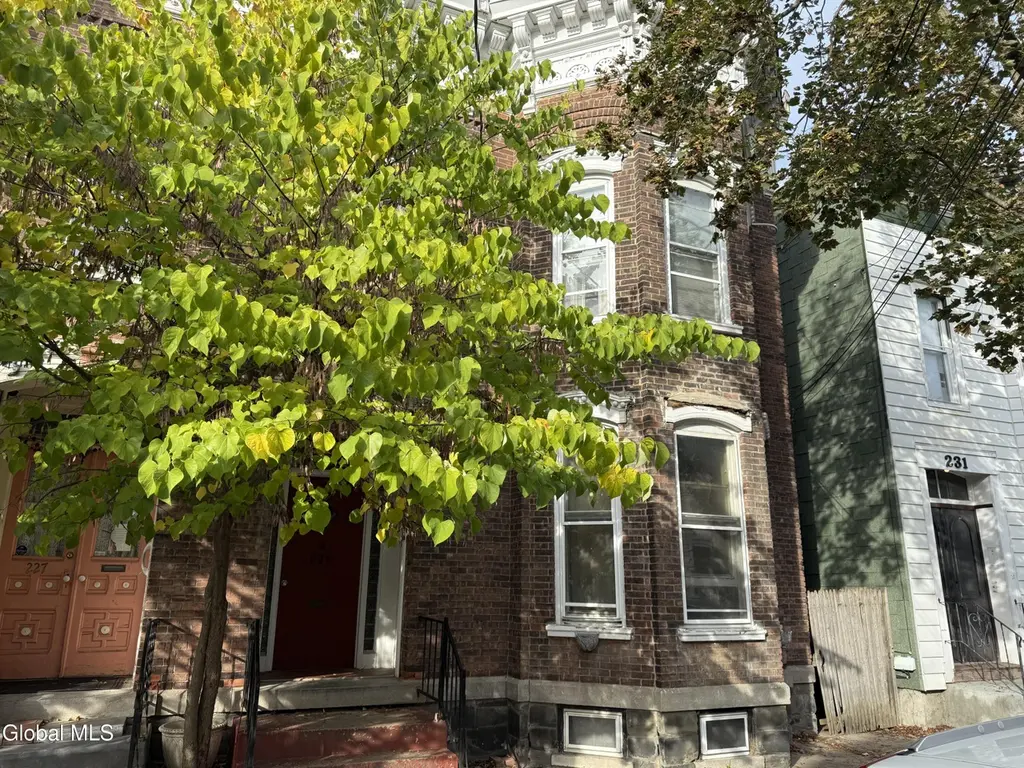
229 Green St · Schenectady, NY
Flood risk 4/10 · Minor
- FEMA flood zone
- X (unshaded)
- Chance of flooding over 30 yrs
- 0.23%
- Est. flood insurance / yr
- $473 – $860
Fire risk 1/10 · Minimal
- Est. fire insurance / yr
- $691 – $1,283
Heat risk 4/10 · Minor
- Hot days now (above 96°F)
- 7 days/yr
- Hot days in 30 yrs
- 16 days/yr
Wind risk 2/10 · Minimal
- Chance of severe wind over 30 yrs
- 4.0%
Air-quality risk 1/10 · Minimal
- Unhealthy air days now
- 0 days/yr
- Unhealthy air days in 30 yrs
- 0 days/yr
Risk factors via First Street. Map © Google.
Why this score? — see what drove the A- grade
The composite is a weighted blend of 9 inputs, each scored 0–100. Each bar is that input's sub-score; the figure is the points it added to the 100-point composite (weight × sub-score).
- Cash flow +30.0/30.0
- ARV discount +15.0/15.0
- 1% rule +10.0/10.0
- DSCR +10.0/10.0
- Appreciation +6.6/10.0
- Livability +3.9/5.0
- Schools +3.0/10.0
- Rent growth +2.5/5.0
- Condition / age +2.5/5.0
$284,900
🖨 Deal sheet (PDF) 📄 Offer letter ✓ Due diligence
Multi-family units
County records classify this as Multi-Family (2-4 Unit). Listing-text estimate: 3 units. confirmed
Listing remarks MLS
Nestled in the heart of Schenectady's sought-after Stockade neighborhood, this traditional brick triplex offers a rare investment opportunity in one of the city's most picturesque and historic areas. Fully rented with long-term tenants in place, this property provides immediate cash flow and solid rental history. The layout features two units on the first floor and a third unit on the second floor. Classic brick construction, walkable surroundings, and close proximity to downtown, restaurants, and Rivers Casino make this a high-demand location for tenants.
Key facts
- Long-term tenants
- Fully rented
- 3,920 sq ft lot
Tags
Neighborhood map
What this means for you Summary
Snapshot
- This is a 3 × 4-bed/3.0-bath units multifamily listed at $285k.
Deal economics
- At list price, monthly cash flow is $2k ($30k/yr) — positive. Per door: $822/mo.
- The deal already cash-flows at list — no discount required.
- Meets the 1% rule at list price ($6k rent vs $285k).
- Recommended offer: $268k (6.0% below list) — sets the bar for market timing.
Location & tenants
- Location reads 78/100 on livability (#167 in NY, #2,597 nationally) — a middle-class / working-renter tenant base. Strengths: commute A+, health & safety A+, cost of living A; Watch: employment D+, crime F.
- Schenectady City School District (urban): math 38% / reading 34% proficiency, ranked #556 of 590 in NY (top 94%) — families likely to look elsewhere, expect single-tenant / working-renter base with shorter leases; 65% free/reduced lunch — lower-income household profile, screen leases tightly.
- Zoned schools: Howe Elementary School (math 44% / reading 54%, grade D, #1,085 of 2,108 statewide, top 56%, 363 students, 69% FRL); Mont Pleasant Middle School (math 2% / reading 27%, grade F, #704 of 729 statewide, top 98%, 671 students, 81% FRL); Schenectady High School (math 75% / reading 90%, grade A, #446 of 1,100 statewide, top 41%, 2,743 students, 71% FRL).
- Zoned-school proficiency averages 49% at this address vs 36% district-wide (+13 pts) — the actual schools serving this property are materially stronger than the Schenectady City School District average implies; a family-tenant draw the district grade alone would hide.
- Market conditions: 21 active listings in the ZIP; 154 units permitted in Schenectady County in 2024 (54 in 5+ unit buildings).
Forward outlook
- In year one you build about $11k of equity ($2k loan paydown + $9k appreciation (3.2% local appreciation)).
- Schenectady County population projected to shrink 4% by 2050 — rents likely to lag national; underwrite the cash flow, not the appreciation.
- At projected returns (3.2% appreciation + 3.0% rent growth), your $80k cash investment doubles in ~2 years — after that, you're playing with house money.
- By year 4, paydown + projected appreciation supports a ~$38k cash-out refi (75% LTV) — recoverable capital for the next deal without selling this one.
Negotiation context
- It's been on market 61 days — a 6% lower offer ($268k) is reasonable based on typical stale-listing flexibility.
- 8 sale attempts since 23y ago with the ask held roughly flat each time — persistent listings suggest the price (not the market) is what's stuck; bring a comps-based counter.
- Current owner paid $96k; list at $285k implies a 198% gain — meaningful room to come down on a strong offer.
Risks & watch-outs
- Watch-outs: built in 1900 — expect roof / HVAC / electrical / plumbing capex.
Questions for the listing agent
- It's been on market 61 days. Have you received any prior offers? Is the seller open to a 6% concession, seller financing, or rate buy-down credit?
- Can we see the unit-by-unit rent roll, current vacancy, and any below-market leases? What's the average tenancy length?
- What capital expenditures (roof, boiler, parking lot, exteriors) have been made in the last 5 years, and what's planned in the next 2?
- Built in 1900 — when were the roof, HVAC, electrical panel, plumbing, and water heater last replaced?
- Why hasn't it sold? Are there any deal-killer items the seller is aware of (foundation, flood, title, zoning, code violations)?
- Is there a deadline driving the sale (1031 exchange, divorce, estate, relocation)? That informs how much negotiation room exists.
- Crime grade is F in this area — have there been break-ins, vandalism, or insurance claims at this property in the last 3 years? What carrier currently insures it and at what premium?
- What's the average days-on-market for RENTAL listings here right now (not sales)? A rising rental-DOM trend means longer vacancies and softer asking-rent achievability than the comps imply.
- What's the recent tenant-quality profile in this submarket — average credit score on applications, eviction rate, late-payment / NSF rate, and stable-employment percentage? A property-management company in the area should have these aggregated.
- How much new apartment / multifamily construction is in the pipeline within 1–3 miles? Heavy new supply (>2% of stock underway) typically softens rents 12–24 months out; light construction supports rent growth.
Investment metrics
- 1% rule
- 2.07% ✓
- Cap rate
- 16.68%
- Cash-on-cash
- 37.09%
- DSCR
- 2.65
- GRM
- 4.0
CMA / ARV
- ARV (median comp)
- $355,582
- List price
- $284,900
- Delta
- -19.88%
- Verdict
- UNDERPRICED
- Comps
- 20 within 1.0 mi
Show comp detail 7 sales within ~0.75 mi
| Address | Dist | Beds/Ba | Sqft | Sold | Price | $/sf | Match |
|---|---|---|---|---|---|---|---|
| 116 N Ferry St | 0.13mi | 6/2.0 | 2,600 (+10%) | 6mo | $275,000 | $106 | 71 |
| 5 Barney St | 0.68mi | 6/2.0 | 2,280 (-3%) | 9mo | $250,000 | $110 | 55 |
| 531 Nott St | 0.74mi | 6/2.0 | 2,524 (+7%) | 4mo | $210,000 | $83 | 50 |
| 515 South Ave | 0.35mi | 5/3.0 (-1) | 2,070 (-12%) | 6mo | $172,000 | $83 | 50 |
| 1515 Foster Ave | 0.74mi | 6/2.0 | 2,256 (-4%) | 18mo | $230,000 | $102 | 43 |
| 316 Georgetta Dix Plz | 0.66mi | 6/4.0 | 2,664 (+13%) | 4mo | $262,500 | $99 | 35 |
| 750 Eastern Ave Ave | 0.75mi | 5/2.0 (-1) | 2,210 (-6%) | 21mo | $200,000 | $90 | 33 |
Match score weights: distance 35% · size 25% · config 20% · recency 20%. Top-matched comps best support the ARV.
Projected returns pro-forma
3.2% appreciation · 3.0% rent growth · sell at horizon
- IRR
- 43.0%
- Equity multiple
- 3.44×
- Total profit
- $194,615
- Equity at exit
- $131,340
- IRR
- 42.7%
- Equity multiple
- 6.88×
- Total profit
- $469,351
- Equity at exit
- $204,964
Cash invested: $79,772 (down + closing). Projections, not guarantees.
Landlord ↔ Tenant lean methodology
- Overall (STATE)
- 15 Strongly Tenant-Friendly
- State New York
- 15 Strongly Tenant-Friendly · D+10
- County
- — inherits STATE
- City
- — inherits STATE
ZIP-level market 12305
- Home prices YoY
- 1.2%
- Active inventory
- 21
- Price-to-rent
- 12.1×
Monthly cashflow live
- Estimated rent
- $5,891 high interval (Pro) →
- Mortgage (P&I)
- −$1,494
- Tax from tax record
- −$576 /mo · $6,908/yr
- Insurance
- −$119
- HOA
- −$0
- Vacancy / Maint / Mgmt
- −$1,237
- Net cashflow
- $2,465
Break-even live
Sensitivity live
| Price | -10% $2,627 | -5% $2,546 | +0% $2,465 | +5% $2,385 | +10% $2,304 |
|---|---|---|---|---|---|
| Rent | -10% $2,000 | -5% $2,233 | +0% $2,465 | +5% $2,698 | +10% $2,931 |
| Rate | -1.0pp $2,609 | -0.5pp $2,538 | base $2,465 | +0.5pp $2,392 | +1.0pp $2,317 |
3-unit breakdown (identical units grouped — click to expand)
| Units | Beds | Baths | Est. rent |
|---|---|---|---|
| 3× units | 4 | 3 | $5,892 |
| #1 | 4 | 3 | $1,964 |
| #2 | 4 | 3 | $1,964 |
| #3 | 4 | 3 | $1,964 |
| Total (3 units) | $5,891 | ||
UW: 25.0% down · 7.5% · 30yr · 1.5% tax · 5.0% vac · 8.0% maint · 8.0% mgmt
Financing live
Cash to close
- Down payment
- $71,225
- Closing costs
- $8,547
- Reserves months
- —
- Total cash needed
- —
Loan-product check · same deal, 3 products live
Conventional
25% down · 7.5% · 30yr
- Down + closing
- —
- Monthly P&I
- —
- Monthly cashflow
- —
- DSCR
- —
- Eligible?
- —
Personal DTI + credit; lowest rate.
DSCR
20% down · 8.5% · 30yr
- Down + closing
- —
- Monthly P&I
- —
- Monthly cashflow
- —
- DSCR
- —
- Eligible?
- —
No personal income docs; deal must DSCR.
Hard money
10% down · 12.0% · 12mo
- Down + closing
- —
- Monthly P&I
- —
- Monthly cashflow
- —
- DSCR
- —
- Eligible?
- —
Short-term bridge; refi at stabilization.
Listing history 37 events
-
2026-06-21days on market $284,900 Active 61 DOM
-
2026-06-18days on market $284,900 Active 58 DOM
-
2026-06-17days on market $284,900 Active 57 DOM
-
2026-06-16days on market $284,900 Active 56 DOM
-
2026-06-15days on market $284,900 Active 55 DOM
-
2026-06-14days on market $284,900 Active 53 DOM
-
2026-06-13days on market $284,900 Active 52 DOM
-
2026-06-10days on market $284,900 Active 50 DOM
-
2026-06-09days on market $284,900 Active 49 DOM
-
2026-06-08days on market $284,900 Active 48 DOM
-
2026-06-07days on market $284,900 Active 47 DOM
-
2026-06-03days on market $284,900 Active 43 DOM
-
2026-06-02days on market $284,900 Active 42 DOM
-
2026-06-01days on market $284,900 Active 41 DOM
-
2026-05-31days on market $284,900 Active 40 DOM
-
2026-05-31days on market $284,900 Active 39 DOM
-
2026-04-21$284,900 Active 564-char remark
Show marketing remark (564 chars)
Nestled in the heart of Schenectady's sought-after Stockade neighborhood, this traditional brick triplex offers a rare investment opportunity in one of the city's most picturesque and historic areas. Fully rented with long-term tenants in place, this property provides immediate cash flow and solid rental history. The layout features two units on the first floor and a third unit on the second floor. Classic brick construction, walkable surroundings, and close proximity to downtown, restaurants, and Rivers Casino make this a high-demand location for tenants.
-
2026-04-21historical
Show marketing remark (564 chars)
Nestled in the heart of Schenectady's sought-after Stockade neighborhood, this traditional brick triplex offers a rare investment opportunity in one of the city's most picturesque and historic areas. Fully rented with long-term tenants in place, this property provides immediate cash flow and solid rental history. The layout features two units on the first floor and a third unit on the second floor. Classic brick construction, walkable surroundings, and close proximity to downtown, restaurants, and Rivers Casino make this a high-demand location for tenants.
-
2026-03-11price $289,900
-
2026-01-16price $294,900
-
2025-12-16price $299,900
-
2025-11-21price $309,900
-
2025-10-20$319,900 Active
-
2017-01-01historical
-
2016-09-08$189,000 New
-
2016-01-01historical
-
2015-09-16status Active
-
2015-09-16price $174,000
-
2015-09-11historical
-
2015-09-10$179,000 Active
-
2012-11-01historical
-
2012-04-24$189,000
-
2008-09-04historical
-
2008-04-06$190,000
-
2003-09-11soldstatus $95,500
-
2003-09-03soldstatus $95,500
-
2003-04-09$90,000
ⓘ Source: listings_history table (triggers on properties + properties_extension) + one-shot
backfill from property_details.listing_events for pre-trigger history.
Tax reassessment forecast NY · Partial reset (capped growth)
- Current annual tax
- $6,908 · $576/mo
- Projected year-2 tax
- $6,908 · $576/mo
- Expected delta
- $0/yr ($0/mo · 0.0%)
ⓘ Screening estimate from a state-policy table — verify with the county assessor before closing.
Climate risk First Street
- Flood 4/10 Moderate FEMA zone X (unshaded) · 23% chance over 30 yrs
- Wildfire 1/10 Low
- Heat 4/10 Moderate 7 d/yr ≥96°F today · 16 d/yr by 30 yrs out
- Wind 2/10 Low 4% chance of damaging wind over 30 yrs
- Air quality 1/10 Low 0 unhealthy d/yr today · 0 by 30 yrs out
Nearby sold comps map
Loading sold comps map…
Walkable amenities ~0.75 mi
Loading nearby amenities…
Taxation est. · year 1
- Rental income
- $70,692
- − Mortgage interest
- −$15,959
- − Property taxes
- −$6,908
- − Insurance
- −$1,424
- − Repairs & maintenance
- −$5,655
- − Management
- −$5,655
- − Depreciation
- −$8,288
- Taxable income
- $26,802
- Est. tax owed @ 24.0%
- −$6,433
- After-tax cash flow
- $23,153/yr
For passive investors: Depreciation is non-cash, so a rental often shows a tax loss while cash-flowing — sheltering income. Rental losses are passive: they offset passive income freely, and up to $25,000/yr can offset ordinary (W-2) income if you actively participate and your MAGI is under $100k (phasing out to $0 by $150k); unused losses carry forward. On sale, claimed depreciation is recaptured at up to 25%, and gains may owe capital-gains tax (a 1031 exchange can defer both). Figures are a year-1 estimate at your 24.0% rate — not tax advice; consult a CPA.
Schools (NCES district)
- District
- Schenectady City School District
- NCES district ID
- 3626010
- Math proficiency
- 38% ▲ 12.00%
- Reading proficiency
- 34% ▲ 2.00%
- Median HH income
- $39,453
- Composite
- 30.2/100
- National rank
- #6309
- State rank
- #556 of 590 in NY
Livability — Schenectady
- Score
- 78/100
- State rank
- #167
- US rank
- #2597
Category grades
Schools grade is shown separately in the Schools card above.
Census & demographics
- Census place
- Schenectady, NY
- County
- Schenectady County · 141,369 people
- City population
- 141,369
- Metro
- Albany-Schenectady-Troy, NY
- Population (ZIP)
- 7,356
- Household income
- $53,326
- Rent vs Own
- Severe rent burden
- 962.0
Population outlook (Schenectady County) Hauer SSP2
- Today (2025)
- 155,046 people
- By 2030
- 154,322 · -0.5%
- By 2040
- 151,796 · -2.1%
- By 2050
- 148,621 · -4.1%
- By 2075
- 141,229 · -8.9%
- By 2100
- 126,014 · -18.7%
Race, ethnicity, and origin ACS 2023
- Neighborhood character
- Diverse neighborhood (Simpson 0.60)
- Race & ethnicity
- White 59% Black 20% Two or more races 14% Hispanic / Latino 10% Asian 2%
- Hispanic origin (detail)
- Mexican 3% Puerto Rican 4%
- Common ancestry
- Romanian 5% Italian 2% Serbian 2%
- Foreign-born
- 10% · Canada, China
- Languages at home
- 91% English-only · Spanish 5% Other Indo-European 1% Russian/Polish/Slavic 1%
Political lean MEDSL · Schenectady
- 2024 margin
- D (+10.8) · D 55.4% · R 44.6%
- 2008→2024 swing
- -1.8pp toward R · 2008: 12.7pp · 2024: 10.8pp
- All cycles
- 2024: D+10.8 2020: D+15.7 2016: D+5.8 2012: D+15.4 2008: D+12.7
Not yet ingested
- Civics
- —
Market trends
- HPI YoY
- ▲ 3.20%
- Current HPI
- 276.7183
- Rent YoY
- —
- Metro
- Albany-Schenectady-Troy, NY
- State GDP YoY
- ▲ 2.60%
- F500 in state
- 92
Industry mix (Fortune 500 HQ in NY)
| Industry | F500 HQs | Revenue |
|---|---|---|
| Financial Services | 10 | $950B |
|
||
| Consumer Goods | 9 | $162B |
|
||
| Insurance | 4 | $225B |
|
||
| Telecommunications | 2 | $144B |
|
||
| Pharmaceuticals | 2 | $112B |
|
||
| Media / Entertainment | 2 | $69B |
|
||
Price history
+216.6% since first listed21 events — show timeline
- 2026-04-21 Listed $284,900 Global MLS
- 2026-04-21 Listing Removed — Global MLS
- 2026-03-11 Price Changed $289,900 Global MLS
- 2026-01-16 Price Changed $294,900 Global MLS
- 2025-12-16 Price Changed $299,900 Global MLS
- 2025-11-21 Price Changed $309,900 Global MLS
- 2025-10-20 Listed $319,900 Global MLS
- 2017-01-01 Listing Removed — Global MLS
- 2016-09-08 Listed $189,000 Global MLS
- 2016-01-01 Listing Removed — Global MLS
- 2015-09-16 Relisted — Global MLS
- 2015-09-16 Price Changed $174,000 Global MLS
- 2015-09-11 Listing Removed — Global MLS
- 2015-09-10 Listed $179,000 Global MLS
- 2012-11-01 Listing Removed — Global MLS
- 2012-04-24 Listed $189,000 Global MLS
- 2008-09-04 Listing Removed — Global MLS
- 2008-04-06 Listed $190,000 Global MLS
- 2003-09-11 Sold (Public Records) $95,500 Public Records
- 2003-09-03 Sold (MLS) $95,500 Global MLS
- 2003-04-09 Listed $90,000 Global MLS
Property tax history
+0.7%/yrLatest (2025): $6,908 · +3.0% YoY. Source: county tax records.
Cash-flow waterfall
monthlySold comps — $/sqft
last 12 mo · ≤1 miLoading sold comps…