775 Allen Dr · North Wildwood, NJ
Flood risk No data
- FEMA flood zone
- —
- Chance of flooding over 30 yrs
- —
- Est. flood insurance / yr
- —
Fire risk No data
- Est. fire insurance / yr
- —
Heat risk No data
- Hot days now (above threshold)
- —
- Hot days in 30 yrs
- —
Wind risk No data
- Chance of severe wind over 30 yrs
- —
Air-quality risk No data
- Unhealthy air days now
- —
- Unhealthy air days in 30 yrs
- —
Risk factors via First Street. Map © Google.
Why this score? — see what drove the B grade
The composite is a weighted blend of 9 inputs, each scored 0–100. Each bar is that input's sub-score; the figure is the points it added to the 100-point composite (weight × sub-score).
- Cash flow +30.0/30.0
- 1% rule +10.0/10.0
- DSCR +10.0/10.0
- ARV discount +7.5/15.0
- Schools +4.4/10.0
- Condition / age +3.8/5.0
- Livability +3.4/5.0
- Rent growth +2.5/5.0
- Appreciation +0.0/10.0
$555,000
🖨 Deal sheet 📄 Offer letter ✓ Due diligence
Listing remarks
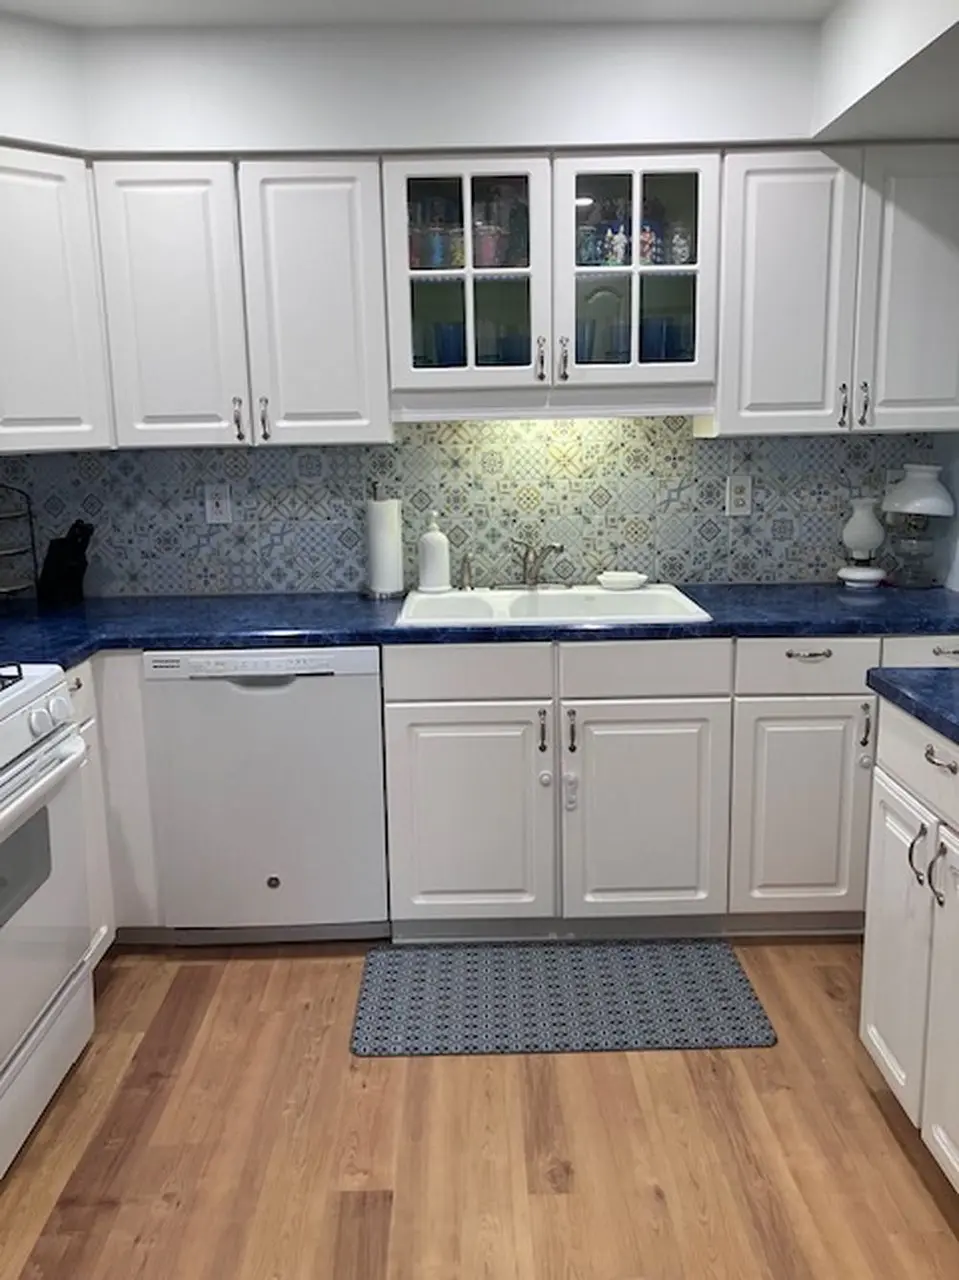
OPEN HOUSE Sale by Owner SATURDAY MAY 9 - 11:00am TO 2:30pm 775 Allen Drive A- 201 NORTH WILDWOOD - ANGLESEA Please park on street or in parking lot space marked A or E, thank you. Look for balloons and signage. Turn Key, 1100 sq. ft. , heated, salt water pool, off street parking. 24 unit, friendly, financially sound community. Walk into a L shaped living room, dining space with brand new LUX flooring flowing into updated kitchen. A front deck, with prep table, chairs, table and grill. Two recently renovated bathroom one with deep tub the other a beautiful walk-in shower. Laundry room with shelving. Three good sized bedrooms all with closets, plus the walk-in in the primary being used as
Key facts
- Laundry room
- Updated kitchen
- Walk-in shower
Tags
Neighborhood map
What this means for you Summary
Snapshot
- This is a 3-bed/2.0-bath condo listed at $555k. Condition is rated good.
Deal economics
- At list price, monthly cash flow is $6k ($77k/yr) — positive.
- The deal already cash-flows at list — no discount required.
- Meets the 1% rule at list price ($13k rent vs $555k).
- Cap rate 20.2% vs local median 3.6% in North Wildwood — top-decile yield for the area; either an underpriced asset or a hidden risk that comps aren't pricing in. Stress-test before assuming the spread holds.
Location & tenants
- Location reads 68/100 on livability (#318 in NJ) — a middle-class / working-renter tenant base. Strengths: health & safety A+; Watch: amenities C-, crime D-, commute F.
- North Wildwood School District (suburban): math 55% / reading 45% proficiency, ranked #396 of 612 in NJ (top 65%) — acceptable for families but not a draw, mixed tenant base, ~2y average lease.
- Market conditions: 431 active listings in the ZIP; 1 comparable units currently listed for rent nearby; 877 units permitted in Cape May County in 2024 (35 in 5+ unit buildings).
Forward outlook
- Local home prices are declining (-3.0%/yr); year-one equity from $4k of loan paydown is wiped out by about $17k of value loss. Plan a longer hold.
- Cape May County population projected at -24% by 2050 — secular population decline; favor cash flow + early exit over multi-decade hold.
- At projected returns (-3.0% appreciation + 3.0% rent growth), your $155k cash investment doubles in ~3 years — after that, you're playing with house money.
Negotiation context
- Only 11 days on market — expect competitive offers; lowballing is unlikely to land.
Questions for the listing agent
- Any open or pending special assessments — roof, HVAC, plumbing, elevator, façade? What's the per-unit balance and payoff schedule, and is the seller paying it off at close or rolling it to the buyer?
- Is there a deadline driving the sale (1031 exchange, divorce, estate, relocation)? That informs how much negotiation room exists.
- Crime grade is D in this area — have there been break-ins, vandalism, or insurance claims at this property in the last 3 years? What carrier currently insures it and at what premium?
- What's the average days-on-market for RENTAL listings here right now (not sales)? A rising rental-DOM trend means longer vacancies and softer asking-rent achievability than the comps imply.
- What's the recent tenant-quality profile in this submarket — average credit score on applications, eviction rate, late-payment / NSF rate, and stable-employment percentage? A property-management company in the area should have these aggregated.
- How much new apartment / multifamily construction is in the pipeline within 1–3 miles? Heavy new supply (>2% of stock underway) typically softens rents 12–24 months out; light construction supports rent growth.
Investment metrics
- 1% rule
- 2.34% ✓
- Cap rate
- 20.21%
- Cash-on-cash
- 49.69%
- DSCR
- 3.21
- GRM
- 3.6
CMA / ARV
No comps found within radius.
Projected returns pro-forma
-3.0% appreciation · 3.0% rent growth · sell at horizon
- IRR
- 47.4%
- Equity multiple
- 3.06×
- Total profit
- $320,080
- Equity at exit
- $82,752
- IRR
- 53.1%
- Equity multiple
- 6.19×
- Total profit
- $807,223
- Equity at exit
- $47,986
Cash invested: $155,400 (down + closing). Projections, not guarantees.
Landlord ↔ Tenant lean methodology
- Overall (STATE)
- 21 Tenant-Leaning
- State New Jersey
- 21 Tenant-Leaning · D+6
- County
- — inherits STATE
- City
- — inherits STATE
ZIP-level market 08260
- Home prices YoY
- -30.7%
- Active inventory
- 431
- Price-to-rent
- 3.6×
Monthly cashflow live
- Estimated rent
- $13,000 medium interval (Pro) →
- Mortgage (P&I)
- −$2,910
- Tax est. 1.5%
- −$694 /mo · $8,325/yr
- Insurance
- −$231
- HOA
- −$0
- Vacancy / Maint / Mgmt
- −$2,730
- Net cashflow
- $6,435
Break-even live
UW: 25.0% down · 7.5% · 30yr · 1.5% tax · 5.0% vac · 8.0% maint · 8.0% mgmt
Financing live
Cash to close
- Down payment
- $138,750
- Closing costs
- $16,650
- Reserves months
- —
- Total cash needed
- —
Loan-product check · same deal, 3 products live
Conventional
25% down · 7.5% · 30yr
- Down + closing
- —
- Monthly P&I
- —
- Monthly cashflow
- —
- DSCR
- —
- Eligible?
- —
Personal DTI + credit; lowest rate.
DSCR
20% down · 8.5% · 30yr
- Down + closing
- —
- Monthly P&I
- —
- Monthly cashflow
- —
- DSCR
- —
- Eligible?
- —
No personal income docs; deal must DSCR.
Hard money
10% down · 12.0% · 12mo
- Down + closing
- —
- Monthly P&I
- —
- Monthly cashflow
- —
- DSCR
- —
- Eligible?
- —
Short-term bridge; refi at stabilization.
Rent comps 1 comps
| Address | Beds | Baths | Sqft | Rent | $/sqft | DOM | Units | Dist |
|---|---|---|---|---|---|---|---|---|
| 642 W Pine Ave #2 North Wildwood, NJ | 3.0 | 1.0 | 1010 | $13,000 | $12.87 | 43d | 1 | 0.28mi |
HOA detail condo
- Monthly dues
- $0 · $0/yr
- Likely covers
- waterpool
- Assessments
- None detected in remarks — confirm with the listing agent.
Listing history 8 events
-
2026-06-15days on market $555,000 Active 11 DOM
-
2026-06-13days on market $555,000 Active 9 DOM
-
2026-06-12days on market $555,000 Active 8 DOM
-
2026-06-09days on market $555,000 Active 5 DOM
-
2026-06-08days on market $555,000 Active 4 DOM
-
2026-06-07days on market $555,000 Active 3 DOM
-
2026-06-07remarks 699-char remark
-
2026-06-07$555,000 Active 2 DOM
ⓘ Source: listings_history table (triggers on properties + properties_extension) + one-shot
backfill from property_details.listing_events for pre-trigger history.
Nearby sold comps map
Loading sold comps map…
Walkable amenities ~0.75 mi
Loading nearby amenities…
Taxation est. · year 1
- Rental income
- $156,000
- − Mortgage interest
- −$31,089
- − Property taxes
- −$8,325
- − Insurance
- −$2,775
- − Repairs & maintenance
- −$12,480
- − Management
- −$12,480
- − Depreciation
- −$16,145
- Taxable income
- $72,706
- Est. tax owed @ 24.0%
- −$17,449
- After-tax cash flow
- $59,765/yr
For passive investors: Depreciation is non-cash, so a rental often shows a tax loss while cash-flowing — sheltering income. Rental losses are passive: they offset passive income freely, and up to $25,000/yr can offset ordinary (W-2) income if you actively participate and your MAGI is under $100k (phasing out to $0 by $150k); unused losses carry forward. On sale, claimed depreciation is recaptured at up to 25%, and gains may owe capital-gains tax (a 1031 exchange can defer both). Figures are a year-1 estimate at your 24.0% rate — not tax advice; consult a CPA.
Condition & rehab AI · 13 photos
This condo is in good condition with recent updates, including new flooring and bathrooms. It is move-in ready and has a good curb appeal.
Value-add opportunities
- Resale Painting the exterior siding — Fresh paint can enhance the home's curb appeal and make it more attractive to potential buyers.
- Rental Upgrading the HVAC system — A new or well-maintained HVAC system can improve tenant satisfaction and reduce maintenance costs.
Renovation cost estimate screening
Value-add ROI direction
- Resale Painting the exterior siding — Fresh paint can enhance the home's curb appeal and make it more attractive to potential buyers. ↑
- Rental Upgrading the HVAC system — A new or well-maintained HVAC system can improve tenant satisfaction and reduce maintenance costs. ↑
ⓘ Cost ranges are severity-bucket heuristics (US national rule-of-thumb). Get contractor quotes + a written scope before underwriting a rehab budget.
Schools (NCES district)
- District
- North Wildwood School District
- NCES district ID
- 3411670
- Math proficiency
- 55% ▲ 5.00%
- Reading proficiency
- 45% ▬ 0.00%
- Median HH income
- $45,310
- Composite
- 44.38/100
- National rank
- #6123
- State rank
- #396 of 612 in NJ
Livability — North Wildwood
- Score
- 68/100
- State rank
- #318
- US rank
- #9827
Category grades
Schools grade is shown separately in the Schools card above.
Census & demographics
- Census place
- North Wildwood, NJ
- Population (ZIP)
- 12,913
Population outlook (Cape May County) Hauer SSP2
- Today (2025)
- 88,234 people
- By 2030
- 84,144 · -4.6%
- By 2040
- 75,146 · -14.8%
- By 2050
- 67,389 · -23.6%
- By 2075
- 55,732 · -36.8%
- By 2100
- 44,972 · -49.0%
Race, ethnicity, and origin ACS 2023
- Neighborhood character
- Predominantly White (78%)
- Race & ethnicity
- White 78% Hispanic / Latino 14% Two or more races 7% Black 3% Native American 1%
- Hispanic origin (detail)
- Mexican 10% Puerto Rican 3%
- Common ancestry
- Romanian 7% Slovak 2% Lithuanian 1%
- Foreign-born
- 9% · Canada
- Languages at home
- 84% English-only · Spanish 12% Other Indo-European 3% French/Haitian/Cajun 1%
Political lean MEDSL · Cape May
- 2024 margin
- R (+19.2) · D 39.7% · R 58.9% · Other 1.4%
- 2008→2024 swing
- -10.6pp toward R · 2008: -8.7pp · 2024: -19.2pp
- All cycles
- 2024: R+19.2 2020: R+15.9 2016: R+19.9 2012: R+8.9 2008: R+8.7
Not yet ingested
- Civics
- —
Market trends
- HPI YoY
- ▼ -243.83%
- Current HPI
- 551.3393
- Rent YoY
- —
- Metro
- —
- State GDP YoY
- ▲ 2.05%
- F500 in state
- 34
Industry mix (Fortune 500 HQ in NJ)
| Industry | F500 HQs | Revenue |
|---|---|---|
| Consumer Goods | 3 | $31B |
|
||
| Pharmaceuticals | 2 | $153B |
|
||
| Technology | 2 | $21B |
|
||
| Insurance | 2 | $20B |
|
||
| Healthcare | 2 | $19B |
|
||
| Financial Services | 1 | $70B |
|
||
Price history
1 event — show timeline
- 2026-06-04 Listed $555,000 ForSaleByOwner.com
Cash-flow waterfall
monthlySold comps — $/sqft
last 12 mo · ≤1 miLoading sold comps…