 Duplex
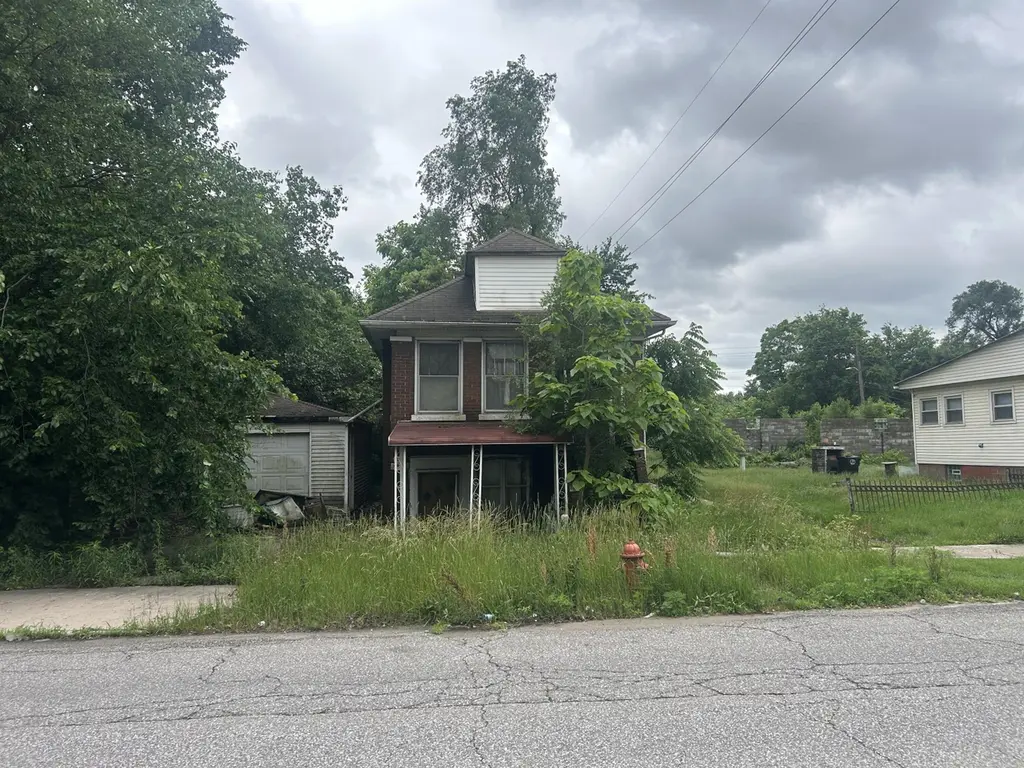
1297-1299 W 15th Ave · Gary, IN
Flood risk 4/10 · Minor
- FEMA flood zone
- X (unshaded)
- Chance of flooding over 30 yrs
- 0.24%
- Est. flood insurance / yr
- $507 – $1,088
Fire risk 1/10 · Minimal
- Est. fire insurance / yr
- $717 – $1,331
Heat risk 2/10 · Minimal
- Hot days now (above 102°F)
- 7 days/yr
- Hot days in 30 yrs
- 15 days/yr
Wind risk 2/10 · Minimal
- Chance of severe wind over 30 yrs
- 0.0%
Air-quality risk 4/10 · Minor
- Unhealthy air days now
- 5 days/yr
- Unhealthy air days in 30 yrs
- 6 days/yr
Risk factors via First Street. Map © Google.
Why this score? — see what drove the B+ grade
The composite is a weighted blend of 9 inputs, each scored 0–100. Each bar is that input's sub-score; the figure is the points it added to the 100-point composite (weight × sub-score).
- Cash flow +30.0/30.0
- ARV discount +15.0/15.0
- 1% rule +10.0/10.0
- DSCR +10.0/10.0
- Appreciation +5.5/10.0
- Livability +3.7/5.0
- Rent growth +2.5/5.0
- Condition / age +2.5/5.0
- Schools +0.5/10.0
$97,500
🖨 Deal sheet (PDF) 📄 Offer letter ✓ Due diligence
Multi-family units
County records classify this as Multi-Family (2-4 Unit). Listing-text estimate: 2 units. confirmed
Listing remarks
Investor special in Gary! This bi-level duplex offers an outstanding value-add opportunity for investors, flippers, or buyers looking to build sweat equity. Featuring two units--one upper and one lower--this property has strong income potential with projected rents of approximately 1,200 per month per unit, creating a potential gross annual income of 28,800. With some renovation and updates, investors may have the opportunity to achieve attractive cash flow and returns. Whether you're looking to expand your rental portfolio, complete a fix-and-hold project, or capitalize on Northwest Indiana's continued growth and revitalization, this property deserves a look. Located just minutes from maj
Key facts
- 7,057 sq ft lot
- Garage
- Built 1922
Property features AI
Finance
- Other: Occupant status: Vacant; Above-grade finished area reported as 996 (source: assessor); Total building area reported as 1,992
- Financial info: Property assessed by assessor (living area source); Assessed value and tax amounts available but excluded per instructions
- HOA & community: No HOA information reported
Exterior
- Parking: No designated parking reported
- Security: No security features reported
- Utilities: Public water; Public sewer
- Home design: Multi-family property with 2 units; Built in 1922
- Construction: Year built 1922; No construction material, roof, or foundation details reported
- Exterior features: Garage(s) listed as other structures; Property listed in fixer condition
Interior
- Kitchen: No appliances reported
- Bedrooms: Two 3-bedroom units (multi-family property)
- Flooring: No flooring information reported
- Bathrooms: Two full bathrooms (total)
- Heating & cooling: No heating or cooling systems reported
- Interior features: No notable interior features reported; Total of 10 rooms
- Laundry & utility: No laundry/utility appliances reported
Neighborhood map
What this means for you Summary
Snapshot
- This is a 2 × 3-bed/1.0-bath units multifamily listed at $98k.
Deal economics
- At list price, monthly cash flow is $1k ($15k/yr) — positive. Per door: $626/mo.
- The deal already cash-flows at list — no discount required.
- Meets the 1% rule at list price ($2k rent vs $98k).
- Cap rate 21.7% vs local median 9.1% in Gary — top-decile yield for the area; either an underpriced asset or a hidden risk that comps aren't pricing in. Stress-test before assuming the spread holds.
Location & tenants
- Location reads 73/100 on livability (#105 in IN) — a middle-class / working-renter tenant base. Strengths: commute A+, cost of living A+, housing A+; Watch: schools F, crime F, employment F.
- Gary Community School Corporation (urban): math 3% / reading 11% proficiency, ranked #299 of 301 in IN (top 99%) — low school quality limits family demand, transient renter base, plan for 1-2y turnover; 80% free/reduced lunch — lower-income household profile, screen leases tightly.
- Market conditions: 122 active listings in the ZIP; 12 comparable units currently listed for rent nearby; rentals at typical pace (median 15d on market — plan ~3-4 weeks tenant-placement turnaround); lower-income renter base — watch delinquency; 1,642 units permitted in Lake County in 2024 (14 in 5+ unit buildings).
- At $2,391/mo this rent would consume 101% of the median local household income ($29k/yr) (locally 392% of renters already pay >50% of income on rent) — very limited rent-growth headroom before tenants either downsize or default.
Forward outlook
- In year one you build about $2k of equity ($674 loan paydown + $955 appreciation (1.0% local appreciation)).
- Lake County population projected to shrink 7% by 2050 — rents likely to lag national; underwrite the cash flow, not the appreciation.
- At projected returns (1.0% appreciation + 3.0% rent growth), your $27k cash investment doubles in ~2 years — after that, you're playing with house money.
Negotiation context
- Only 3 days on market — expect competitive offers; lowballing is unlikely to land.
- 5 sale attempts since 17y ago with the ask held roughly flat each time — persistent listings suggest the price (not the market) is what's stuck; bring a comps-based counter.
Risks & watch-outs
- Watch-outs: built in 1922 — expect roof / HVAC / electrical / plumbing capex.
Questions for the listing agent
- Can we see the unit-by-unit rent roll, current vacancy, and any below-market leases? What's the average tenancy length?
- What capital expenditures (roof, boiler, parking lot, exteriors) have been made in the last 5 years, and what's planned in the next 2?
- Built in 1922 — when were the roof, HVAC, electrical panel, plumbing, and water heater last replaced?
- Is there a deadline driving the sale (1031 exchange, divorce, estate, relocation)? That informs how much negotiation room exists.
- Schools are F-rated, which usually means shorter tenancies and higher turnover. Who's the typical renter profile here, and what's been the actual vacancy rate?
- Crime grade is F in this area — have there been break-ins, vandalism, or insurance claims at this property in the last 3 years? What carrier currently insures it and at what premium?
- What's the average days-on-market for RENTAL listings here right now (not sales)? A rising rental-DOM trend means longer vacancies and softer asking-rent achievability than the comps imply.
- What's the recent tenant-quality profile in this submarket — average credit score on applications, eviction rate, late-payment / NSF rate, and stable-employment percentage? A property-management company in the area should have these aggregated.
- How much new apartment / multifamily construction is in the pipeline within 1–3 miles? Heavy new supply (>2% of stock underway) typically softens rents 12–24 months out; light construction supports rent growth.
Investment metrics
- 1% rule
- 2.45% ✓
- Cap rate
- 21.71%
- Cash-on-cash
- 55.06%
- DSCR
- 3.45
- GRM
- 3.4
CMA / ARV
- ARV (on-the-fly)
- $117,528
- Comps found
- 4
Show comp detail 4 sales within ~0.75 mi
| Address | Dist | Beds/Ba | Sqft | Sold | Price | $/sf | Match |
|---|---|---|---|---|---|---|---|
| 1330 Van Buren St | 0.46mi | 5/2.0 (+1) | 1,992 (0%) | 6mo | $35,000 | $18 | 69 |
| 1438 W 19th Ave | 0.23mi | 4/2.5 | 2,090 (+5%) | 13mo | $124,000 | $59 | 68 |
| 1676 W 13th Ave | 0.28mi | 5/2.0 (+1) | 2,262 (+14%) | 2mo | $142,500 | $63 | 58 |
| 1354 Roosevelt Pl | 0.58mi | 3/2.0 (-1) | 2,244 (+13%) | 21mo | $29,500 | $13 | 29 |
Match score weights: distance 35% · size 25% · config 20% · recency 20%. Top-matched comps best support the ARV.
Projected returns pro-forma
0.98% appreciation · 3.0% rent growth · sell at horizon
- IRR
- 57.8%
- Equity multiple
- 3.99×
- Total profit
- $81,513
- Equity at exit
- $33,182
- IRR
- 59.2%
- Equity multiple
- 8.03×
- Total profit
- $191,944
- Equity at exit
- $44,016
Cash invested: $27,300 (down + closing). Projections, not guarantees.
Landlord ↔ Tenant lean methodology
- Overall (STATE)
- 90 Strongly Landlord-Friendly
- State Indiana
- 90 Strongly Landlord-Friendly · R+11
- County
- — inherits STATE
- City
- — inherits STATE
ZIP-level market 46407
- Home prices YoY
- 0.4%
- Active inventory
- 122
- Price-to-rent
- 6.8×
Monthly cashflow live
- Estimated rent
- $2,391 high interval (Pro) →
- Mortgage (P&I)
- −$511
- Tax from tax record
- −$84 /mo · $1,013/yr
- Insurance
- −$41
- HOA
- −$0
- Vacancy / Maint / Mgmt
- −$502
- Net cashflow
- $1,253
Break-even live
Sensitivity live
| Price | -10% $1,308 | -5% $1,280 | +0% $1,253 | +5% $1,225 | +10% $1,197 |
|---|---|---|---|---|---|
| Rent | -10% $1,064 | -5% $1,158 | +0% $1,253 | +5% $1,347 | +10% $1,441 |
| Rate | -1.0pp $1,302 | -0.5pp $1,277 | base $1,253 | +0.5pp $1,227 | +1.0pp $1,202 |
2-unit breakdown (identical units grouped — click to expand)
| Units | Beds | Baths | Est. rent |
|---|---|---|---|
| 2× units | 3 | 1 | $2,392 |
| #1 | 3 | 1 | $1,196 |
| #2 | 3 | 1 | $1,196 |
| Total (2 units) | $2,391 | ||
UW: 25.0% down · 7.5% · 30yr · 1.5% tax · 5.0% vac · 8.0% maint · 8.0% mgmt
Financing live
Cash to close
- Down payment
- $24,375
- Closing costs
- $2,925
- Reserves months
- —
- Total cash needed
- —
Loan-product check · same deal, 3 products live
Conventional
25% down · 7.5% · 30yr
- Down + closing
- —
- Monthly P&I
- —
- Monthly cashflow
- —
- DSCR
- —
- Eligible?
- —
Personal DTI + credit; lowest rate.
DSCR
20% down · 8.5% · 30yr
- Down + closing
- —
- Monthly P&I
- —
- Monthly cashflow
- —
- DSCR
- —
- Eligible?
- —
No personal income docs; deal must DSCR.
Hard money
10% down · 12.0% · 12mo
- Down + closing
- —
- Monthly P&I
- —
- Monthly cashflow
- —
- DSCR
- —
- Eligible?
- —
Short-term bridge; refi at stabilization.
Rent comps 12 comps
| Address | Beds | Baths | Sqft | Rent | $/sqft | DOM | Units | Dist |
|---|---|---|---|---|---|---|---|---|
| 1572 Polk St Gary, IN | 3.0 | 1.0 | 1500 | $1,250 | $0.83 | 0d | 1 | 0.27mi |
| 1744 Tyler St Unit 2 Gary, IN | 4.0 | 2.0 | 1600 | $1,700 | $1.06 | 46d | 1 | 0.36mi |
| 803 Pierce St Gary, IN | 4.0 | 2.0 | 1600 | $1,400 | $0.88 | 2d | 1 | 0.59mi |
| 765 Garfield St Gary, IN | 3.0 | 1.0 | 1688 | $1,500 | $0.89 | 15d | 1 | 0.67mi |
| 2157 Marshall Pl Gary, IN | 3.0 | 1.5 | 1650 | $1,295 | $0.78 | 45d | 1 | 1.09mi |
| 2600 Pierce St Gary, IN | 4.0 | 2.0 | 1800 | $1,950 | $1.08 | 45d | 1 | 1.11mi |
| 1368 Waite St Gary, IN | 3.0 | 2.0 | 1696 | $1,800 | $1.06 | 0d | 1 | 1.20mi |
| 1348 Waite St Gary, IN | 4.0 | 2.0 | 1776 | $1,850 | $1.04 | 0d | 1 | 1.20mi |
| 1109 Maryland St Unit 1 Gary, IN | 3.0 | 1.5 | 1982 | $1,000 | $0.50 | 0d | 1 | 1.22mi |
| 1109 Maryland St Gary, IN | 3.0 | 1.0 | 1982 | $1,000 | $0.50 | 0d | 1 | 1.22mi |
| 672 Connecticut St Apt 1S Gary, IN | 3.0 | 1.0 | 1247 | $875 | $0.70 | 16d | 1 | 1.23mi |
| 373 Taft Pl Gary, IN | 4.0 | 2.0 | 1984 | $1,800 | $0.91 | 45d | 1 | 1.27mi |
Listing history 3 events
-
2026-06-21days on market $97,500 Active 3 DOM
-
2026-06-18remarks 699-char remark
-
2026-06-18$97,500 Active 1 DOM
ⓘ Source: listings_history table (triggers on properties + properties_extension) + one-shot
backfill from property_details.listing_events for pre-trigger history.
Tax reassessment forecast IN · Partial reset (capped growth)
- Current annual tax
- $1,013 · $84/mo
- Projected year-2 tax
- $1,013 · $84/mo
- Expected delta
- $0/yr ($0/mo · 0.0%)
ⓘ Screening estimate from a state-policy table — verify with the county assessor before closing.
Climate risk First Street
- Flood 4/10 Moderate FEMA zone X (unshaded) · 24% chance over 30 yrs
- Wildfire 1/10 Low
- Heat 2/10 Low 7 d/yr ≥102°F today · 15 d/yr by 30 yrs out
- Wind 2/10 Low 0% chance of damaging wind over 30 yrs
- Air quality 4/10 Moderate 5 unhealthy d/yr today · 6 by 30 yrs out
Nearby sold comps map
Loading sold comps map…
Walkable amenities ~0.75 mi
Loading nearby amenities…
Taxation est. · year 1
- Rental income
- $28,692
- − Mortgage interest
- −$5,462
- − Property taxes
- −$1,013
- − Insurance
- −$488
- − Repairs & maintenance
- −$2,295
- − Management
- −$2,295
- − Depreciation
- −$2,836
- Taxable income
- $14,303
- Est. tax owed @ 24.0%
- −$3,433
- After-tax cash flow
- $11,598/yr
For passive investors: Depreciation is non-cash, so a rental often shows a tax loss while cash-flowing — sheltering income. Rental losses are passive: they offset passive income freely, and up to $25,000/yr can offset ordinary (W-2) income if you actively participate and your MAGI is under $100k (phasing out to $0 by $150k); unused losses carry forward. On sale, claimed depreciation is recaptured at up to 25%, and gains may owe capital-gains tax (a 1031 exchange can defer both). Figures are a year-1 estimate at your 24.0% rate — not tax advice; consult a CPA.
Schools (NCES district)
- District
- Gary Community School Corporation
- NCES district ID
- 1803870
- Math proficiency
- 3% ▼ -10.00%
- Reading proficiency
- 11% ▼ -6.00%
- Median HH income
- $27,739
- Composite
- 4.98/100
- National rank
- #10039
- State rank
- #299 of 301 in IN
Livability — Gary
- Score
- 73/100
- State rank
- #105
- US rank
- #5592
Category grades
Schools grade is shown separately in the Schools card above.
Census & demographics
- Census place
- Gary, IN
- County
- Lake County · 422,878 people
- City population
- 63,701
- Metro
- Chicago-Naperville-Elgin, IL-IN-WI
- Population (ZIP)
- 8,577
- Household income
- $28,526
- Rent vs Own
- Severe rent burden
- 392.0
Population outlook (Lake County) Hauer SSP2
- Today (2025)
- 484,026 people
- By 2030
- 478,091 · -1.2%
- By 2040
- 462,974 · -4.3%
- By 2050
- 449,894 · -7.1%
- By 2075
- 436,169 · -9.9%
- By 2100
- 426,607 · -11.9%
Race, ethnicity, and origin ACS 2023
- Neighborhood character
- Predominantly Black (91%)
- Race & ethnicity
- Black 91% Hispanic / Latino 3% White 2% Two or more races 1%
- Common ancestry
- Romanian 1%
- Foreign-born
- 1% · Canada
- Languages at home
- 97% English-only · Spanish 1% Russian/Polish/Slavic 1% French/Haitian/Cajun 1%
Political lean MEDSL · Lake
- 2024 margin
- Lean D (+5.6) · D 52.1% · R 46.5% · Other 1.5%
- 2008→2024 swing
- -28.6pp toward R · 2008: 34.3pp · 2024: 5.6pp
- All cycles
- 2024: D+5.6 2020: D+15.1 2016: D+20.6 2012: D+31.0 2008: D+34.3
Not yet ingested
- Civics
- —
Market trends
- HPI YoY
- ▲ 0.98%
- Current HPI
- 253.2856
- Rent YoY
- —
- Metro
- Chicago-Naperville-Elgin, IL-IN-WI
- State GDP YoY
- ▲ 2.90%
- F500 in state
- 18
Industry mix (Fortune 500 HQ in IN)
| Industry | F500 HQs | Revenue |
|---|---|---|
| Industrial Machinery | 2 | $37B |
|
||
| Healthcare | 1 | $177B |
|
||
| Pharmaceuticals | 1 | $45B |
|
||
| Metals / Steel | 1 | $18B |
|
||
| Agriculture | 1 | $17B |
|
||
| Packaging | 1 | $12B |
|
||
Price history
+290.0% since first listed9 events — show timeline
- 2026-06-18 Listed $97,500 NIRA MLS as Distributed by MLS Grid
- 2012-09-02 Listing Removed — NIRA MLS as Distributed by MLS Grid
- 2012-09-02 Listing Removed — NIRA MLS as Distributed by MLS Grid
- 2012-03-01 Listed $30,000 NIRA MLS as Distributed by MLS Grid
- 2012-03-01 Listed $30,000 NIRA MLS as Distributed by MLS Grid
- 2010-02-02 Listing Removed — NIRA MLS as Distributed by MLS Grid
- 2010-02-02 Listing Removed — NIRA MLS as Distributed by MLS Grid
- 2009-08-01 Listed $25,000 NIRA MLS as Distributed by MLS Grid
- 2009-08-01 Listed $25,000 NIRA MLS as Distributed by MLS Grid
Property tax history
+1.6%/yrLatest (2024): $1,013 · -2.2% YoY. Source: county tax records.
Cash-flow waterfall
monthlySold comps — $/sqft
last 12 mo · ≤1 miLoading sold comps…