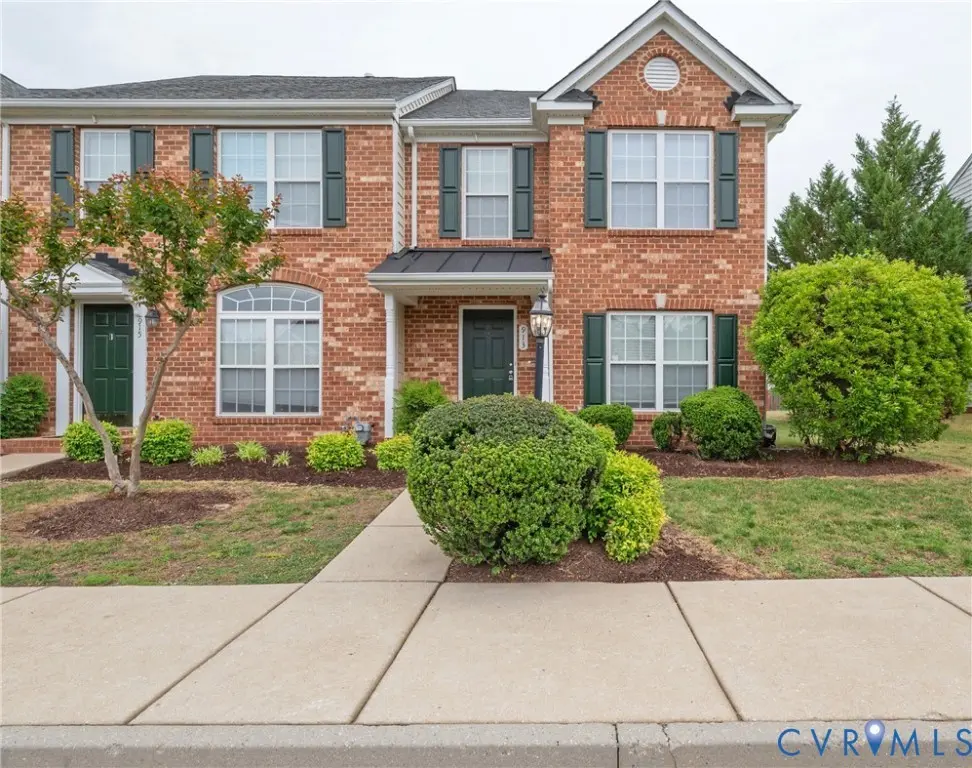
913 Dominion Townes Ct · East Highland Park, VA
Flood risk 1/10 · Minimal
- FEMA flood zone
- X (unshaded)
- Chance of flooding over 30 yrs
- 0.0%
- Est. flood insurance / yr
- $507 – $1,088
Fire risk 3/10 · Minor
- Est. fire insurance / yr
- $666 – $1,236
Heat risk 7/10 · Major
- Hot days now (above 106°F)
- 7 days/yr
- Hot days in 30 yrs
- 16 days/yr
Wind risk 6/10 · Moderate
- Chance of severe wind over 30 yrs
- 27.0%
Air-quality risk 2/10 · Minimal
- Unhealthy air days now
- 1 days/yr
- Unhealthy air days in 30 yrs
- 3 days/yr
Risk factors via First Street. Map © Google.
Why this score? — see what drove the D- grade
The composite is a weighted blend of 9 inputs, each scored 0–100. Each bar is that input's sub-score; the figure is the points it added to the 100-point composite (weight × sub-score).
- Cash flow +10.5/30.0
- ARV discount +7.9/15.0
- Schools +4.9/10.0
- Rent growth +4.1/5.0
- Livability +3.6/5.0
- 1% rule +3.0/10.0
- DSCR +3.0/10.0
- Condition / age +2.5/5.0
- Appreciation +0.0/10.0
$299,993
🖨 Deal sheet (PDF) 📄 Offer letter ✓ Due diligence
Listing remarks
Welcome to 913 Dominion Townes Court, located in Dominion Townes, one of Henrico’s premier low-maintenance communities. This beautifully updated end-unit townhome offers 3 bedrooms, 2.5 baths, and more than 1,500 square feet of comfortable living space designed for both everyday living and entertaining. The charming brick exterior, vinyl windows, and recent upgrades make this home move-in ready and appealing to today’s buyers. Inside, you will find fresh neutral paint, modern lighting, new laminate flooring throughout the main level, and brand-new carpet upstairs. The bright front living room flows seamlessly into the dining area, highlighted by a bay window and updated chandeli
Key facts
- Private fenced patio
- Eat-in island
- Oversized kitchen
Tags
Property features AI
Finance
- HOA & community: Homeowners association with a $140 monthly fee; Association fee covers common areas, structure maintenance, snow removal, and trash; Community features include common grounds/area
Exterior
- Parking: Assigned parking; Guest parking
- Utilities: Public water; Public sewer
- Home design: 2-story property; Attached property
- Construction: Frame construction with vinyl siding; Composition roof
- Exterior features: Storage shed; Patio; Stoop; Fenced yard with privacy fencing; Level topography
Interior
- Kitchen: Granite counters
- Bedrooms: Total rooms: 7
- Flooring: Carpet; Laminate; Vinyl
- Bathrooms: 2 full bathrooms; 1 half bathroom; Second-floor bath includes tub & shower
- Heating & cooling: Central air conditioning; Forced air heating with natural gas
- Interior features: Breakfast area; Bay window; Dining area; Granite counters
Neighborhood map
What this means for you Summary
Snapshot
- This is a 3-bed/2.5-bath townhouse listed at $300k.
Deal economics
- At list price, monthly cash flow is $-152 ($-2k/yr) — negative.
- To cash-flow at today's rent, offer at most $273k (8.9% below list).
- To meet the 1% rule (rent ≥ 1% of price), the offer needs to be $239k (20.4% below list).
- Recommended offer: $239k (20.4% below list) — sets the bar for 1% rule.
- Cap rate 5.7% vs local median 4.2% in East Highland Park — top-decile yield for the area; either an underpriced asset or a hidden risk that comps aren't pricing in. Stress-test before assuming the spread holds.
Location & tenants
- Location reads 72/100 on livability (#197 in VA) — a middle-class / working-renter tenant base. Strengths: cost of living A+, housing A+, health & safety A+; Watch: employment C-, schools D-, amenities D-.
- Henrico County Public School District (suburban): math 49% / reading 64% proficiency, ranked #68 of 131 in VA (top 52%) — acceptable for families but not a draw, mixed tenant base, ~2y average lease.
- Market conditions: Rents rising fast (+6.4%/yr); 337 active listings in the ZIP; 8 comparable units currently listed for rent nearby; rentals at typical pace (median 18d on market — plan ~3-4 weeks tenant-placement turnaround); 1,826 units permitted in Henrico County in 2024 (785 in 5+ unit buildings).
- At $2,389/mo this rent would consume 51% of the median local household income ($56k/yr) (locally 3530% of renters already pay >50% of income on rent) — very limited rent-growth headroom before tenants either downsize or default.
Forward outlook
- Local home prices are declining (-3.0%/yr); year-one equity from $2k of loan paydown is wiped out by about $9k of value loss. Plan a longer hold.
- Henrico County population projected at +21% by 2050 — long-run rental-demand tailwind backs the buy-and-hold thesis.
Negotiation context
- Only 3 days on market — expect competitive offers; lowballing is unlikely to land.
- 4 sale attempts since 2y ago with the ask held roughly flat each time — persistent listings suggest the price (not the market) is what's stuck; bring a comps-based counter.
- Current owner paid $132k; list at $300k implies a 126% gain — meaningful room to come down on a strong offer.
Risks & watch-outs
- Climate carrying-cost: major wind risk, 27% chance of damaging wind over 30y; extreme-heat days projected 7→16/yr by 2055 (HVAC capex compounding) — expect insurance premiums to compound above CPI over the hold.
Questions for the listing agent
- What do current leases actually rent for vs. the listed asking? Can we see a recent rent roll and the last 12 months of T-12 income?
- What does the HOA fee cover, when was the last increase, and are there any pending special assessments or reserve-fund shortfalls?
- Is there a deadline driving the sale (1031 exchange, divorce, estate, relocation)? That informs how much negotiation room exists.
- Schools are D-rated, which usually means shorter tenancies and higher turnover. Who's the typical renter profile here, and what's been the actual vacancy rate?
- The area grade is low — what's the realistic commute time and amenity access for the typical tenant pool here? Any planned neighborhood developments (good or bad) we should know about?
- What's the average days-on-market for RENTAL listings here right now (not sales)? A rising rental-DOM trend means longer vacancies and softer asking-rent achievability than the comps imply.
- What's the recent tenant-quality profile in this submarket — average credit score on applications, eviction rate, late-payment / NSF rate, and stable-employment percentage? A property-management company in the area should have these aggregated.
- How much new for-sale + rental construction is in the pipeline within 1–3 miles? Heavy new supply typically softens prices + rents 12–24 months out; constrained supply supports both.
Investment metrics
- 1% rule
- 0.80% ✗
- Cap rate
- 5.69%
- Cash-on-cash
- -2.16%
- DSCR
- 0.90
- GRM
- 10.5
CMA / ARV
- ARV (on-the-fly)
- $303,000
- Comps found
- 12
Show comp detail 12 sales within ~0.75 mi
| Address | Dist | Beds/Ba | Sqft | Sold | Price | $/sf | Match |
|---|---|---|---|---|---|---|---|
| 913 Dominion Townes Ct | 0.00mi | 3/2.5 | 1,500 (0%) | 0mo | $303,000 | $202 | 100 |
| 3850 Dominion Townes Cir | 0.06mi | 3/2.5 | 1,500 (0%) | 4mo | $255,000 | $170 | 94 |
| 3846 Dominion Townes Cir | 0.07mi | 3/2.5 | 1,440 (-4%) | 1mo | $294,000 | $204 | 89 |
| 3836 Dominion Townes | 0.08mi | 3/2.5 | 1,452 (-3%) | 2mo | $307,000 | $211 | 89 |
| 4103 Dominion Townes Cir | 0.10mi | 3/2.5 | 1,440 (-4%) | 6mo | $298,000 | $207 | 84 |
| 3819 Dominion Townes Cir | 0.10mi | 3/2.5 | 1,440 (-4%) | 8mo | $282,000 | $196 | 82 |
| 4004 Dominion Townes Cir | 0.06mi | 3/2.5 | 1,454 (-3%) | 13mo | $299,000 | $206 | 81 |
| 4002 Dominion Townes Cir | 0.06mi | 3/2.5 | 1,440 (-4%) | 12mo | $289,993 | $201 | 80 |
| 4116 Dominion Townes Cir | 0.13mi | 3/2.5 | 1,452 (-3%) | 10mo | $289,000 | $199 | 80 |
| 3800 Dominion Townes Cir | 0.16mi | 3/2.5 | 1,452 (-3%) | 13mo | $295,000 | $203 | 76 |
| 428 Kingsridge Rd | 0.57mi | 3/2.5 | 1,452 (-3%) | 14mo | $265,500 | $183 | 56 |
| 412 Kingsridge Rd | 0.60mi | 3/2.5 | 1,280 (-15%) | 7mo | $255,000 | $199 | 42 |
Match score weights: distance 35% · size 25% · config 20% · recency 20%. Top-matched comps best support the ARV.
Projected returns pro-forma
-3.0% appreciation · 6.38% rent growth · sell at horizon
- IRR
- -16.2%
- Equity multiple
- 0.41×
- Total profit
- $-49,849
- Equity at exit
- $44,730
- IRR
- -2.9%
- Equity multiple
- 0.78×
- Total profit
- $-18,830
- Equity at exit
- $25,938
Cash invested: $83,998 (down + closing). Projections, not guarantees.
Landlord ↔ Tenant lean methodology
- Overall (STATE)
- 55 Moderately Landlord-Leaning
- State Virginia
- 55 Moderately Landlord-Leaning · D+2
- County
- — inherits STATE
- City
- — inherits STATE
ZIP-level market 23223
- Rents YoY
- 6.4%
- Active inventory
- 337
- Price-to-rent
- 10.5×
Monthly cashflow live
- Estimated rent
- $2,389 high interval (Pro) →
- Mortgage (P&I)
- −$1,573
- Tax from tax record
- −$200 /mo · $2,403/yr
- Insurance
- −$125
- HOA
- −$140
- Vacancy / Maint / Mgmt
- −$502
- Net cashflow
- $-152
Break-even live
Sensitivity live
| Price | -10% $18 | -5% $-67 | +0% $-152 | +5% $-236 | +10% $-321 |
|---|---|---|---|---|---|
| Rent | -10% $-340 | -5% $-246 | +0% $-152 | +5% $-57 | +10% $37 |
| Rate | -1.0pp $0 | -0.5pp $-75 | base $-152 | +0.5pp $-229 | +1.0pp $-308 |
UW: 25.0% down · 7.5% · 30yr · 1.5% tax · 5.0% vac · 8.0% maint · 8.0% mgmt
Financing live
Cash to close
- Down payment
- $74,998
- Closing costs
- $9,000
- Reserves months
- —
- Total cash needed
- —
Loan-product check · same deal, 3 products live
Conventional
25% down · 7.5% · 30yr
- Down + closing
- —
- Monthly P&I
- —
- Monthly cashflow
- —
- DSCR
- —
- Eligible?
- —
Personal DTI + credit; lowest rate.
DSCR
20% down · 8.5% · 30yr
- Down + closing
- —
- Monthly P&I
- —
- Monthly cashflow
- —
- DSCR
- —
- Eligible?
- —
No personal income docs; deal must DSCR.
Hard money
10% down · 12.0% · 12mo
- Down + closing
- —
- Monthly P&I
- —
- Monthly cashflow
- —
- DSCR
- —
- Eligible?
- —
Short-term bridge; refi at stabilization.
Rent comps 8 comps
| Address | Beds | Baths | Sqft | Rent | $/sqft | DOM | Units | Dist |
|---|---|---|---|---|---|---|---|---|
| 3903 Dominion Townes Cir Unit 1 Richmond, VA | 3.0 | 2.5 | 1936 | $3,100 | $1.60 | 2d | 1 | 0.04mi |
| 3231 Hunters Mill Dr Richmond, VA | 2.0 | 1.5 | 1064 | $1,550 | $1.46 | 24d | 1 | 0.80mi |
| 3221 Hunters Mill Dr Richmond, VA | 3.0 | 2.0 | 1254 | $1,750 | $1.40 | 3d | 1 | 0.82mi |
| 3217 Hunters Mill Dr Richmond, VA | 3.0 | 1.5 | 1178 | $1,975 | $1.68 | 44d | 1 | 0.82mi |
| 315 Natchez Rd Richmond, VA | 3.0 | 1.5 | 1176 | $1,995 | $1.70 | 24d | 1 | 0.83mi |
| 210 Natchez Rd Richmond, VA | 3.0 | 1.0 | 1080 | $1,850 | $1.71 | 3d | 1 | 0.95mi |
| 2213 Capp Rd Richmond, VA | 3.0 | 2.0 | 1572 | $2,200 | $1.40 | 17d | 1 | 1.10mi |
| 3411 Oxnard Rd Richmond, VA | 3.0 | 1.0 | 1083 | $1,795 | $1.66 | 17d | 1 | 1.27mi |
HOA detail
- Monthly dues
- $140 · $1,680/yr
Listing history 10 events
-
2026-05-18status Pending
-
2026-05-17status Active
-
2026-05-10status Pending
-
2026-05-08$299,993 Active
-
2026-02-23historical $2,495
-
2026-02-18price $2,495
-
2026-01-31$2,496
-
2024-12-22historical $2,295
-
2024-11-10$2,295
-
2017-10-03soldstatus $132,500
ⓘ Source: listings_history table (triggers on properties + properties_extension) + one-shot
backfill from property_details.listing_events for pre-trigger history.
Tax reassessment forecast VA · Resets to sale price
- Current annual tax
- $2,403 · $200/mo
- Projected year-2 tax
- $2,460 · $205/mo
- Expected delta
- +$57/yr (+$5/mo · 2.4%)
ⓘ Screening estimate from a state-policy table — verify with the county assessor before closing.
Climate risk First Street
- Flood 1/10 Low FEMA zone X (unshaded) · 0% chance over 30 yrs
- Wildfire 3/10 Moderate
- Heat 7/10 Severe 7 d/yr ≥106°F today · 16 d/yr by 30 yrs out
- Wind 6/10 Major 27% chance of damaging wind over 30 yrs
- Air quality 2/10 Low 1 unhealthy d/yr today · 3 by 30 yrs out
Nearby sold comps map
Loading sold comps map…
Walkable amenities ~0.75 mi
Loading nearby amenities…
Taxation est. · year 1
- Rental income
- $28,662
- − Mortgage interest
- −$16,804
- − Property taxes
- −$2,403
- − Insurance
- −$1,500
- − Repairs & maintenance
- −$2,293
- − Management
- −$2,293
- − HOA
- −$1,680
- − Depreciation
- −$8,727
- Taxable loss
- −$7,038
- Est. tax savings @ 24.0%
- +$1,689
- After-tax cash flow
- $-129/yr
For passive investors: Depreciation is non-cash, so a rental often shows a tax loss while cash-flowing — sheltering income. Rental losses are passive: they offset passive income freely, and up to $25,000/yr can offset ordinary (W-2) income if you actively participate and your MAGI is under $100k (phasing out to $0 by $150k); unused losses carry forward. On sale, claimed depreciation is recaptured at up to 25%, and gains may owe capital-gains tax (a 1031 exchange can defer both). Figures are a year-1 estimate at your 24.0% rate — not tax advice; consult a CPA.
Schools (NCES district)
- District
- Henrico County Public School District
- NCES district ID
- 5101890
- Math proficiency
- 49% ▼ -32.00%
- Reading proficiency
- 64% ▼ -12.00%
- Median HH income
- $61,854
- Composite
- 49.25/100
- National rank
- #2031
- State rank
- #68 of 131 in VA
Livability — East Highland Park
- Score
- 72/100
- State rank
- #197
- US rank
- #6099
Category grades
Schools grade is shown separately in the Schools card above.
Census & demographics
- County
- Henrico County · 334,490 people
- Metro
- Richmond, VA
- Population (ZIP)
- 54,659
- Household income
- $55,731
- Rent vs Own
- Severe rent burden
- 3530.0
Population outlook (Henrico County) Hauer SSP2
- Today (2025)
- 365,885 people
- By 2030
- 384,255 · +5.0%
- By 2040
- 416,688 · +13.9%
- By 2050
- 442,376 · +20.9%
- By 2075
- 488,037 · +33.4%
- By 2100
- 487,430 · +33.2%
Race, ethnicity, and origin ACS 2023
- Neighborhood character
- Predominantly Black (71%)
- Race & ethnicity
- Black 71% White 19% Two or more races 5% Hispanic / Latino 5%
- Common ancestry
- Romanian 1% Lithuanian 1% Slovak 1%
- Foreign-born
- 4% · Canada
- Languages at home
- 93% English-only · Spanish 4% French/Haitian/Cajun 1% Other Indo-European 1%
Political lean MEDSL · Henrico
- 2024 margin
- Strong D (+28.9) · D 63.7% · R 34.8% · Other 1.5%
- 2008→2024 swing
- +16.6pp toward D · 2008: 12.2pp · 2024: 28.9pp
- All cycles
- 2024: D+28.9 2020: D+29.0 2016: D+21.0 2012: D+11.7 2008: D+12.2
Not yet ingested
- Civics
- —
Market trends
- HPI YoY
- ▼ -257.81%
- Current HPI
- 324.0589
- Rent YoY
- ▲ 6.38%
- Metro
- Richmond, VA
- State GDP YoY
- ▲ 2.40%
- F500 in state
- 50
Industry mix (Fortune 500 HQ in VA)
| Industry | F500 HQs | Revenue |
|---|---|---|
| Aerospace / Defense | 4 | $236B |
|
||
| Technology / Defense | 3 | $32B |
|
||
| Financial Services | 2 | $176B |
|
||
| Utilities | 2 | $27B |
|
||
| Insurance | 2 | $25B |
|
||
| Technology | 2 | $15B |
|
||
Price history
+126.4% since first listed10 events — show timeline
- 2026-05-18 Pending — CVRMLS
- 2026-05-17 Relisted — CVRMLS
- 2026-05-10 Pending — CVRMLS
- 2026-05-08 Listed $299,993 CVRMLS
- 2026-02-23 Rental Removed $2,495 APPFOLIO
- 2026-02-18 Price Changed $2,495 APPFOLIO
- 2026-01-31 Listed for Rent $2,496 APPFOLIO
- 2024-12-22 Rental Removed $2,295 APPFOLIO
- 2024-11-10 Listed for Rent $2,295 APPFOLIO
- 2017-10-03 Sold (Public Records) $132,500 Public Records
Property tax history
+6.0%/yrLatest (2025): $2,403 · +11.3% YoY. Source: county tax records.
Cash-flow waterfall
monthlySold comps — $/sqft
last 12 mo · ≤1 miLoading sold comps…