 🌊 Lakefront
4935 Largo Ter · New Port Richey, FL
Flood risk 10/10 · Severe
- FEMA flood zone
- AE
- Chance of flooding over 30 yrs
- 0.99%
- Est. flood insurance / yr
- $1,737 – $8,500
Fire risk 1/10 · Minimal
- Est. fire insurance / yr
- $947 – $1,759
Heat risk 10/10 · Severe
- Hot days now (above 109°F)
- 7 days/yr
- Hot days in 30 yrs
- 27 days/yr
Wind risk 10/10 · Severe
- Chance of severe wind over 30 yrs
- 99.0%
Air-quality risk 2/10 · Minimal
- Unhealthy air days now
- 1 days/yr
- Unhealthy air days in 30 yrs
- 3 days/yr
Risk factors via First Street. Map © Google.
Why this score? — see what drove the B grade
The composite is a weighted blend of 9 inputs, each scored 0–100. Each bar is that input's sub-score; the figure is the points it added to the 100-point composite (weight × sub-score).
- Cash flow +30.0/30.0
- 1% rule +10.0/10.0
- DSCR +10.0/10.0
- ARV discount +7.5/15.0
- Schools +4.3/10.0
- Livability +4.1/5.0
- Rent growth +2.7/5.0
- Condition / age +2.5/5.0
- Appreciation +0.0/10.0
$96,000
🖨 Deal sheet (PDF) 📄 Offer letter ✓ Due diligence
Listing remarks
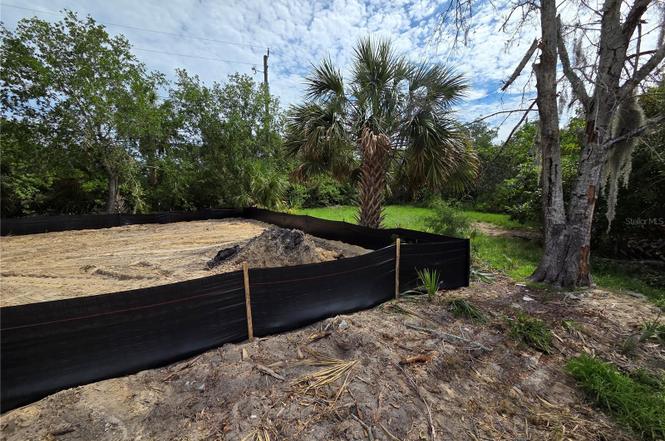
Under contract-accepting backup offers. Investor alert! This rare portfolio includes 3 parcels totaling 1.37 acres in a prime location offering endless potential for builders ready to take advantage of the R4 zoning. Offering a great opportunity for redevelopment in a desirable location. Whether you're planning a new build or an investment project, this lot provides a clean slate. Think of the possibilities: Rebuild and maximize the waterfront views of the Bayou. Develop across all three parcels for a larger project. It’s priced with that in mind and represents a unique opportunity for those with vision. The layout is functional, the land is spacious, and the waterfront setting adds
Key facts
- Just over an acre
- Waterfront view
- Waterfront home
Tags
Property features AI
Finance
- Other: Total acreage between 1 and less than 2 acres (1.37 acres reported across 3 lots); Paved road access; Living area reported as 912 sq ft (public records); building area reported as 1,504 sq ft; Universal property ID on file
- Financial info: No lease restrictions noted
- HOA & community: No association indicated
Exterior
- Parking: Attached garage (1 garage space)
- Utilities: Public water; Public sewer; Cable available
- Home design: Single family residence; Residential property; One story; Faces south; Has additional parcels; Zoned R4
- Construction: Block construction; Shingle roof; Slab foundation; Built on one level
- Exterior features: Other exterior features; On waterfront (Bayou) with water view and water access
Interior
- Kitchen: Other appliances
- Bedrooms: 2 bedrooms
- Flooring: Other flooring
- Bathrooms: 1 full bathroom
- Heating & cooling: No heating; No cooling
- Interior features: Other interior features
- Laundry & utility: Other laundry features
Neighborhood map
What this means for you Summary
Snapshot
- This is a 2-bed/1.0-bath single-family listed at $96k.
Deal economics
- At list price, monthly cash flow is $35 ($422/yr) — positive.
- The deal already cash-flows at list — no discount required.
- Meets the 1% rule at list price ($1k rent vs $96k).
- Recommended offer: $84k (12.0% below list) — sets the bar for market timing.
- Cap rate 12.1% vs local median 1.9% in New Port Richey — top-decile yield for the area; either an underpriced asset or a hidden risk that comps aren't pricing in. Stress-test before assuming the spread holds.
Location & tenants
- Location reads 82/100 on livability (#67 in FL, #1,139 nationally) — a professional / high-income tenant draw. Strengths: amenities A+, cost of living A+, housing A+; Watch: crime C-, commute D, employment F.
- Pasco (suburban): math 50% / reading 52% proficiency, ranked #32 of 73 in FL (top 44%) — acceptable for families but not a draw, mixed tenant base, ~2y average lease.
- Zoned schools: Richey Elementary School (math 34% / reading 39%, grade F, #1,656 of 2,144 statewide, top 78%, 650 students, 89% FRL); Gulf Middle School (math 34% / reading 33%, grade F, #428 of 571 statewide, top 76%, 901 students, 83% FRL); Gulf High School (math 32% / reading 34%, grade F, #406 of 667 statewide, top 61%, 1,465 students, 76% FRL) — zoned schools average 83% FRL vs 48% district-wide (34 pts higher); higher-poverty schools than district average — tighter screening recommended.
- Zoned-school proficiency averages 34% at this address vs 51% district-wide (-17 pts) — the specific schools serving this property underperform the Pasco average; the district grade overstates school quality for this exact location.
- Market conditions: Rents flat; 644 active listings in the ZIP; 40 comparable units currently listed for rent nearby; rentals at typical pace (median 22d on market — plan ~3-4 weeks tenant-placement turnaround); 6,765 units permitted in Pasco County in 2024 (1,250 in 5+ unit buildings).
- This rent runs 32% of the median local income ($57k/yr) — at the standard rent-burdened threshold; future hikes will face affordability resistance.
Forward outlook
- Local home prices are declining (-3.0%/yr); year-one equity from $664 of loan paydown is wiped out by about $3k of value loss. Plan a longer hold.
- Pasco County population projected at +29% by 2050 — long-run rental-demand tailwind backs the buy-and-hold thesis.
Negotiation context
- It's been on market 195 days — a 12% lower offer ($84k) is reasonable based on typical stale-listing flexibility.
- 2 sale attempts; this cycle's ask has dropped $67k (41%) from the opening price — seller is motivated, your offer sets the floor, not the list.
Risks & watch-outs
- Watch-outs: flood insurance adds $427/mo.
- Climate carrying-cost: in FEMA flood zone AE (mandatory federal flood insurance); severe wind risk, 99% chance of damaging wind over 30y; extreme-heat days projected 7→27/yr by 2055 (HVAC capex compounding) — expect insurance premiums to compound above CPI over the hold.
Questions for the listing agent
- It's been on market 195 days. Have you received any prior offers? Is the seller open to a 12% concession, seller financing, or rate buy-down credit?
- Built in 1963 — when were the roof, HVAC, electrical panel, plumbing, and water heater last replaced?
- What's the actual annual flood-insurance premium (NFIP or private), and is the property in a SFHA with mandatory coverage?
- Why hasn't it sold? Are there any deal-killer items the seller is aware of (foundation, flood, title, zoning, code violations)?
- Is there a deadline driving the sale (1031 exchange, divorce, estate, relocation)? That informs how much negotiation room exists.
- This sits on a lake — are riparian / water-frontage rights deeded with the parcel? Any dock permits, shoreline easements, or HOA water-use restrictions?
- What's the documented flood / surge / shoreline-erosion history here (FEMA AND non-FEMA — e.g., storm surge, creek backup, septic-field saturation)?
- Any water-quality or seasonal algae-bloom issues that affect tenant satisfaction or short-term-rental demand?
- What's the average days-on-market for RENTAL listings here right now (not sales)? A rising rental-DOM trend means longer vacancies and softer asking-rent achievability than the comps imply.
- What's the recent tenant-quality profile in this submarket — average credit score on applications, eviction rate, late-payment / NSF rate, and stable-employment percentage? A property-management company in the area should have these aggregated.
- How much new for-sale + rental construction is in the pipeline within 1–3 miles? Heavy new supply typically softens prices + rents 12–24 months out; constrained supply supports both.
Investment metrics
- 1% rule
- 1.56% ✓
- Cap rate
- 12.06%
- Cash-on-cash
- 20.61%
- DSCR
- 1.92
- GRM
- 5.3
CMA / ARV
- ARV (on-the-fly)
- $200,686
- Comps found
- 12
Show comp detail 12 sales within ~0.75 mi
| Address | Dist | Beds/Ba | Sqft | Sold | Price | $/sf | Match |
|---|---|---|---|---|---|---|---|
| 7202 Oelsner St | 0.40mi | 2/1.0 | 912 (0%) | 2mo | $176,800 | $194 | 80 |
| 6634 Del Prado Ter | 0.10mi | 2/1.0 | 992 (+9%) | 8mo | $100,000 | $101 | 75 |
| 7214 Oakwood Dr | 0.42mi | 2/2.0 | 920 (+1%) | 4mo | $185,000 | $201 | 71 |
| 6608 Manor Beach Rd | 0.15mi | 2/1.0 | 800 (-12%) | 2mo | $105,000 | $131 | 71 |
| 7208 Oelsner St | 0.41mi | 2/1.0 | 860 (-6%) | 4mo | $119,900 | $139 | 68 |
| 7138 Oakwood Dr | 0.37mi | 3/1.0 (+1) | 868 (-5%) | 2mo | $98,000 | $113 | 68 |
| 7320 Oelsner St | 0.53mi | 2/1.0 | 936 (+3%) | 4mo | $196,000 | $209 | 68 |
| 5333 Dartmouth Rd | 0.48mi | 2/1.0 | 864 (-5%) | 5mo | $280,000 | $324 | 65 |
| 7340 Royal Palm Dr | 0.55mi | 2/1.0 | 887 (-3%) | 6mo | $90,000 | $101 | 65 |
| 7207 Wedgewood Dr | 0.44mi | 2/1.0 | 990 (+9%) | 2mo | $240,000 | $242 | 63 |
| 7311 Oelsner St | 0.51mi | 3/2.0 (+1) | 876 (-4%) | 2mo | $115,000 | $131 | 59 |
| 7132 Oelsner St | 0.35mi | 3/1.0 (+1) | 1,019 (+12%) | 4mo | $166,000 | $163 | 56 |
Match score weights: distance 35% · size 25% · config 20% · recency 20%. Top-matched comps best support the ARV.
Projected returns pro-forma
-3.0% appreciation · 0.72% rent growth · sell at horizon
- IRR
- -17.9%
- Equity multiple
- 0.39×
- Total profit
- $-16,359
- Equity at exit
- $14,314
- IRR
- -19.6%
- Equity multiple
- 0.14×
- Total profit
- $-23,240
- Equity at exit
- $8,300
Cash invested: $26,880 (down + closing). Projections, not guarantees.
Landlord ↔ Tenant lean methodology
- Overall (STATE)
- 87 Strongly Landlord-Friendly
- State Florida
- 87 Strongly Landlord-Friendly · R+3
- County
- — inherits STATE
- City
- — inherits STATE
ZIP-level market 34652
- Home prices YoY
- -26.1%
- Rents YoY
- 0.7%
- Active inventory
- 644
- Price-to-rent
- 5.3×
Monthly cashflow live
- Estimated rent
- $1,499 high interval (Pro) →
- Mortgage (P&I)
- −$503
- Tax from tax record
- −$179 /mo · $2,149/yr
- Insurance
- −$40
- Flood insurance flood zone
- −$427 /mo · $5,118/yr
- HOA
- −$0
- Vacancy / Maint / Mgmt
- −$315
- Net cashflow
- $35
Break-even live
Sensitivity live
| Price | -10% $89 | -5% $62 | +0% $35 | +5% $8 | +10% $-19 |
|---|---|---|---|---|---|
| Rent | -10% $-83 | -5% $-24 | +0% $35 | +5% $94 | +10% $154 |
| Rate | -1.0pp $83 | -0.5pp $60 | base $35 | +0.5pp $10 | +1.0pp $-15 |
UW: 25.0% down · 7.5% · 30yr · 1.5% tax · 5.0% vac · 8.0% maint · 8.0% mgmt
Financing live
Cash to close
- Down payment
- $24,000
- Closing costs
- $2,880
- Reserves months
- —
- Total cash needed
- —
Loan-product check · same deal, 3 products live
Conventional
25% down · 7.5% · 30yr
- Down + closing
- —
- Monthly P&I
- —
- Monthly cashflow
- —
- DSCR
- —
- Eligible?
- —
Personal DTI + credit; lowest rate.
DSCR
20% down · 8.5% · 30yr
- Down + closing
- —
- Monthly P&I
- —
- Monthly cashflow
- —
- DSCR
- —
- Eligible?
- —
No personal income docs; deal must DSCR.
Hard money
10% down · 12.0% · 12mo
- Down + closing
- —
- Monthly P&I
- —
- Monthly cashflow
- —
- DSCR
- —
- Eligible?
- —
Short-term bridge; refi at stabilization.
Rent comps 40 comps
| Address | Beds | Baths | Sqft | Rent | $/sqft | DOM | Units | Dist |
|---|---|---|---|---|---|---|---|---|
| 6640 Del Prado Ter New Port Richey, FL | 3.0 | 1.0 | 912 | $1,450 | $1.59 | 26d | 1 | 0.10mi |
| 7023 Oakwood Dr New Port Richey, FL | 3.0 | 2.0 | 1032 | $1,800 | $1.74 | 22d | 1 | 0.24mi |
| 7133 Pinewood Dr New Port Richey, FL | 2.0 | 1.0 | 1000 | $1,350 | $1.35 | 6d | 1 | 0.36mi |
| 5335 Palmetto Rd New Port Richey, FL | 2.0 | 1.0 | 800 | $1,475 | $1.84 | 26d | 1 | 0.42mi |
| 7013 Green St New Port Richey, FL | 3.0 | 2.0 | 1104 | $1,500 | $1.36 | 3d | 1 | 0.45mi |
| 6931 Julia Ct New Port Richey, FL | 1.0–2.0 | 1.0 | 800 | $1,495 | $1.87 | 4d | 4 | 0.46mi |
| 6916 Julia Ct Unit 6916 Port Richey, FL | 1.0 | 1.0 | 700 | $1,050 | $1.50 | 23d | 1 | 0.47mi |
| 7124 Green St New Port Richey, FL | 2.0 | 1.0 | 1000 | $1,195 | $1.20 | 3d | 1 | 0.54mi |
| 5321 Avery Rd Unit 1 New Port Richey, FL | 2.0 | 1.0 | 720 | $1,150 | $1.60 | 4d | 1 | 0.57mi |
| 7353 Royal Palm Dr New Port Richey, FL | 3.0 | 2.0 | 1048 | $1,550 | $1.48 | 26d | 1 | 0.57mi |
| 5500 Main St New Port Richey, FL | 2.0 | 2.0 | 1231 | $1,733 | $1.41 | 4d | 6 | 0.63mi |
| 5852 Sea Forest Dr Port Richey, FL | 2.0 | 1.0 | 875 | $1,161 | $1.33 | 26d | 1 | 0.76mi |
| 6921 Washington St Unit 3Apt 3 Port Richey, FL | 2.0 | 1.0 | 750 | $1,269 | $1.69 | 22d | 1 | 0.76mi |
| 5800 Virginia Ave New Port Richey, FL | 2.0 | 1.0 | 900 | $1,495 | $1.66 | 22d | 1 | 0.82mi |
| 5800 Virginia Ave New Port Richey, FL | 2.0 | 1.0 | 900 | $1,550 | $1.72 | 14d | 1 | 0.82mi |
| 6332 Grand Blvd Port Richey, FL | 2.0 | 2.0 | 894 | $1,962 | $2.20 | 0d | 3 | 0.84mi |
| 7026 Washington St New Port Richey, FL | 1.0 | 1.0 | 600 | $1,150 | $1.92 | 5d | 1 | 0.85mi |
| 7026 Washington St New Port Richey, FL | 1.0 | 1.0 | 600 | $1,000 | $1.67 | 19d | 1 | 0.85mi |
| 7018 Washington St New Port Richey, FL | 2.0 | 1.0 | 700 | $1,200 | $1.71 | 0d | 1 | 0.85mi |
| 5847 Nebraska Ave New Port Richey, FL | 1.0 | 1.0 | 900 | $1,350 | $1.50 | 26d | 1 | 0.98mi |
| 5805 Delaware Ave New Port Richey, FL | 2.0 | 1.0 | 700 | $1,250 | $1.79 | 26d | 1 | 1.02mi |
| 5567 Sea Forest Dr New Port Richey, FL | 2.0–3.0 | 2.0–3.0 | 1335 | $1,795 | $1.34 | 14d | 2 | 1.09mi |
| 5634 Charles St New Port Richey, FL | 3.0 | 1.5 | 960 | $1,700 | $1.77 | 26d | 1 | 1.09mi |
| 4823 Ebbtide Ln Port Richey, FL | 2.0 | 2.0 | 1098 | $1,800 | $1.64 | 5d | 1 | 1.12mi |
| 4823 Ebbtide Ln #301 Port Richey, FL | 2.0 | 2.0 | 1098 | $2,200 | $2.00 | 26d | 1 | 1.12mi |
| 5741 Tennessee Ave New Port Richey, FL | 1.0 | 1.0 | 700 | $1,200 | $1.71 | 26d | 1 | 1.13mi |
| 7731 Chapel Ave Port Richey, FL | 2.0 | 1.0 | 828 | $1,250 | $1.51 | 26d | 1 | 1.15mi |
| 6120 Indiana Ave New Port Richey, FL | 2.0 | 1.0 | 676 | $1,299 | $1.92 | 5d | 1 | 1.16mi |
| 7730 Washington St Port Richey, FL | 2.0 | 1.0 | 840 | $1,575 | $1.88 | 16d | 1 | 1.21mi |
| 7730 Washington St Port Richey, FL | 3.0 | 1.0 | 1040 | $1,575 | $1.51 | 26d | 1 | 1.21mi |
| 5529 La Salle Ct New Port Richey, FL | 2.0 | 1.0 | 850 | $1,250 | $1.47 | 0d | 1 | 1.25mi |
| 5809 Dailey Ln New Port Richey, FL | 2.0 | 1.0 | 950 | $1,000 | $1.05 | 26d | 1 | 1.28mi |
| 6029 Wyoming Ave New Port Richey, FL | 2.0 | 1.0 | 792 | $1,850 | $2.34 | 26d | 1 | 1.29mi |
| 4948 Getner St New Port Richey, FL | 2.0 | 1.0 | 722 | $1,350 | $1.87 | 26d | 1 | 1.30mi |
| 5543 Gulf Dr New Port Richey, FL | 2.0 | 1.0 | 744 | $1,550 | $2.08 | 18d | 1 | 1.31mi |
| 4922 Filner St New Port Richey, FL | 1.0 | 1.0 | 540 | $1,000 | $1.85 | 23d | 1 | 1.32mi |
| 5640 Ferguson Ct #2101 New Port Richey, FL | 2.0 | 2.0 | 1056 | $1,650 | $1.56 | 26d | 1 | 1.33mi |
| 5648 Townhouse Dr New Port Richey, FL | 2.0 | 1.5 | 900 | $1,495 | $1.66 | 26d | 1 | 1.34mi |
| 4944 Elkner St New Port Richey, FL | 2.0 | 1.0 | 722 | $1,350 | $1.87 | 23d | 1 | 1.35mi |
| 4533 Marine Pkwy #101 New Port Richey, FL | 2.0 | 2.0 | 1066 | $1,795 | $1.68 | 19d | 1 | 1.39mi |
Listing history 6 events
-
2026-05-21status Pending
-
2026-03-17status Active
-
2026-03-14status Pending
-
2026-03-07price $96,000
-
2026-01-05price $154,000
-
2025-11-04$163,000 Active
ⓘ Source: listings_history table (triggers on properties + properties_extension) + one-shot
backfill from property_details.listing_events for pre-trigger history.
Tax reassessment forecast FL · Resets to sale price
- Current annual tax
- $2,149 · $179/mo
- Projected year-2 tax
- $2,149 · $179/mo
- Expected delta
- $0/yr ($0/mo · 0.0%)
ⓘ Screening estimate from a state-policy table — verify with the county assessor before closing.
Climate risk First Street
- Flood 10/10 Extreme FEMA zone AE · 99% chance over 30 yrs
- Wildfire 1/10 Low
- Heat 10/10 Extreme 7 d/yr ≥109°F today · 27 d/yr by 30 yrs out
- Wind 10/10 Extreme 99% chance of damaging wind over 30 yrs
- Air quality 2/10 Low 1 unhealthy d/yr today · 3 by 30 yrs out
Nearby sold comps map
Loading sold comps map…
Walkable amenities ~0.75 mi
Loading nearby amenities…
Taxation est. · year 1
- Rental income
- $17,988
- − Mortgage interest
- −$5,377
- − Property taxes
- −$2,149
- − Insurance
- −$5,598
- − Repairs & maintenance
- −$1,439
- − Management
- −$1,439
- − Depreciation
- −$2,793
- Taxable loss
- −$808
- Est. tax savings @ 24.0%
- +$194
- After-tax cash flow
- $616/yr
For passive investors: Depreciation is non-cash, so a rental often shows a tax loss while cash-flowing — sheltering income. Rental losses are passive: they offset passive income freely, and up to $25,000/yr can offset ordinary (W-2) income if you actively participate and your MAGI is under $100k (phasing out to $0 by $150k); unused losses carry forward. On sale, claimed depreciation is recaptured at up to 25%, and gains may owe capital-gains tax (a 1031 exchange can defer both). Figures are a year-1 estimate at your 24.0% rate — not tax advice; consult a CPA.
Schools (NCES district)
- District
- Pasco
- NCES district ID
- 1201530
- Math proficiency
- 50% ▼ -10.00%
- Reading proficiency
- 52% ▼ -5.00%
- Median HH income
- $45,039
- Composite
- 43.14/100
- National rank
- #3074
- State rank
- #32 of 73 in FL
Livability — New Port Richey
- Score
- 82/100
- State rank
- #67
- US rank
- #1139
Category grades
Schools grade is shown separately in the Schools card above.
Census & demographics
- County
- Pasco County · 524,098 people
- City population
- 137,708
- Metro
- Tampa-St. Petersburg-Clearwater, FL
- Population (ZIP)
- 27,444
- Household income
- $56,931
- Rent vs Own
- Severe rent burden
- 1190.0
Population outlook (Pasco County) Hauer SSP2
- Today (2025)
- 570,045 people
- By 2030
- 605,844 · +6.3%
- By 2040
- 674,806 · +18.4%
- By 2050
- 736,022 · +29.1%
- By 2075
- 862,900 · +51.4%
- By 2100
- 906,364 · +59.0%
Race, ethnicity, and origin ACS 2023
- Neighborhood character
- Predominantly White (78%)
- Race & ethnicity
- White 78% Hispanic / Latino 13% Two or more races 9% Black 4%
- Hispanic origin (detail)
- Mexican 3% Puerto Rican 4% Cuban 4%
- Common ancestry
- Romanian 4% Lithuanian 3% Slovak 2%
- Foreign-born
- 9% · Canada
- Languages at home
- 87% English-only · Spanish 9% Other Indo-European 1% Russian/Polish/Slavic 1%
Political lean MEDSL · Pasco
- 2024 margin
- Strong R (+25.2) · D 36.9% · R 62.1% · Other 1.0%
- 2008→2024 swing
- -21.6pp toward R · 2008: -3.6pp · 2024: -25.2pp
- All cycles
- 2024: R+25.2 2020: R+20.1 2016: R+21.6 2012: R+6.7 2008: R+3.6
Not yet ingested
- Civics
- —
Market trends
- HPI YoY
- ▼ -109.49%
- Current HPI
- 310.8347
- Rent YoY
- ▲ 0.72%
- Metro
- Tampa-St. Petersburg-Clearwater, FL
- State GDP YoY
- ▲ 3.28%
- F500 in state
- 36
Industry mix (Fortune 500 HQ in FL)
| Industry | F500 HQs | Revenue |
|---|---|---|
| Industrial Technology | 2 | $29B |
|
||
| Insurance | 2 | $17B |
|
||
| Retail | 1 | $60B |
|
||
| Technology Distribution | 1 | $58B |
|
||
| Homebuilding | 1 | $35B |
|
||
| Technology Manufacturing | 1 | $35B |
|
||
Price history
-41.1% since first listed6 events — show timeline
- 2026-05-21 Pending — Stellar MLS as Distributed by MLS Grid
- 2026-03-17 Relisted — Stellar MLS as Distributed by MLS Grid
- 2026-03-14 Pending — Stellar MLS as Distributed by MLS Grid
- 2026-03-07 Price Changed $96,000 Stellar MLS as Distributed by MLS Grid
- 2026-01-05 Price Changed $154,000 Stellar MLS as Distributed by MLS Grid
- 2025-11-04 Listed $163,000 Stellar MLS as Distributed by MLS Grid
Property tax history
+5.3%/yrLatest (2025): $2,149 · +3.5% YoY. Source: county tax records.
Cash-flow waterfall
monthlySold comps — $/sqft
last 12 mo · ≤1 miLoading sold comps…