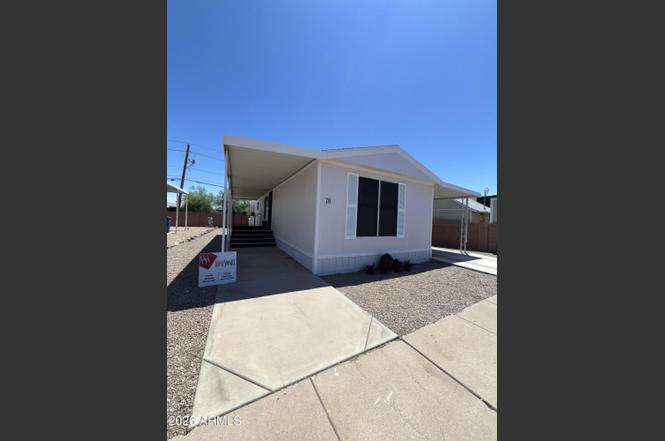
2105 E Villa Maria Dr #78 · Phoenix, AZ
Flood risk 1/10 · Minimal
- FEMA flood zone
- X (shaded)
- Chance of flooding over 30 yrs
- 0.0%
- Est. flood insurance / yr
- $507 – $1,088
Fire risk 4/10 · Minor
- Est. fire insurance / yr
- $610 – $1,132
Heat risk 8/10 · Major
- Hot days now (above 110°F)
- 7 days/yr
- Hot days in 30 yrs
- 17 days/yr
Wind risk 1/10 · Minimal
- Chance of severe wind over 30 yrs
- —
Air-quality risk 3/10 · Minor
- Unhealthy air days now
- 3 days/yr
- Unhealthy air days in 30 yrs
- 5 days/yr
Risk factors via First Street. Map © Google.
Why this score? — see what drove the B+ grade
The composite is a weighted blend of 9 inputs, each scored 0–100. Each bar is that input's sub-score; the figure is the points it added to the 100-point composite (weight × sub-score).
- Cash flow +30.0/30.0
- ARV discount +14.0/15.0
- 1% rule +10.0/10.0
- DSCR +10.0/10.0
- Condition / age +4.0/5.0
- Schools +3.8/10.0
- Livability +3.8/5.0
- Rent growth +2.2/5.0
- Appreciation +0.0/10.0
$94,800
🖨 Deal sheet 📄 Offer letter ✓ Due diligence
Listing remarks
Beautifully updated 3-bedroom, 2-bath home in one of the area's most sought-after family communities. Residents enjoy a community pool, playground, basketball court, dog park, and exceptionally maintained grounds. Recent updates include NEW exterior paint (2026), roof (2023), luxury vinyl plank flooring throughout (2023), and remodeled bathrooms (2024). The split floor plan offers privacy, with a spacious primary suite featuring a large tiled walk-in shower and private water closet. Two secondary bedrooms share an updated Jack-and-Jill bath with new tub and surround. Enjoy two large, covered decks, a fenced yard, ADA-height toilets, professionally cleaned air ducts and vents. Move-in ready
Key facts
- Dog park
- Exterior paint
- Community pool
Tags
Property features AI
Finance
- Other: Lot size recorded from assessor; Lot features include gravel/stone front and back
- HOA & community: Land lease community (monthly land lease fee); Monthly land lease: $790; Association covers grounds maintenance, street maintenance, and trash; Community amenities include a pool, playground, and biking/walking path
Exterior
- Parking: 3 covered parking spaces; 3 open parking spaces; 3-car carport
- Utilities: City water; Public sewer (connected)
- Home design: Manufactured/mobile home; Leasehold ownership
- Construction: Wood frame construction; Painted exterior; Composition roofing
- Exterior features: Private yard; Playground on the property; Front and back areas with gravel/stone; Asphalt road access
Interior
- Kitchen: Non-laminate countertops; Refrigerator; Dishwasher; Eat-in kitchen layout
- Bedrooms: Up to 3 bedrooms (master on main level)
- Flooring: Vinyl flooring
- Bathrooms: 2 full bathrooms
- Heating & cooling: Electric heating; Central air conditioning; Ceiling fans
- Interior features: High-speed internet available; Master bedroom located on the ground floor; Eat-in kitchen; No interior steps (single-level living); Vaulted ceilings; Master bath with 3/4 bath (shower, no tub); Solar screens on windows; Dual-pane windows; Bath with raised toilet (accessibility feature); Hard/low nap flooring (accessibility feature)
- Laundry & utility: Laundry inside the home
Neighborhood map
What this means for you Summary
Snapshot
- This is a 3-bed/2.0-bath manufactured listed at $95k. Condition is rated good.
Deal economics
- At list price, monthly cash flow is $919 ($11k/yr) — positive.
- The deal already cash-flows at list — no discount required.
- Meets the 1% rule at list price ($2k rent vs $95k).
- Cap rate 17.9% vs local median 3.3% in Phoenix — top-decile yield for the area; either an underpriced asset or a hidden risk that comps aren't pricing in. Stress-test before assuming the spread holds.
Location & tenants
- Location reads 75/100 on livability (#16 in AZ, #3,924 nationally) — a middle-class / working-renter tenant base. Strengths: amenities A+, commute A+, housing A+; Watch: health & safety C-, crime F.
- Paradise Valley Unified District (4241) (urban): math 39% / reading 46% proficiency, ranked #56 of 249 in AZ (top 22%) — families likely to look elsewhere, expect single-tenant / working-renter base with shorter leases.
- Zoned schools: Echo Mountain Primary School (math 22% / reading 22%, grade F, #687 of 1,109 statewide, top 65%, 530 students, 74% FRL); Vista Verde Middle School (math 13% / reading 26%, grade F, #134 of 218 statewide, top 63%, 544 students, 71% FRL); North Canyon High School (math 13% / reading 23%, grade F, #242 of 381 statewide, top 64%, 1,842 students, 55% FRL) — zoned schools average 66% FRL vs 29% district-wide (37 pts higher); higher-poverty schools than district average — tighter screening recommended.
- Zoned-school proficiency averages 20% at this address vs 42% district-wide (-23 pts) — the specific schools serving this property underperform the Paradise Valley Unified District (4241) average; the district grade overstates school quality for this exact location.
- Market conditions: Rents soft (-1.2%/yr); 282 active listings in the ZIP; 40 comparable units currently listed for rent nearby; rentals leasing fast (median 8d on market — plan ~1-2 weeks tenant-placement turnaround); 36,011 units permitted in Maricopa County in 2024 (12,801 in 5+ unit buildings).
- This rent runs 34% of the median local income ($70k/yr) — at the standard rent-burdened threshold; future hikes will face affordability resistance.
Forward outlook
- Local home prices are declining (-3.0%/yr); year-one equity from $655 of loan paydown is wiped out by about $3k of value loss. Plan a longer hold.
- Maricopa County population projected at +38% by 2050 — long-run rental-demand tailwind backs the buy-and-hold thesis.
- At projected returns (-3.0% appreciation + 0.0% rent growth), your $27k cash investment doubles in ~3 years — after that, you're playing with house money.
Negotiation context
- Only 4 days on market — expect competitive offers; lowballing is unlikely to land.
Risks & watch-outs
- Climate carrying-cost: extreme-heat days projected 7→17/yr by 2055 (HVAC capex compounding) — expect insurance premiums to compound above CPI over the hold.
Questions for the listing agent
- Is there a deadline driving the sale (1031 exchange, divorce, estate, relocation)? That informs how much negotiation room exists.
- Crime grade is F in this area — have there been break-ins, vandalism, or insurance claims at this property in the last 3 years? What carrier currently insures it and at what premium?
- What's the average days-on-market for RENTAL listings here right now (not sales)? A rising rental-DOM trend means longer vacancies and softer asking-rent achievability than the comps imply.
- What's the recent tenant-quality profile in this submarket — average credit score on applications, eviction rate, late-payment / NSF rate, and stable-employment percentage? A property-management company in the area should have these aggregated.
- How much new for-sale + rental construction is in the pipeline within 1–3 miles? Heavy new supply typically softens prices + rents 12–24 months out; constrained supply supports both.
Investment metrics
- 1% rule
- 2.10% ✓
- Cap rate
- 17.93%
- Cash-on-cash
- 41.57%
- DSCR
- 2.85
- GRM
- 4.0
CMA / ARV
- ARV (on-the-fly)
- $110,880
- Comps found
- 12
Show comp detail 12 sales within ~0.75 mi
| Address | Dist | Beds/Ba | Sqft | Sold | Price | $/sf | Match |
|---|---|---|---|---|---|---|---|
| 2140 E Michigan Ave #35 | 0.06mi | 3/2.0 | 990 (-12%) | 1mo | $98,000 | $99 | 77 |
| 2034 E Charleston Ave | 0.16mi | 3/2.0 | 1,156 (+3%) | 13mo | $276,000 | $239 | 77 |
| 17827 N 19th St | 0.33mi | 3/2.0 | 1,096 (-2%) | 12mo | $130,000 | $119 | 71 |
| 2131 E Union Hills Dr Unit M5 | 0.16mi | 3/2.0 | 1,200 (+7%) | 12mo | $72,000 | $60 | 70 |
| 2027 E Michelle Dr | 0.15mi | 4/2.0 (+1) | 1,200 (+7%) | 12mo | $207,500 | $173 | 67 |
| 18240 N 21st Dr #86 | 0.09mi | 2/2.0 (-1) | 1,024 (-9%) | 14mo | $75,000 | $73 | 64 |
| 1802 E Campo Bello Dr #29 | 0.45mi | 3/2.0 | 1,232 (+10%) | 4mo | $80,000 | $65 | 59 |
| 18026 N Cave Creek Rd #125 | 0.23mi | 2/1.0 (-1) | 960 (-14%) | 1mo | $35,000 | $36 | 56 |
| 1939 E Libby St | 0.30mi | 2/2.0 (-1) | 980 (-12%) | 13mo | $175,000 | $179 | 49 |
| 18026 N Cave Creek Rd #16 | 0.30mi | 2/1.0 (-1) | 952 (-15%) | 3mo | $49,000 | $51 | 49 |
| 1701 E Villa Rita Dr | 0.53mi | 2/2.0 (-1) | 1,056 (-6%) | 15mo | $132,000 | $125 | 49 |
| 1955 E Grovers Ave #9 | 0.36mi | 2/2.0 (-1) | 1,248 (+11%) | 14mo | $79,000 | $63 | 47 |
Match score weights: distance 35% · size 25% · config 20% · recency 20%. Top-matched comps best support the ARV.
Projected returns pro-forma
-3.0% appreciation · 0.0% rent growth · sell at horizon
- IRR
- 34.7%
- Equity multiple
- 2.41×
- Total profit
- $37,387
- Equity at exit
- $14,135
- IRR
- 39.9%
- Equity multiple
- 4.22×
- Total profit
- $85,510
- Equity at exit
- $8,197
Cash invested: $26,544 (down + closing). Projections, not guarantees.
Landlord ↔ Tenant lean methodology
- Overall (STATE)
- 87 Strongly Landlord-Friendly
- State Arizona
- 87 Strongly Landlord-Friendly · R+3
- County
- — inherits STATE
- City
- — inherits STATE
ZIP-level market 85022
- Rents YoY
- -1.2%
- Active inventory
- 282
- Price-to-rent
- 4.0×
Monthly cashflow live
- Estimated rent
- $1,993 high interval (Pro) →
- Mortgage (P&I)
- −$497
- Tax est. 1.5%
- −$118 /mo · $1,422/yr
- Insurance
- −$40
- HOA
- −$0
- Vacancy / Maint / Mgmt
- −$419
- Net cashflow
- $919
Break-even live
UW: 25.0% down · 7.5% · 30yr · 1.5% tax · 5.0% vac · 8.0% maint · 8.0% mgmt
Financing live
Cash to close
- Down payment
- $23,700
- Closing costs
- $2,844
- Reserves months
- —
- Total cash needed
- —
Loan-product check · same deal, 3 products live
Conventional
25% down · 7.5% · 30yr
- Down + closing
- —
- Monthly P&I
- —
- Monthly cashflow
- —
- DSCR
- —
- Eligible?
- —
Personal DTI + credit; lowest rate.
DSCR
20% down · 8.5% · 30yr
- Down + closing
- —
- Monthly P&I
- —
- Monthly cashflow
- —
- DSCR
- —
- Eligible?
- —
No personal income docs; deal must DSCR.
Hard money
10% down · 12.0% · 12mo
- Down + closing
- —
- Monthly P&I
- —
- Monthly cashflow
- —
- DSCR
- —
- Eligible?
- —
Short-term bridge; refi at stabilization.
Rent comps 40 comps
| Address | Beds | Baths | Sqft | Rent | $/sqft | DOM | Units | Dist |
|---|---|---|---|---|---|---|---|---|
| 2221 E Union Hills Dr #158 Phoenix, AZ | 3.0 | 2.0 | 1332 | $2,100 | $1.58 | 18d | 1 | 0.18mi |
| 2067 E Charleston Ave Phoenix, AZ | 2.0 | 2.0 | 840 | $1,395 | $1.66 | 24d | 1 | 0.21mi |
| 2077 E Charleston Ave Phoenix, AZ | 2.0 | 1.0 | 720 | $1,295 | $1.80 | 24d | 1 | 0.21mi |
| 18202 N Cave Creek Rd Phoenix, AZ | 1.0–3.0 | 1.0–2.0 | 722 | $1,500 | $2.08 | 4d | 7 | 0.32mi |
| 18416 N Cave Creek Rd Phoenix, AZ | 2.0 | 1.0–2.0 | 786 | $3,000 | $3.81 | 4d | 9 | 0.34mi |
| 1717 E Union Hills Dr Phoenix, AZ | 2.0–3.0 | 2.0 | 1245 | $4,000 | $3.21 | 21d | 4 | 0.39mi |
| 1717 E Union Hills Dr Phoenix, AZ | 2.0–3.0 | 2.0 | 1169 | $4,000 | $3.42 | 3d | 3 | 0.39mi |
| 18660 N Cave Creek Rd Phoenix, AZ | 1.0–3.0 | 1.0–2.0 | 961 | $1,955 | $2.03 | 2d | 11 | 0.42mi |
| 1717 E Union Hills Dr #1052 Phoenix, AZ | 2.0 | 2.0 | 1160 | $4,000 | $3.45 | 43d | 1 | 0.47mi |
| 17602 N Cave Creek Rd Phoenix, AZ | 2.0 | 1.0–2.0 | 650 | $1,625 | $2.50 | 2d | 13 | 0.47mi |
| 1702 E Michelle Dr Phoenix, AZ | 2.0 | 2.0 | 1300 | $2,200 | $1.69 | 5d | 1 | 0.54mi |
| 2554 E Villa Rita Dr Phoenix, AZ | 2.0 | 1.0 | 1118 | $2,750 | $2.46 | 24d | 1 | 0.62mi |
| 17606 N 17th Pl Phoenix, AZ | 2.0–3.0 | 2.5 | 1472 | $2,300 | $1.56 | 12d | 3 | 0.62mi |
| 17606 N 17th Pl Phoenix, AZ | 2.0–3.0 | 2.0–2.5 | 1463 | $2,300 | $1.57 | 2d | 3 | 0.62mi |
| 17833 N 26th St Phoenix, AZ | 4.0 | 2.0 | 1220 | $2,397 | $1.96 | 1d | 1 | 0.66mi |
| 17150 N 23rd St #135 Phoenix, AZ | 2.0 | 2.5 | 1186 | $1,900 | $1.60 | 14d | 1 | 0.66mi |
| 1814 E Bell Rd Phoenix, AZ | 1.0–2.0 | 1.0–2.0 | 1003 | $1,637 | $1.63 | 1d | 12 | 0.67mi |
| 2602 E Charleston Ave Phoenix, AZ | 3.0 | 2.0 | 1426 | $2,100 | $1.47 | 24d | 1 | 0.67mi |
| 2150 E Bell Rd #1102 Phoenix, AZ | 3.0 | 2.5 | 1462 | $1,945 | $1.33 | 15d | 1 | 0.68mi |
| 17150 N 23rd St Phoenix, AZ | 2.0 | 2.0–2.5 | 1172 | $1,712 | $1.46 | 5d | 2 | 0.74mi |
| 17150 N 23rd St Phoenix, AZ | 2.0 | 2.0–2.5 | 1172 | $1,712 | $1.46 | 4d | 2 | 0.74mi |
| 17365 N Cave Creek Rd #124 Phoenix, AZ | 3.0 | 2.5 | 1468 | $2,299 | $1.57 | 15d | 1 | 0.74mi |
| 2335 E Utopia Rd Unit 16 Phoenix, AZ | 3.0 | 2.5 | 1426 | $2,550 | $1.79 | 18d | 1 | 0.79mi |
| 18633 N 15th St Phoenix, AZ | 3.0 | 2.0 | 1240 | $2,249 | $1.81 | 7d | 1 | 0.79mi |
| 2336 E Utopia Rd Phoenix, AZ | 2.0–3.0 | 2.5 | 1327 | $2,395 | $1.80 | 5d | 1 | 0.82mi |
| 1920 E Bell Rd Phoenix, AZ | 2.0–3.0 | 2.0–2.5 | 1391 | $2,149 | $1.54 | 14d | 5 | 0.82mi |
| 1920 E Bell Rd Phoenix, AZ | 2.0–3.0 | 2.0–2.5 | 1391 | $2,039 | $1.47 | 2d | 3 | 0.82mi |
| 1920 E Bell Rd Phoenix, AZ | 2.0–3.0 | 2.0–2.5 | 1391 | $2,089 | $1.50 | 7d | 4 | 0.82mi |
| 2755 E Michigan Ave Phoenix, AZ | 3.0 | 2.0 | 1316 | $2,700 | $2.05 | 17d | 1 | 0.83mi |
| 1750 E Bell Rd Phoenix, AZ | 1.0–2.0 | 1.0 | 700 | $1,349 | $1.93 | 24d | 1 | 0.85mi |
| 1506 E Wescott Dr Phoenix, AZ | 3.0 | 2.0 | 1136 | $2,045 | $1.80 | 5d | 1 | 0.85mi |
| 1510 E Taro Ln Phoenix, AZ | 3.0 | 2.0 | 1136 | $2,149 | $1.89 | 24d | 1 | 0.88mi |
| 1702 E Bell Rd #180 Phoenix, AZ | 3.0 | 2.5 | 1358 | $2,000 | $1.47 | 24d | 1 | 0.91mi |
| 1420 E Topeka Dr Phoenix, AZ | 3.0 | 2.5 | 1464 | $2,215 | $1.51 | 7d | 1 | 0.98mi |
| 2214 E Aire Libre Ave Phoenix, AZ | 3.0 | 2.0 | 1284 | $2,080 | $1.62 | 5d | 1 | 1.02mi |
| 1302 E Aire Libre Ave Unit 104 Phoenix, AZ | 3.0 | 2.0 | 1254 | $1,850 | $1.48 | 24d | 1 | 1.03mi |
| 1450 E Bell Rd Phoenix, AZ | 1.0–3.0 | 1.0–2.0 | 957 | $2,083 | $2.18 | 2d | 93 | 1.03mi |
| 2030 E Wahalla Ln Phoenix, AZ | 3.0 | 2.0 | 1400 | $2,115 | $1.51 | 3d | 1 | 1.04mi |
| 16635 N Cave Creek Rd #214 Phoenix, AZ | 2.0 | 2.0 | 1134 | $1,300 | $1.15 | 19d | 1 | 1.04mi |
| 19635 N Cave Creek Rd Phoenix, AZ | 3.0 | 1.0–2.0 | 999 | $1,933 | $1.93 | 1d | 22 | 1.06mi |
Listing history 5 events
-
2026-06-18days on market $94,800 Active 4 DOM
-
2026-06-17days on market $94,800 Active 3 DOM
-
2026-06-16days on market $94,800 Active 2 DOM
-
2026-06-15remarks 699-char remark
-
2026-06-15$94,800 Active 1 DOM
ⓘ Source: listings_history table (triggers on properties + properties_extension) + one-shot
backfill from property_details.listing_events for pre-trigger history.
Climate risk First Street
- Flood 1/10 Low FEMA zone X (shaded) · 0% chance over 30 yrs
- Wildfire 4/10 Moderate
- Heat 8/10 Severe 7 d/yr ≥110°F today · 17 d/yr by 30 yrs out
- Wind 1/10 Low
- Air quality 3/10 Moderate 3 unhealthy d/yr today · 5 by 30 yrs out
Nearby sold comps map
Loading sold comps map…
Walkable amenities ~0.75 mi
Loading nearby amenities…
Taxation est. · year 1
- Rental income
- $23,918
- − Mortgage interest
- −$5,310
- − Property taxes
- −$1,422
- − Insurance
- −$474
- − Repairs & maintenance
- −$1,913
- − Management
- −$1,913
- − Depreciation
- −$2,758
- Taxable income
- $10,127
- Est. tax owed @ 24.0%
- −$2,430
- After-tax cash flow
- $8,603/yr
For passive investors: Depreciation is non-cash, so a rental often shows a tax loss while cash-flowing — sheltering income. Rental losses are passive: they offset passive income freely, and up to $25,000/yr can offset ordinary (W-2) income if you actively participate and your MAGI is under $100k (phasing out to $0 by $150k); unused losses carry forward. On sale, claimed depreciation is recaptured at up to 25%, and gains may owe capital-gains tax (a 1031 exchange can defer both). Figures are a year-1 estimate at your 24.0% rate — not tax advice; consult a CPA.
Condition & rehab AI · 12 photos
This well-maintained, updated manufactured home is move-in ready with fresh paint, new flooring, and remodeled bathrooms. It offers a good return on investment with minor updates for further enhancement.
Value-add opportunities
- Both Paint exterior and interior walls — Fresh paint enhances curb appeal and interior aesthetics
- Both Replace ceiling fans with energy-efficient models — Energy-efficient fans reduce energy costs and improve comfort
- Both Install smart home devices for energy management and security — Smart devices improve energy efficiency and add modern amenities
Renovation cost estimate screening
Value-add ROI direction
- Both Paint exterior and interior walls — Fresh paint enhances curb appeal and interior aesthetics ↑
- Both Replace ceiling fans with energy-efficient models — Energy-efficient fans reduce energy costs and improve comfort ↑
- Both Install smart home devices for energy management and security — Smart devices improve energy efficiency and add modern amenities ↑
ⓘ Cost ranges are severity-bucket heuristics (US national rule-of-thumb). Get contractor quotes + a written scope before underwriting a rehab budget.
Schools (NCES district)
- District
- Paradise Valley Unified District (4241)
- NCES district ID
- 0405930
- Math proficiency
- 39% ▼ -11.00%
- Reading proficiency
- 46% ▼ -7.00%
- Median HH income
- $64,106
- Composite
- 37.89/100
- National rank
- #4316
- State rank
- #56 of 249 in AZ
Livability — Phoenix
- Score
- 75/100
- State rank
- #16
- US rank
- #3924
Category grades
Schools grade is shown separately in the Schools card above.
Census & demographics
- Census place
- Phoenix, AZ
- County
- Maricopa County · 4,537,380 people
- City population
- 1,500,198
- Metro
- Phoenix-Mesa-Chandler, AZ
- Population (ZIP)
- 53,811
- Household income
- $69,927
- Rent vs Own
- Severe rent burden
- 2976.0
Population outlook (Maricopa County) Hauer SSP2
- Today (2025)
- 4,979,203 people
- By 2030
- 5,378,229 · +8.0%
- By 2040
- 6,156,598 · +23.6%
- By 2050
- 6,872,376 · +38.0%
- By 2075
- 8,401,270 · +68.7%
- By 2100
- 9,247,439 · +85.7%
Race, ethnicity, and origin ACS 2023
- Neighborhood character
- Diverse neighborhood (Simpson 0.59)
- Race & ethnicity
- White 59% Hispanic / Latino 22% Two or more races 11% Black 10% Asian 3% Native American 3%
- Hispanic origin (detail)
- Mexican 18%
- Common ancestry
- Romanian 3% Lithuanian 2% Italian 1%
- Foreign-born
- 14% · Canada, China, Vietnam
- Languages at home
- 79% English-only · Spanish 13% Other Indo-European 2% Russian/Polish/Slavic 1%
Political lean MEDSL · Maricopa
- 2024 margin
- Toss-up / Even · D 47.7% · R 51.2% · Other 1.1%
- 2008→2024 swing
- +7.1pp toward D · 2008: -10.6pp · 2024: -3.5pp
- All cycles
- 2024: R+3.5 2020: D+2.2 2016: R+3.5 2012: R+12.0 2008: R+10.6
Not yet ingested
- Civics
- —
Market trends
- HPI YoY
- ▼ -329.75%
- Current HPI
- 313.5085
- Rent YoY
- ▼ -1.21%
- Metro
- Phoenix-Mesa-Chandler, AZ
- State GDP YoY
- ▲ 4.54%
- F500 in state
- 20
Industry mix (Fortune 500 HQ in AZ)
| Industry | F500 HQs | Revenue |
|---|---|---|
| Technology | 2 | $13B |
|
||
| Mining / Metals | 1 | $23B |
|
||
| Environmental Services | 1 | $16B |
|
||
| Metals / Steel | 1 | $14B |
|
||
| Technology Distribution | 1 | $9B |
|
||
| Homebuilding | 1 | $8B |
|
||
Price history
1 event — show timeline
- 2026-06-14 Listed $94,800 ARMLS
Cash-flow waterfall
monthlySold comps — $/sqft
last 12 mo · ≤1 miLoading sold comps…