3471 20th · San Bernardino, CA
Flood risk 1/10 · Minimal
- FEMA flood zone
- X (unshaded)
- Chance of flooding over 30 yrs
- 0.0%
- Est. flood insurance / yr
- $507 – $1,088
Fire risk 8/10 · Major
- Est. fire insurance / yr
- $659 – $1,223
Heat risk 8/10 · Major
- Hot days now (above 101°F)
- 6 days/yr
- Hot days in 30 yrs
- 16 days/yr
Wind risk 1/10 · Minimal
- Chance of severe wind over 30 yrs
- —
Air-quality risk 10/10 · Severe
- Unhealthy air days now
- 29 days/yr
- Unhealthy air days in 30 yrs
- 35 days/yr
Risk factors via First Street. Map © Google.
Why this score? — see what drove the D grade
The composite is a weighted blend of 9 inputs, each scored 0–100. Each bar is that input's sub-score; the figure is the points it added to the 100-point composite (weight × sub-score).
- Cash flow +10.6/30.0
- ARV discount +9.7/15.0
- 1% rule +5.8/10.0
- Rent growth +3.2/5.0
- DSCR +3.1/10.0
- Schools +3.1/10.0
- Livability +3.0/5.0
- Condition / age +2.5/5.0
- Appreciation +0.0/10.0
$190,000
🖨 Deal sheet (PDF) 📄 Offer letter ✓ Due diligence
Listing remarks MLS
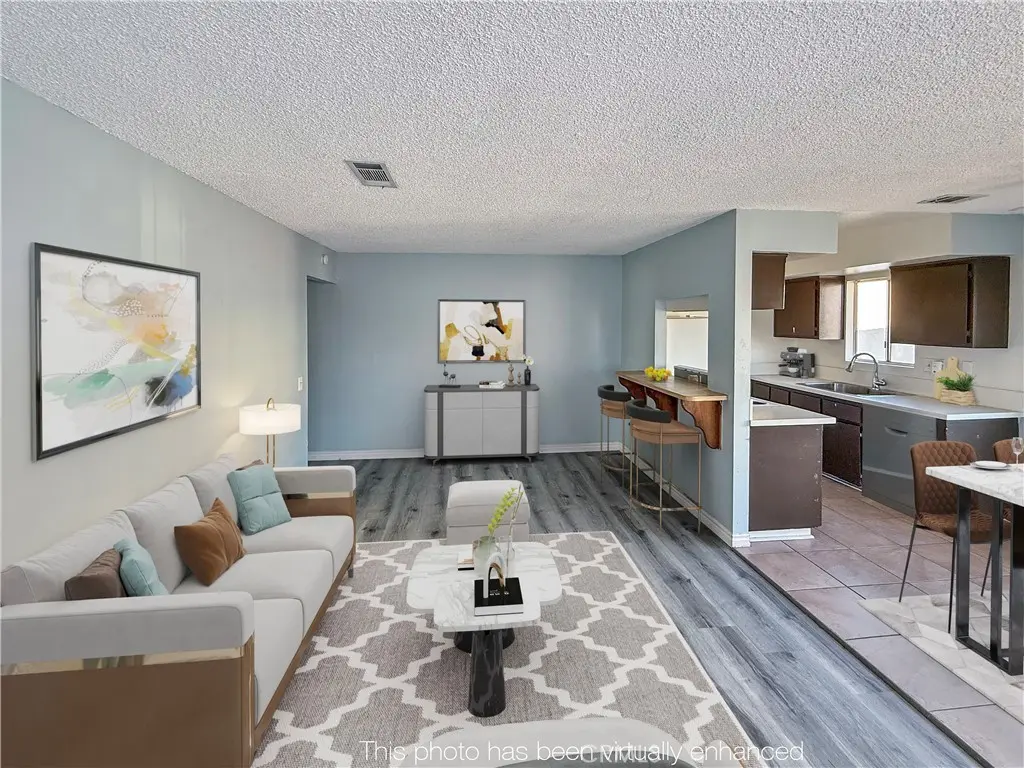
This 2-bedroom, 1-bath condo offers a functional layout and a comfortable living space that’s ideal for first-time buyers, investors, or those looking to downsize. The home provides low-maintenance living and a practical floor plan that makes the most of the space. Conveniently located with access to nearby shopping, dining, and everyday amenities, this condo is a great opportunity for buyers looking for value. Easy access to 210 and Big Bear mountain areas.
Key facts
- Practical floor plan
- Access to shopping
- Functional layout
Tags
Neighborhood map
What this means for you Summary
Snapshot
- This is a 2-bed/1.0-bath condo listed at $190k.
Deal economics
- At list price, monthly cash flow is $-94 ($-1k/yr) — negative.
- To cash-flow at today's rent, offer at most $173k (8.8% below list).
- Meets the 1% rule at list price ($2k rent vs $190k).
- Recommended offer: $173k (8.8% below list) — sets the bar for cash-flow.
- Cap rate 5.7% vs local median 3.5% in San Bernardino — top-decile yield for the area; either an underpriced asset or a hidden risk that comps aren't pricing in. Stress-test before assuming the spread holds.
Location & tenants
- Location reads 59/100 on livability (#661 in CA) — a working-class tenant base; expect higher turnover. Strengths: commute A+, housing A; Watch: employment D, crime F, cost of living F.
- San Bernardino City Unified (urban): math 27% / reading 40% proficiency, ranked #959 of 1,400 in CA (top 68%) — families likely to look elsewhere, expect single-tenant / working-renter base with shorter leases; 81% free/reduced lunch — lower-income household profile, screen leases tightly.
- Zoned schools: Oehl Elementary (479 students, 87% FRL); Serrano Middle (683 students, 90% FRL); San Gorgonio High (1,542 students, 88% FRL).
- Market conditions: Rents rising (+2.9%/yr); 152 active listings in the ZIP; 19 comparable units currently listed for rent nearby; rentals at typical pace (median 26d on market — plan ~3-4 weeks tenant-placement turnaround); solid renter incomes; 5,458 units permitted in San Bernardino County in 2024 (1,500 in 5+ unit buildings).
Forward outlook
- Local home prices are declining (-3.0%/yr); year-one equity from $1k of loan paydown is wiped out by about $6k of value loss. Plan a longer hold.
- San Bernardino County population projected at +15% by 2050 — modest demand growth; plan on rents tracking national, not racing it.
Negotiation context
- It's been on market 86 days — a 6% lower offer ($179k) is reasonable based on typical stale-listing flexibility.
- 7 sale attempts since 21y ago with the ask held roughly flat each time — persistent listings suggest the price (not the market) is what's stuck; bring a comps-based counter.
- Current owner paid $157k; 21% above their basis — modest negotiation headroom, anchor on the comps not their cost.
Risks & watch-outs
- Watch-outs: HOA is 22% of rent.
- Climate carrying-cost: severe wildfire risk; extreme-heat days projected 6→16/yr by 2055 (HVAC capex compounding) — expect insurance premiums to compound above CPI over the hold.
Questions for the listing agent
- What do current leases actually rent for vs. the listed asking? Can we see a recent rent roll and the last 12 months of T-12 income?
- It's been on market 86 days. Have you received any prior offers? Is the seller open to a 9% concession, seller financing, or rate buy-down credit?
- Built in 1969 — when were the roof, HVAC, electrical panel, plumbing, and water heater last replaced?
- What does the HOA fee cover, when was the last increase, and are there any pending special assessments or reserve-fund shortfalls?
- Any open or pending special assessments — roof, HVAC, plumbing, elevator, façade? What's the per-unit balance and payoff schedule, and is the seller paying it off at close or rolling it to the buyer?
- Why hasn't it sold? Are there any deal-killer items the seller is aware of (foundation, flood, title, zoning, code violations)?
- Is there a deadline driving the sale (1031 exchange, divorce, estate, relocation)? That informs how much negotiation room exists.
- Schools are D-rated, which usually means shorter tenancies and higher turnover. Who's the typical renter profile here, and what's been the actual vacancy rate?
- Crime grade is F in this area — have there been break-ins, vandalism, or insurance claims at this property in the last 3 years? What carrier currently insures it and at what premium?
- The area grade is low — what's the realistic commute time and amenity access for the typical tenant pool here? Any planned neighborhood developments (good or bad) we should know about?
- What's the average days-on-market for RENTAL listings here right now (not sales)? A rising rental-DOM trend means longer vacancies and softer asking-rent achievability than the comps imply.
- What's the recent tenant-quality profile in this submarket — average credit score on applications, eviction rate, late-payment / NSF rate, and stable-employment percentage? A property-management company in the area should have these aggregated.
- How much new apartment / multifamily construction is in the pipeline within 1–3 miles? Heavy new supply (>2% of stock underway) typically softens rents 12–24 months out; light construction supports rent growth.
Investment metrics
- 1% rule
- 1.08% ✓
- Cap rate
- 5.70%
- Cash-on-cash
- -2.13%
- DSCR
- 0.91
- GRM
- 7.7
CMA / ARV
- ARV (median comp)
- $199,833
- List price
- $190,000
- Delta
- -4.92%
- Verdict
- FAIR
- Comps
- 20 within 1.0 mi
Projected returns pro-forma
-3.0% appreciation · 2.91% rent growth · sell at horizon
- IRR
- -19.8%
- Equity multiple
- 0.31×
- Total profit
- $-36,710
- Equity at exit
- $28,330
- IRR
- -12.5%
- Equity multiple
- 0.26×
- Total profit
- $-39,343
- Equity at exit
- $16,428
Cash invested: $53,200 (down + closing). Projections, not guarantees.
Landlord ↔ Tenant lean methodology
- Overall (STATE)
- 18 Strongly Tenant-Friendly
- State California
- 18 Strongly Tenant-Friendly · D+13
- County
- — inherits STATE
- City
- — inherits STATE
ZIP-level market 92346
- Rents YoY
- 2.9%
- Active inventory
- 152
- Price-to-rent
- 7.7×
Monthly cashflow live
- Estimated rent
- $2,050 high interval (Pro) →
- Mortgage (P&I)
- −$996
- Tax from tax record
- −$188 /mo · $2,257/yr
- Insurance
- −$79
- HOA
- −$450
- Vacancy / Maint / Mgmt
- −$430
- Net cashflow
- $-94
Break-even live
Sensitivity live
| Price | -10% $13 | -5% $-41 | +0% $-94 | +5% $-148 | +10% $-202 |
|---|---|---|---|---|---|
| Rent | -10% $-256 | -5% $-175 | +0% $-94 | +5% $-13 | +10% $68 |
| Rate | -1.0pp $1 | -0.5pp $-46 | base $-94 | +0.5pp $-144 | +1.0pp $-194 |
UW: 25.0% down · 7.5% · 30yr · 1.5% tax · 5.0% vac · 8.0% maint · 8.0% mgmt
Financing live
Cash to close
- Down payment
- $47,500
- Closing costs
- $5,700
- Reserves months
- —
- Total cash needed
- —
Loan-product check · same deal, 3 products live
Conventional
25% down · 7.5% · 30yr
- Down + closing
- —
- Monthly P&I
- —
- Monthly cashflow
- —
- DSCR
- —
- Eligible?
- —
Personal DTI + credit; lowest rate.
DSCR
20% down · 8.5% · 30yr
- Down + closing
- —
- Monthly P&I
- —
- Monthly cashflow
- —
- DSCR
- —
- Eligible?
- —
No personal income docs; deal must DSCR.
Hard money
10% down · 12.0% · 12mo
- Down + closing
- —
- Monthly P&I
- —
- Monthly cashflow
- —
- DSCR
- —
- Eligible?
- —
Short-term bridge; refi at stabilization.
Rent comps 19 comps
| Address | Beds | Baths | Sqft | Rent | $/sqft | DOM | Units | Dist |
|---|---|---|---|---|---|---|---|---|
| 3479 20th St Highland, CA | 2.0 | 1.0 | 882 | $1,995 | $2.26 | 1d | 1 | 0.04mi |
| 3479 20th St Highland, CA | 2.0 | 1.0 | 882 | $1,995 | $2.26 | 45d | 1 | 0.04mi |
| 3404 20th St #1 Highland, CA | 2.0 | 1.0 | 780 | $2,195 | $2.81 | 4d | 1 | 0.07mi |
| 3511 Rainbow Ln Highland, CA | 2.0 | 1.0 | 780 | $2,050 | $2.63 | 4d | 1 | 0.08mi |
| 3532 Rainbow Ln Highland, CA | 2.0 | 1.0 | 882 | $2,100 | $2.38 | 0d | 1 | 0.10mi |
| 3495 21st St Unit B Highland, CA | 2.0 | 2.0 | 1000 | $2,000 | $2.00 | 45d | 1 | 0.10mi |
| 6787 Cole Ave Highland, CA | 2.0–3.0 | 2.0 | 1005 | $2,125 | $2.11 | 0d | 1 | 0.18mi |
| 27205 Main St Highland, CA | 1.0 | 1.0 | 700 | $1,575 | $2.25 | 45d | 1 | 0.39mi |
| 2265 Bradford Ave Apt 524 Highland, CA | 2.0 | 2.0 | 810 | $1,800 | $2.22 | 26d | 1 | 0.56mi |
| 6601 Victoria Ave Highland, CA | 2.0 | 2.0 | 775 | $1,827 | $2.36 | 45d | 1 | 0.59mi |
| 6601 Victoria Ave Highland, CA | 2.0 | 2.0 | 775 | $1,677 | $2.16 | 21d | 1 | 0.59mi |
| 6601 Victoria Ave Highland, CA | 2.0 | 2.0 | 775 | $1,677 | $2.16 | 26d | 1 | 0.59mi |
| 7000 La Praix St Highland, CA | 2.0 | 1.0 | 865 | $2,200 | $2.54 | 0d | 1 | 0.76mi |
| 7221 Olive St Highland, CA | 2.0 | 1.0 | 866 | $2,150 | $2.48 | 45d | 1 | 0.89mi |
| 7410 San Francisco St Highland, CA | 2.0 | 2.0 | 864 | $2,400 | $2.78 | 22d | 1 | 1.22mi |
| 7410 San Francisco St Highland, CA | 2.0 | 2.0 | 864 | $2,500 | $2.89 | 26d | 1 | 1.22mi |
| 26660 9th St Highland, CA | 1.0–2.0 | 1.0–2.0 | 755 | $2,050 | $2.72 | 0d | 5 | 1.36mi |
| 2225 Pumalo St San Bernardino, CA | 1.0–2.0 | 1.0–2.0 | 750 | $2,035 | $2.71 | 45d | 1 | 1.44mi |
| 7767 Colwyn Ave Highland, CA | 3.0 | 1.5 | 1107 | $2,500 | $2.26 | 26d | 1 | 1.46mi |
HOA detail condo
- Monthly dues
- $450 · $5,400/yr
- Assessments
- None detected in remarks — confirm with the listing agent.
Listing history 39 events
-
2026-06-21days on market $190,000 Active 86 DOM
-
2026-06-18days on market $190,000 Active 83 DOM
-
2026-06-17days on market $190,000 Active 82 DOM
-
2026-06-16days on market $190,000 Active 81 DOM
-
2026-06-15days on market $190,000 Active 80 DOM
-
2026-06-13days on market $190,000 Active 78 DOM
-
2026-06-09days on market $190,000 Active 74 DOM
-
2026-06-08days on market $190,000 Active 73 DOM
-
2026-06-07days on market $190,000 Active 72 DOM
-
2026-06-04days on market $190,000 Active 69 DOM
-
2026-06-03days on market $190,000 Active 68 DOM
-
2026-06-02days on market $190,000 Active 67 DOM
-
2026-06-01days on market $190,000 Active 66 DOM
-
2026-05-31days on market $190,000 Active 65 DOM
-
2026-03-27$190,000 Active 468-char remark
Show marketing remark (468 chars)
This 2-bedroom, 1-bath condo offers a functional layout and a comfortable living space that’s ideal for first-time buyers, investors, or those looking to downsize. The home provides low-maintenance living and a practical floor plan that makes the most of the space. Conveniently located with access to nearby shopping, dining, and everyday amenities, this condo is a great opportunity for buyers looking for value. Easy access to 210 and Big Bear mountain areas.
-
2025-02-03historical
-
2024-08-11price $209,999
-
2024-07-24$214,999 Active
-
2024-07-04historical
-
2021-11-24soldstatus $157,000 Closed Sale
-
2021-11-24soldstatus $157,000 Closed Sale
-
2021-11-22soldstatus $157,000
-
2021-11-02historical Active Under Contract
-
2021-11-02historical Active Under Contract
-
2021-10-08price $165,000
-
2021-10-08price $165,000
-
2021-09-28$178,000 Active
-
2021-09-28$178,000 Active
-
2016-05-28soldstatus $50,000 Closed Sale
-
2016-05-27soldstatus $50,000
-
2016-04-05status Pending Sale
-
2016-02-24price $55,000
-
2016-02-23status Active
-
2015-06-24status Pending Sale
-
2015-06-18$43,900 Active
-
2005-05-05soldstatus $113,000
-
2005-04-22soldstatus $113,000
-
2005-03-08$110,000
-
1978-11-21soldstatus $32,000
ⓘ Source: listings_history table (triggers on properties + properties_extension) + one-shot
backfill from property_details.listing_events for pre-trigger history.
Tax reassessment forecast CA · Resets to sale price
- Current annual tax
- $2,257 · $188/mo
- Projected year-2 tax
- $2,257 · $188/mo
- Expected delta
- $0/yr ($0/mo · 0.0%)
ⓘ Screening estimate from a state-policy table — verify with the county assessor before closing.
Climate risk First Street
- Flood 1/10 Low FEMA zone X (unshaded) · 0% chance over 30 yrs
- Wildfire 8/10 Severe
- Heat 8/10 Severe 6 d/yr ≥101°F today · 16 d/yr by 30 yrs out
- Wind 1/10 Low
- Air quality 10/10 Extreme 29 unhealthy d/yr today · 35 by 30 yrs out
Nearby sold comps map
Loading sold comps map…
Walkable amenities ~0.75 mi
Loading nearby amenities…
Taxation est. · year 1
- Rental income
- $24,595
- − Mortgage interest
- −$10,643
- − Property taxes
- −$2,257
- − Insurance
- −$950
- − Repairs & maintenance
- −$1,968
- − Management
- −$1,968
- − HOA
- −$5,400
- − Depreciation
- −$5,527
- Taxable loss
- −$4,117
- Est. tax savings @ 24.0%
- +$988
- After-tax cash flow
- $-145/yr
For passive investors: Depreciation is non-cash, so a rental often shows a tax loss while cash-flowing — sheltering income. Rental losses are passive: they offset passive income freely, and up to $25,000/yr can offset ordinary (W-2) income if you actively participate and your MAGI is under $100k (phasing out to $0 by $150k); unused losses carry forward. On sale, claimed depreciation is recaptured at up to 25%, and gains may owe capital-gains tax (a 1031 exchange can defer both). Figures are a year-1 estimate at your 24.0% rate — not tax advice; consult a CPA.
Schools (NCES district)
- District
- San Bernardino City Unified
- NCES district ID
- 0634170
- Math proficiency
- 27% ▲ 1.00%
- Reading proficiency
- 40% ▬ 0.00%
- Median HH income
- $39,758
- Composite
- 30.8/100
- National rank
- #11385
- State rank
- #959 of 1400 in CA
Livability — San Bernardino
- Score
- 59/100
- State rank
- #661
- US rank
- #20479
Category grades
Schools grade is shown separately in the Schools card above.
Census & demographics
- Census place
- San Bernardino, CA
- County
- San Bernardino County · 2,030,291 people
- City population
- 255,614
- Metro
- Riverside-San Bernardino-Ontario, CA
- Population (ZIP)
- 56,179
- Household income
- $85,163
- Rent vs Own
- Severe rent burden
- 1816.0
Population outlook (San Bernardino County) Hauer SSP2
- Today (2025)
- 2,300,329 people
- By 2030
- 2,378,907 · +3.4%
- By 2040
- 2,523,137 · +9.7%
- By 2050
- 2,642,388 · +14.9%
- By 2075
- 2,880,769 · +25.2%
- By 2100
- 2,909,436 · +26.5%
Race, ethnicity, and origin ACS 2023
- Neighborhood character
- Diverse neighborhood (Simpson 0.63)
- Race & ethnicity
- Hispanic / Latino 53% White 26% Two or more races 14% Black 8% Asian 8% Native American 1%
- Hispanic origin (detail)
- Mexican 46%
- Common ancestry
- Italian 1% Iranian 1% Lithuanian 1%
- Foreign-born
- 19% · Canada, Vietnam, South Korea
- Languages at home
- 60% English-only · Spanish 32% Vietnamese 2% Tagalog/Filipino 2%
Political lean MEDSL · San Bernardino
- 2024 margin
- Toss-up / Even · D 47.5% · R 49.7% · Other 2.8%
- 2008→2024 swing
- -8.5pp toward R · 2008: 6.3pp · 2024: -2.1pp
- All cycles
- 2024: R+2.1 2020: D+10.7 2016: D+9.8 2012: D+5.4 2008: D+6.3
Not yet ingested
- Civics
- —
Market trends
- HPI YoY
- ▼ -328.00%
- Current HPI
- 367.2829
- Rent YoY
- ▲ 2.91%
- Metro
- Riverside-San Bernardino-Ontario, CA
- State GDP YoY
- ▲ 3.21%
- F500 in state
- 116
Industry mix (Fortune 500 HQ in CA)
| Industry | F500 HQs | Revenue |
|---|---|---|
| Technology | 27 | $1,492B |
|
||
| Financial Services | 3 | $174B |
|
||
| Retail | 3 | $44B |
|
||
| Insurance | 3 | $26B |
|
||
| Media / Entertainment | 2 | $115B |
|
||
| Pharmaceuticals / Biotech | 2 | $62B |
|
||
Price history
+493.8% since first listed25 events — show timeline
- 2026-03-27 Listed $190,000 CRMLS
- 2025-02-03 Listing Removed — CRMLS
- 2024-08-11 Price Changed $209,999 CRMLS
- 2024-07-24 Listed $214,999 CRMLS
- 2024-07-04 Coming Soon — CRMLS
- 2021-11-24 Sold (MLS) $157,000 CRMLS
- 2021-11-24 Sold (MLS) $157,000 CRMLS
- 2021-11-22 Sold (Public Records) $157,000 Public Records
- 2021-11-02 Contingent — CRMLS
- 2021-11-02 Contingent — CRMLS
- 2021-10-08 Price Changed $165,000 CRMLS
- 2021-10-08 Price Changed $165,000 CRMLS
- 2021-09-28 Listed $178,000 CRMLS
- 2021-09-28 Listed $178,000 CRMLS
- 2016-05-28 Sold (MLS) $50,000 CRMLS
- 2016-05-27 Sold (Public Records) $50,000 Public Records
- 2016-04-05 Pending — CRMLS
- 2016-02-24 Price Changed $55,000 CRMLS
- 2016-02-23 Relisted — CRMLS
- 2015-06-24 Pending — CRMLS
- 2015-06-18 Listed $43,900 CRMLS
- 2005-05-05 Sold (MLS) $113,000 CRMLS
- 2005-04-22 Sold (Public Records) $113,000 Public Records
- 2005-03-08 Listed $110,000 CRMLS
- 1978-11-21 Sold (Public Records) $32,000 Public Records
Property tax history
+2.7%/yrLatest (2025): $2,257 · +2.2% YoY. Source: county tax records.
Cash-flow waterfall
monthlySold comps — $/sqft
last 12 mo · ≤1 miLoading sold comps…