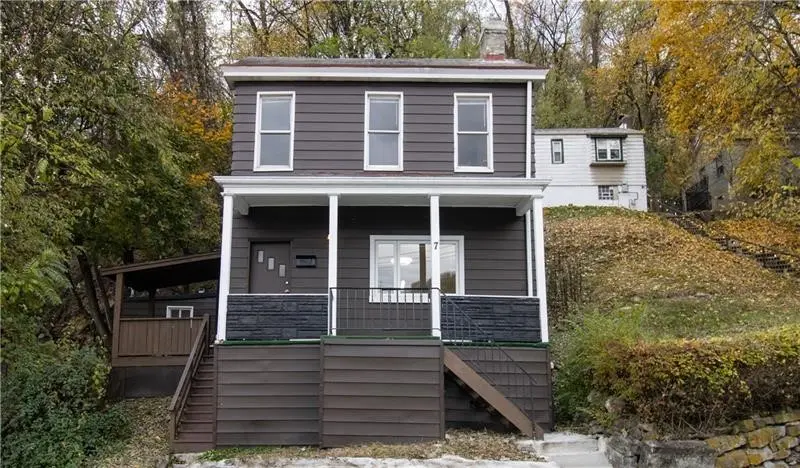
7 Prospect St · Etna, PA
Flood risk 5/10 · Moderate
- FEMA flood zone
- X (unshaded)
- Chance of flooding over 30 yrs
- 0.24%
- Est. flood insurance / yr
- $473 – $860
Fire risk 1/10 · Minimal
- Est. fire insurance / yr
- $511 – $949
Heat risk 4/10 · Minor
- Hot days now (above 98°F)
- 7 days/yr
- Hot days in 30 yrs
- 18 days/yr
Wind risk 2/10 · Minimal
- Chance of severe wind over 30 yrs
- —
Air-quality risk 4/10 · Minor
- Unhealthy air days now
- 5 days/yr
- Unhealthy air days in 30 yrs
- 7 days/yr
Risk factors via First Street. Map © Google.
Why this score? — see what drove the B grade
The composite is a weighted blend of 9 inputs, each scored 0–100. Each bar is that input's sub-score; the figure is the points it added to the 100-point composite (weight × sub-score).
- Cash flow +27.7/30.0
- ARV discount +15.0/15.0
- DSCR +9.8/10.0
- 1% rule +7.5/10.0
- Schools +4.1/10.0
- Livability +4.0/5.0
- Rent growth +2.5/5.0
- Condition / age +2.5/5.0
- Appreciation +0.0/10.0
$124,999
🖨 Deal sheet 📄 Offer letter ✓ Due diligence
Listing remarks MLS
Welcome to this completely overhauled 3-bedroom home located in the Shaler Area School District! This move-in-ready property has been updated from top to bottom, featuring brand new appliances, a modern kitchen with stylish vinyl flooring throughout, and plenty of natural light. Enjoy a welcoming front porch entrance and a side porch ideal for relaxing. Whether you're a first-time buyer looking for your starter home or an investor searching for a turn-key rental, this property checks all the boxes. Don’t miss your chance to own this updated home.
Key facts
- Front porch
- Natural light
- Side porch
Tags
Neighborhood map
What this means for you Summary
Snapshot
- This is a 3-bed/1.5-bath single-family listed at $125k.
Deal economics
- At list price, monthly cash flow is $379 ($5k/yr) — positive.
- The deal already cash-flows at list — no discount required.
- Meets the 1% rule at list price ($2k rent vs $125k).
- Recommended offer: $114k (9.0% below list) — sets the bar for market timing.
Location & tenants
- Location reads 81/100 on livability (#172 in PA, #1,441 nationally) — a professional / high-income tenant draw. Strengths: crime A+, commute A+, cost of living A+; Watch: employment C-, amenities D, schools D-.
- Shaler Area SD (suburban): math 36% / reading 59% proficiency, ranked #208 of 539 in PA (top 39%) — families likely to look elsewhere, expect single-tenant / working-renter base with shorter leases.
- Market conditions: 23 active listings in the ZIP; 12 comparable units currently listed for rent nearby; rentals at typical pace (median 24d on market — plan ~3-4 weeks tenant-placement turnaround); 2,996 units permitted in Allegheny County in 2024 (1,588 in 5+ unit buildings).
- This rent runs 31% of the median local income ($61k/yr) — at the standard rent-burdened threshold; future hikes will face affordability resistance.
Forward outlook
- Local home prices are declining (-3.0%/yr); year-one equity from $864 of loan paydown is wiped out by about $4k of value loss. Plan a longer hold.
- At projected returns (-3.0% appreciation + 3.0% rent growth), your $35k cash investment doubles in ~9 years — after that, you're playing with house money.
Negotiation context
- It's been on market 97 days — a 9% lower offer ($114k) is reasonable based on typical stale-listing flexibility.
- 5 sale attempts since 3y ago with the ask held roughly flat each time — persistent listings suggest the price (not the market) is what's stuck; bring a comps-based counter.
- Current owner paid $75k; list at $125k implies a 67% gain — meaningful room to come down on a strong offer.
Risks & watch-outs
- Watch-outs: built in 1900 — expect roof / HVAC / electrical / plumbing capex.
- Climate carrying-cost: moderate flood risk — expect insurance premiums to compound above CPI over the hold.
Questions for the listing agent
- It's been on market 97 days. Have you received any prior offers? Is the seller open to a 9% concession, seller financing, or rate buy-down credit?
- Built in 1900 — when were the roof, HVAC, electrical panel, plumbing, and water heater last replaced?
- Why hasn't it sold? Are there any deal-killer items the seller is aware of (foundation, flood, title, zoning, code violations)?
- Is there a deadline driving the sale (1031 exchange, divorce, estate, relocation)? That informs how much negotiation room exists.
- Schools are D-rated, which usually means shorter tenancies and higher turnover. Who's the typical renter profile here, and what's been the actual vacancy rate?
- What's the average days-on-market for RENTAL listings here right now (not sales)? A rising rental-DOM trend means longer vacancies and softer asking-rent achievability than the comps imply.
- What's the recent tenant-quality profile in this submarket — average credit score on applications, eviction rate, late-payment / NSF rate, and stable-employment percentage? A property-management company in the area should have these aggregated.
- How much new for-sale + rental construction is in the pipeline within 1–3 miles? Heavy new supply typically softens prices + rents 12–24 months out; constrained supply supports both.
Investment metrics
- 1% rule
- 1.25% ✓
- Cap rate
- 9.93%
- Cash-on-cash
- 12.98%
- DSCR
- 1.58
- GRM
- 6.7
CMA / ARV
- ARV (median comp)
- $162,634
- List price
- $124,999
- Delta
- -23.14%
- Verdict
- UNDERPRICED
- Comps
- 20 within 1.0 mi
Show comp detail 12 sales within ~0.75 mi
| Address | Dist | Beds/Ba | Sqft | Sold | Price | $/sf | Match |
|---|---|---|---|---|---|---|---|
| 24 High St | 0.19mi | 3/1.0 | 1,296 (+3%) | 0mo | $155,000 | $120 | 84 |
| 59 Sycamore | 0.17mi | 2/1.0 (-1) | 1,296 (+3%) | 5mo | $125,000 | $96 | 76 |
| 31 Pine St | 0.35mi | 3/1.5 | 1,200 (-5%) | 0mo | $317,500 | $265 | 75 |
| 146 Buckeye Way | 0.51mi | 3/2.0 | 1,188 (-6%) | 3mo | $232,000 | $195 | 63 |
| 174 Seavey Rd | 0.44mi | 3/1.5 | 1,155 (-8%) | 6mo | $215,000 | $186 | 60 |
| 137 Vista St | 0.42mi | 2/1.0 (-1) | 1,366 (+8%) | 5mo | $195,000 | $143 | 55 |
| 36 Hickory St | 0.26mi | 4/3.0 (+1) | 1,400 (+11%) | 7mo | $200,000 | $143 | 52 |
| 80 Parker St | 0.28mi | 4/2.5 (+1) | 1,080 (-14%) | 2mo | $206,250 | $191 | 52 |
| 407 Short Canal St | 0.54mi | 2/1.0 (-1) | 1,178 (-6%) | 9mo | $60,000 | $51 | 49 |
| 44 Greeley Ave | 0.73mi | 2/1.0 (-1) | 1,224 (-3%) | 9mo | $75,000 | $61 | 47 |
| 7 Spring Street Ext | 0.62mi | 3/2.0 | 1,384 (+10%) | 10mo | $175,000 | $126 | 45 |
| 6004 Sawyer St | 0.67mi | 2/1.0 (-1) | 1,087 (-14%) | 8mo | $51,000 | $47 | 33 |
Match score weights: distance 35% · size 25% · config 20% · recency 20%. Top-matched comps best support the ARV.
Projected returns pro-forma
-3.0% appreciation · 3.0% rent growth · sell at horizon
- IRR
- 2.9%
- Equity multiple
- 1.11×
- Total profit
- $3,877
- Equity at exit
- $18,638
- IRR
- 12.4%
- Equity multiple
- 1.99×
- Total profit
- $34,493
- Equity at exit
- $10,808
Cash invested: $35,000 (down + closing). Projections, not guarantees.
Landlord ↔ Tenant lean methodology
- Overall (STATE)
- 62 Landlord-Friendly
- State Pennsylvania
- 62 Landlord-Friendly · EVEN
- County
- — inherits STATE
- City
- — inherits STATE
ZIP-level market 15223
- Home prices YoY
- -28.0%
- Active inventory
- 23
- Price-to-rent
- 6.7×
Monthly cashflow live
- Estimated rent
- $1,557 high interval (Pro) →
- Mortgage (P&I)
- −$656
- Tax from tax record
- −$144 /mo · $1,725/yr
- Insurance
- −$52
- HOA
- −$0
- Vacancy / Maint / Mgmt
- −$327
- Net cashflow
- $379
Break-even live
UW: 25.0% down · 7.5% · 30yr · 1.5% tax · 5.0% vac · 8.0% maint · 8.0% mgmt
Financing live
Cash to close
- Down payment
- $31,250
- Closing costs
- $3,750
- Reserves months
- —
- Total cash needed
- —
Loan-product check · same deal, 3 products live
Conventional
25% down · 7.5% · 30yr
- Down + closing
- —
- Monthly P&I
- —
- Monthly cashflow
- —
- DSCR
- —
- Eligible?
- —
Personal DTI + credit; lowest rate.
DSCR
20% down · 8.5% · 30yr
- Down + closing
- —
- Monthly P&I
- —
- Monthly cashflow
- —
- DSCR
- —
- Eligible?
- —
No personal income docs; deal must DSCR.
Hard money
10% down · 12.0% · 12mo
- Down + closing
- —
- Monthly P&I
- —
- Monthly cashflow
- —
- DSCR
- —
- Eligible?
- —
Short-term bridge; refi at stabilization.
Rent comps 12 comps
| Address | Beds | Baths | Sqft | Rent | $/sqft | DOM | Units | Dist |
|---|---|---|---|---|---|---|---|---|
| 39 Prospect St Pittsburgh, PA | 2.0 | 1.0 | 1056 | $1,200 | $1.14 | 7d | 1 | 0.09mi |
| 621 Butler St Unit BS Pittsburgh, PA | 2.0 | 1.0 | 1000 | $995 | $0.99 | 43d | 1 | 0.54mi |
| 160 56th St Pittsburgh, PA | 3.0 | 3.0 | 1737 | $3,900 | $2.25 | 19d | 1 | 0.73mi |
| 553 Foundry St Pittsburgh, PA | 2.0 | 2.0 | 1025 | $1,650 | $1.61 | 21d | 1 | 0.74mi |
| 404 Reetz St Pittsburgh, PA | 4.0 | 1.0 | 1500 | $2,050 | $1.37 | 16d | 1 | 0.76mi |
| 14 Bethany Dr Unit A Pittsburgh, PA | 2.0 | 1.5 | 1032 | $1,650 | $1.60 | 43d | 1 | 0.87mi |
| 5275 Butler St Pittsburgh, PA | 2.0 | 1.0–2.0 | 885 | $4,076 | $4.61 | 1d | 130 | 0.97mi |
| 5264 Dresden Way Pittsburgh, PA | 2.0 | 2.0 | 1853 | $2,500 | $1.35 | 23d | 1 | 0.98mi |
| 20 Beyrleye Ave Pittsburgh, PA | 3.0 | 2.0 | 1100 | $1,350 | $1.23 | 23d | 1 | 0.98mi |
| 207 Mary St Sharpsburg, PA | 3.0 | 1.0 | 1100 | $1,395 | $1.27 | 23d | 1 | 1.05mi |
| 209 Mary St Sharpsburg, PA | 3.0 | 1.0 | 1100 | $1,395 | $1.27 | 23d | 1 | 1.05mi |
| 212 Hugel Dr Unit 1 Pittsburgh, PA | 2.0 | 1.0 | 1200 | $1,450 | $1.21 | 23d | 1 | 1.19mi |
Listing history 27 events
-
2026-06-18days on market $124,999 Active 97 DOM
-
2026-06-17days on market $124,999 Active 96 DOM
-
2026-06-16days on market $124,999 Active 95 DOM
-
2026-06-15price $124,999 Active 94 DOM
-
2026-06-15days on market $125,000 Active 94 DOM
-
2026-06-13days on market $125,000 Active 92 DOM
-
2026-06-13days on market $125,000 Active 91 DOM
-
2026-06-09days on market $125,000 Active 88 DOM
-
2026-06-08days on market $125,000 Active 87 DOM
-
2026-06-07days on market $125,000 Active 86 DOM
-
2026-06-03days on market $125,000 Active 82 DOM
-
2026-06-02days on market $125,000 Active 81 DOM
-
2026-06-01days on market $125,000 Active 80 DOM
-
2026-05-31days on market $125,000 Active 79 DOM
-
2026-03-13$125,000 Active 558-char remark
Show marketing remark (558 chars)
Welcome to this completely overhauled 3-bedroom home located in the Shaler Area School District! This move-in-ready property has been updated from top to bottom, featuring brand new appliances, a modern kitchen with stylish vinyl flooring throughout, and plenty of natural light. Enjoy a welcoming front porch entrance and a side porch ideal for relaxing. Whether you're a first-time buyer looking for your starter home or an investor searching for a turn-key rental, this property checks all the boxes. Don’t miss your chance to own this updated home.
-
2025-11-07$125,000 Active 558-char remark
Show marketing remark (558 chars)
Welcome to this completely overhauled 3-bedroom home located in the Shaler Area School District! This move-in-ready property has been updated from top to bottom, featuring brand new appliances, a modern kitchen with stylish vinyl flooring throughout, and plenty of natural light. Enjoy a welcoming front porch entrance and a side porch ideal for relaxing. Whether you're a first-time buyer looking for your starter home or an investor searching for a turn-key rental, this property checks all the boxes. Don’t miss your chance to own this updated home.
-
2025-08-03historical Expired
-
2025-07-15price $139,000
-
2025-07-05price $149,000
-
2025-06-26$159,000 Active
-
2024-04-11price $29,500
-
2024-02-16$29,900 Active
-
2023-12-07soldstatus $74,664
-
2023-12-04soldstatus $15,000 Closed
-
2023-10-15status Pending
-
2023-10-05price $17,500
-
2023-09-18$19,900 Active
ⓘ Source: listings_history table (triggers on properties + properties_extension) + one-shot
backfill from property_details.listing_events for pre-trigger history.
Tax reassessment forecast PA · Partial reset (capped growth)
- Current annual tax
- $1,725 · $144/mo
- Projected year-2 tax
- $1,850 · $154/mo
- Expected delta
- +$125/yr (+$10/mo · 7.3%)
ⓘ Screening estimate from a state-policy table — verify with the county assessor before closing.
Climate risk First Street
- Flood 5/10 Major FEMA zone X (unshaded) · 24% chance over 30 yrs
- Wildfire 1/10 Low
- Heat 4/10 Moderate 7 d/yr ≥98°F today · 18 d/yr by 30 yrs out
- Wind 2/10 Low
- Air quality 4/10 Moderate 5 unhealthy d/yr today · 7 by 30 yrs out
Nearby sold comps map
Loading sold comps map…
Walkable amenities ~0.75 mi
Loading nearby amenities…
Taxation est. · year 1
- Rental income
- $18,683
- − Mortgage interest
- −$7,002
- − Property taxes
- −$1,725
- − Insurance
- −$625
- − Repairs & maintenance
- −$1,495
- − Management
- −$1,495
- − Depreciation
- −$3,636
- Taxable income
- $2,706
- Est. tax owed @ 24.0%
- −$649
- After-tax cash flow
- $3,894/yr
For passive investors: Depreciation is non-cash, so a rental often shows a tax loss while cash-flowing — sheltering income. Rental losses are passive: they offset passive income freely, and up to $25,000/yr can offset ordinary (W-2) income if you actively participate and your MAGI is under $100k (phasing out to $0 by $150k); unused losses carry forward. On sale, claimed depreciation is recaptured at up to 25%, and gains may owe capital-gains tax (a 1031 exchange can defer both). Figures are a year-1 estimate at your 24.0% rate — not tax advice; consult a CPA.
Schools (NCES district)
- District
- Shaler Area SD
- NCES district ID
- 4221200
- Math proficiency
- 36% ▼ -16.00%
- Reading proficiency
- 59% ▼ -15.00%
- Median HH income
- $57,411
- Composite
- 41.33/100
- National rank
- #3506
- State rank
- #208 of 539 in PA
Livability — Etna
- Score
- 81/100
- State rank
- #172
- US rank
- #1441
Category grades
Schools grade is shown separately in the Schools card above.
Census & demographics
- Census place
- Etna, PA
- County
- Allegheny County · 1,022,028 people
- City population
- 6,255
- Metro
- Pittsburgh, PA
- Population (ZIP)
- 6,255
- Household income
- $61,083
- Rent vs Own
- Severe rent burden
- 266.0
Population outlook (Allegheny County) Hauer SSP2
- Today (2025)
- 1,250,282 people
- By 2030
- 1,256,482 · +0.5%
- By 2040
- 1,256,318 · +0.5%
- By 2050
- 1,244,169 · -0.5%
- By 2075
- 1,197,693 · -4.2%
- By 2100
- 1,093,187 · -12.6%
Race, ethnicity, and origin ACS 2023
- Neighborhood character
- Predominantly White (89%)
- Race & ethnicity
- White 89% Two or more races 7% Hispanic / Latino 2% Black 2%
- Common ancestry
- Romanian 15% Lithuanian 4% Italian 4%
- Foreign-born
- 2% · Canada
- Languages at home
- 96% English-only · Russian/Polish/Slavic 2% Spanish 1%
Political lean MEDSL · Allegheny
- 2024 margin
- Strong D (+20.3) · D 59.7% · R 39.4%
- 2008→2024 swing
- +4.8pp toward D · 2008: 15.5pp · 2024: 20.3pp
- All cycles
- 2024: D+20.3 2020: D+20.4 2016: D+16.4 2012: D+14.4 2008: D+15.5
Not yet ingested
- Civics
- —
Market trends
- HPI YoY
- ▼ -98.96%
- Current HPI
- 254.2648
- Rent YoY
- —
- Metro
- Pittsburgh, PA
- State GDP YoY
- ▲ 1.68%
- F500 in state
- 34
Industry mix (Fortune 500 HQ in PA)
| Industry | F500 HQs | Revenue |
|---|---|---|
| Healthcare | 2 | $309B |
|
||
| Insurance | 2 | $27B |
|
||
| Telecommunications / Media | 1 | $124B |
|
||
| Industrial Distribution | 1 | $22B |
|
||
| Financial Services | 1 | $20B |
|
||
| Chemicals / Materials | 1 | $18B |
|
||
Price history
+528.1% since first listed13 events — show timeline
- 2026-03-13 Listed $125,000 West Penn MLS
- 2025-11-07 Listed $125,000 West Penn MLS
- 2025-08-03 Delisted — West Penn MLS
- 2025-07-15 Price Changed $139,000 West Penn MLS
- 2025-07-05 Price Changed $149,000 West Penn MLS
- 2025-06-26 Listed $159,000 West Penn MLS
- 2024-04-11 Price Changed $29,500 West Penn MLS
- 2024-02-16 Listed $29,900 West Penn MLS
- 2023-12-07 Sold (Public Records) $74,664 Public Records
- 2023-12-04 Sold (MLS) $15,000 West Penn MLS
- 2023-10-15 Pending — West Penn MLS
- 2023-10-05 Price Changed $17,500 West Penn MLS
- 2023-09-18 Listed $19,900 West Penn MLS
Property tax history
+5.8%/yrLatest (2026): $1,725 · +0.0% YoY. Source: county tax records.
Cash-flow waterfall
monthlySold comps — $/sqft
last 12 mo · ≤1 miLoading sold comps…