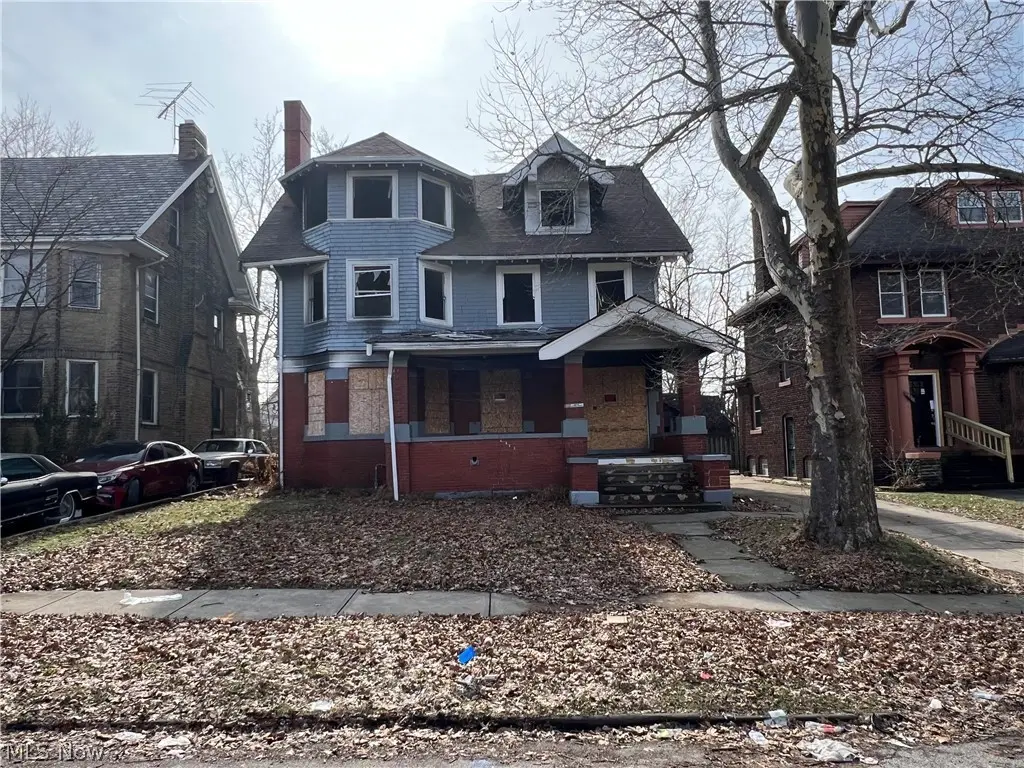
1822 Farmington Rd · East Cleveland, OH
Flood risk 1/10 · Minimal
- FEMA flood zone
- X (unshaded)
- Chance of flooding over 30 yrs
- 0.0%
- Est. flood insurance / yr
- $473 – $860
Fire risk 1/10 · Minimal
- Est. fire insurance / yr
- $713 – $1,323
Heat risk 3/10 · Minor
- Hot days now (above 95°F)
- 7 days/yr
- Hot days in 30 yrs
- 17 days/yr
Wind risk 1/10 · Minimal
- Chance of severe wind over 30 yrs
- —
Air-quality risk 3/10 · Minor
- Unhealthy air days now
- 3 days/yr
- Unhealthy air days in 30 yrs
- 5 days/yr
Risk factors via First Street. Map © Google.
Why this score? — see what drove the B- grade
The composite is a weighted blend of 9 inputs, each scored 0–100. Each bar is that input's sub-score; the figure is the points it added to the 100-point composite (weight × sub-score).
- Cash flow +30.0/30.0
- 1% rule +10.0/10.0
- DSCR +10.0/10.0
- ARV discount +7.5/15.0
- Rent growth +3.8/5.0
- Livability +3.3/5.0
- Condition / age +2.5/5.0
- Schools +0.7/10.0
- Appreciation +0.0/10.0
$50,000
🖨 Deal sheet (PDF) 📄 Offer letter ✓ Due diligence
Listing remarks MLS
This property is bursting with potential and ready for its next chapter. Whether you're an investor looking for your next project or a homebuyer with a vision, this is the perfect opportunity for new construction or a full-scale rehab. The canvas is blank, and the possibilities are wide open. Located in an up-and-coming area often referred to as “Millionaire’s Row, ” the neighborhood is surrounded by strong comps and ongoing development—ideal for maximizing future value. Bring your creativity, your contractor, and your imagination. Opportunities like this don’t sit long. Call me today, or have your agent bring an offer
Key facts
- Full-scale rehab
- Up-and-coming area
- Strong comps
Tags
Neighborhood map
What this means for you Summary
Snapshot
- This is a 4-bed/1.5-bath single-family listed at $50k.
Deal economics
- At list price, monthly cash flow is $863 ($10k/yr) — positive.
- The deal already cash-flows at list — no discount required.
- Meets the 1% rule at list price ($2k rent vs $50k).
- Recommended offer: $46k (9.0% below list) — sets the bar for market timing.
- Cap rate 27.0% vs local median 17.3% in East Cleveland — top-decile yield for the area; either an underpriced asset or a hidden risk that comps aren't pricing in. Stress-test before assuming the spread holds.
Location & tenants
- Location reads 66/100 on livability (#650 in OH) — a middle-class / working-renter tenant base. Strengths: commute A+, cost of living A+, health & safety A+; Watch: crime F, employment F.
- East Cleveland City School District (suburban): math 4% / reading 17% proficiency, ranked #652 of 656 in OH (top 99%) — low school quality limits family demand, transient renter base, plan for 1-2y turnover; 92% free/reduced lunch — lower-income household profile, screen leases tightly.
- Zoned schools: Caledonia Elementary School (246 students, 0% FRL); W.H. Kirk Middle School (math 6% / reading 15%, grade F, #642 of 654 statewide, top 98%, 291 students, 0% FRL); Shaw High School (math 2% / reading 27%, grade F, #706 of 781 statewide, top 92%, 541 students, 0% FRL) — zoned schools average 0% FRL vs 92% district-wide (92 pts lower); this property's tenant base skews higher-income than the district average.
- Market conditions: Rents rising fast (+5.2%/yr); 100 active listings in the ZIP; 8 comparable units currently listed for rent nearby; rentals at typical pace (median 19d on market — plan ~3-4 weeks tenant-placement turnaround); lower-income renter base — watch delinquency; 1,441 units permitted in Cuyahoga County in 2024 (700 in 5+ unit buildings).
- At $1,553/mo this rent would consume 65% of the median local household income ($29k/yr) (locally 1702% of renters already pay >50% of income on rent) — very limited rent-growth headroom before tenants either downsize or default.
Forward outlook
- Local home prices are declining (-3.0%/yr); year-one equity from $346 of loan paydown is wiped out by about $2k of value loss. Plan a longer hold.
- Cuyahoga County population projected to shrink 8% by 2050 — rents likely to lag national; underwrite the cash flow, not the appreciation.
- At projected returns (-3.0% appreciation + 5.2% rent growth), your $14k cash investment doubles in ~2 years — after that, you're playing with house money.
Negotiation context
- It's been on market 108 days — a 9% lower offer ($46k) is reasonable based on typical stale-listing flexibility.
- 2 sale attempts since 3y ago with the ask held roughly flat each time — persistent listings suggest the price (not the market) is what's stuck; bring a comps-based counter.
Risks & watch-outs
- Watch-outs: built in 1915 — expect roof / HVAC / electrical / plumbing capex.
Questions for the listing agent
- It's been on market 108 days. Have you received any prior offers? Is the seller open to a 9% concession, seller financing, or rate buy-down credit?
- Built in 1915 — when were the roof, HVAC, electrical panel, plumbing, and water heater last replaced?
- Why hasn't it sold? Are there any deal-killer items the seller is aware of (foundation, flood, title, zoning, code violations)?
- Is there a deadline driving the sale (1031 exchange, divorce, estate, relocation)? That informs how much negotiation room exists.
- Schools are F-rated, which usually means shorter tenancies and higher turnover. Who's the typical renter profile here, and what's been the actual vacancy rate?
- Crime grade is F in this area — have there been break-ins, vandalism, or insurance claims at this property in the last 3 years? What carrier currently insures it and at what premium?
- What's the average days-on-market for RENTAL listings here right now (not sales)? A rising rental-DOM trend means longer vacancies and softer asking-rent achievability than the comps imply.
- What's the recent tenant-quality profile in this submarket — average credit score on applications, eviction rate, late-payment / NSF rate, and stable-employment percentage? A property-management company in the area should have these aggregated.
- How much new for-sale + rental construction is in the pipeline within 1–3 miles? Heavy new supply typically softens prices + rents 12–24 months out; constrained supply supports both.
Investment metrics
- 1% rule
- 3.11% ✓
- Cap rate
- 27.01%
- Cash-on-cash
- 73.99%
- DSCR
- 4.29
- GRM
- 2.7
CMA / ARV
- ARV (median comp)
- $264,922
- List price
- $50,000
- Delta
- -81.13%
- Verdict
- UNDERPRICED
- Comps
- 18 within 1.0 mi
Projected returns pro-forma
-3.0% appreciation · 5.16% rent growth · sell at horizon
- IRR
- 76.3%
- Equity multiple
- 4.60×
- Total profit
- $50,363
- Equity at exit
- $7,455
- IRR
- 80.5%
- Equity multiple
- 10.26×
- Total profit
- $129,584
- Equity at exit
- $4,323
Cash invested: $14,000 (down + closing). Projections, not guarantees.
Landlord ↔ Tenant lean methodology
- Overall (STATE)
- 73 Landlord-Friendly
- State Ohio
- 73 Landlord-Friendly · R+6
- County
- — inherits STATE
- City
- — inherits STATE
ZIP-level market 44112
- Rents YoY
- 5.2%
- Active inventory
- 100
- Price-to-rent
- 2.7×
Monthly cashflow live
- Estimated rent
- $1,553 high interval (Pro) →
- Mortgage (P&I)
- −$262
- Tax from tax record
- −$81 /mo · $970/yr
- Insurance
- −$21
- HOA
- −$0
- Lot rent
- −$0
- Vacancy / Maint / Mgmt
- −$326
- Net cashflow
- $863
Break-even live
Sensitivity live
| Price | -10% $892 | -5% $877 | +0% $863 | +5% $849 | +10% $835 |
|---|---|---|---|---|---|
| Rent | -10% $741 | -5% $802 | +0% $863 | +5% $925 | +10% $986 |
| Rate | -1.0pp $888 | -0.5pp $876 | base $863 | +0.5pp $850 | +1.0pp $837 |
UW: 25.0% down · 7.5% · 30yr · 1.5% tax · 5.0% vac · 8.0% maint · 8.0% mgmt
Financing live
Cash to close
- Down payment
- $12,500
- Closing costs
- $1,500
- Reserves months
- —
- Total cash needed
- —
Loan-product check · same deal, 3 products live
Conventional
25% down · 7.5% · 30yr
- Down + closing
- —
- Monthly P&I
- —
- Monthly cashflow
- —
- DSCR
- —
- Eligible?
- —
Personal DTI + credit; lowest rate.
DSCR
20% down · 8.5% · 30yr
- Down + closing
- —
- Monthly P&I
- —
- Monthly cashflow
- —
- DSCR
- —
- Eligible?
- —
No personal income docs; deal must DSCR.
Hard money
10% down · 12.0% · 12mo
- Down + closing
- —
- Monthly P&I
- —
- Monthly cashflow
- —
- DSCR
- —
- Eligible?
- —
Short-term bridge; refi at stabilization.
Rent comps 8 comps
| Address | Beds | Baths | Sqft | Rent | $/sqft | DOM | Units | Dist |
|---|---|---|---|---|---|---|---|---|
| 1641 Coventry Rd Cleveland, OH | 3.0 | 1.0 | 1848 | $1,200 | $0.65 | 19d | 1 | 0.68mi |
| 12314 Mayfield Rd Cleveland, OH | 3.0 | 2.5 | 2033 | $3,859 | $1.90 | 0d | 9 | 0.76mi |
| 1215 E 113th St Cleveland, OH | 4.0 | 2.0 | 3502 | $1,800 | $0.51 | 19d | 1 | 0.84mi |
| 2580 Overlook Rd Cleveland, OH | 3.0 | 1.0–2.0 | 1125 | $1,880 | $1.67 | 0d | 15 | 0.85mi |
| 2460 Euclid Heights Blvd Cleveland, OH | 5.0 | 2.0 | 2216 | $600 | $0.27 | 19d | 1 | 1.09mi |
| 1796 Cumberland Rd Cleveland Heights, OH | 4.0 | 2.5 | 2100 | $1,800 | $0.86 | 20d | 1 | 1.39mi |
| 15801 Hazel Rd Cleveland, OH | 3.0 | 1.5 | 1908 | $1,550 | $0.81 | 19d | 1 | 1.47mi |
| 2280 Grandview Ave Cleveland, OH | 5.0 | 1.5 | 2500 | $2,000 | $0.80 | 10d | 1 | 1.50mi |
Listing history 24 events
-
2026-06-22days on market $50,000 Active 108 DOM
-
2026-06-21days on market $50,000 Active 107 DOM
-
2026-06-18days on market $50,000 Active 104 DOM
-
2026-06-17days on market $50,000 Active 103 DOM
-
2026-06-16days on market $50,000 Active 102 DOM
-
2026-06-15days on market $50,000 Active 101 DOM
-
2026-06-13days on market $50,000 Active 99 DOM
-
2026-06-13days on market $50,000 Active 98 DOM
-
2026-06-09days on market $50,000 Active 95 DOM
-
2026-06-08days on market $50,000 Active 94 DOM
-
2026-06-07days on market $50,000 Active 93 DOM
-
2026-06-05days on market $50,000 Active 90 DOM
-
2026-06-03days on market $50,000 Active 89 DOM
-
2026-06-02days on market $50,000 Active 88 DOM
-
2026-06-01days on market $50,000 Active 87 DOM
-
2026-05-31days on market $50,000 Active 86 DOM
-
2026-03-04$50,000 Active 656-char remark
Show marketing remark (656 chars)
This property is bursting with potential and ready for its next chapter. Whether you're an investor looking for your next project or a homebuyer with a vision, this is the perfect opportunity for new construction or a full-scale rehab. The canvas is blank, and the possibilities are wide open. Located in an up-and-coming area often referred to as “Millionaire’s Row, ” the neighborhood is surrounded by strong comps and ongoing development—ideal for maximizing future value. Bring your creativity, your contractor, and your imagination. Opportunities like this don’t sit long. Call me today, or have your agent bring an offer
-
2023-06-02soldstatus $100,000 Closed 341-char remark
Show marketing remark (341 chars)
Welcome to this spacious 4 bedroom Colonial! Complete with many updates, including newer PEX plumbing, new hot water tank, new interior doors, remodeled bath, some newer lighting and electrical, newer garage entry and overhead door, and newer flooring through-out. Great for investors or owner occupant. Definitely a "must see"!!!
-
2023-06-02soldstatus $100,000
Show marketing remark (341 chars)
Welcome to this spacious 4 bedroom Colonial! Complete with many updates, including newer PEX plumbing, new hot water tank, new interior doors, remodeled bath, some newer lighting and electrical, newer garage entry and overhead door, and newer flooring through-out. Great for investors or owner occupant. Definitely a "must see"!!!
-
2023-04-27status Pending 341-char remark
Show marketing remark (341 chars)
Welcome to this spacious 4 bedroom Colonial! Complete with many updates, including newer PEX plumbing, new hot water tank, new interior doors, remodeled bath, some newer lighting and electrical, newer garage entry and overhead door, and newer flooring through-out. Great for investors or owner occupant. Definitely a "must see"!!!
-
2023-04-07$45,500 Active 341-char remark
Show marketing remark (341 chars)
Welcome to this spacious 4 bedroom Colonial! Complete with many updates, including newer PEX plumbing, new hot water tank, new interior doors, remodeled bath, some newer lighting and electrical, newer garage entry and overhead door, and newer flooring through-out. Great for investors or owner occupant. Definitely a "must see"!!!
-
2023-02-07soldstatus $395,274
-
2021-07-02soldstatus $55,000
-
1987-03-17soldstatus $52,000
ⓘ Source: listings_history table (triggers on properties + properties_extension) + one-shot
backfill from property_details.listing_events for pre-trigger history.
Tax reassessment forecast OH · Partial reset (capped growth)
- Current annual tax
- $970 · $81/mo
- Projected year-2 tax
- $970 · $81/mo
- Expected delta
- $0/yr ($0/mo · 0.0%)
ⓘ Screening estimate from a state-policy table — verify with the county assessor before closing.
Climate risk First Street
- Flood 1/10 Low FEMA zone X (unshaded) · 0% chance over 30 yrs
- Wildfire 1/10 Low
- Heat 3/10 Moderate 7 d/yr ≥95°F today · 17 d/yr by 30 yrs out
- Wind 1/10 Low
- Air quality 3/10 Moderate 3 unhealthy d/yr today · 5 by 30 yrs out
Nearby sold comps map
Loading sold comps map…
Walkable amenities ~0.75 mi
Loading nearby amenities…
Taxation est. · year 1
- Rental income
- $18,639
- − Mortgage interest
- −$2,801
- − Property taxes
- −$970
- − Insurance
- −$250
- − Repairs & maintenance
- −$1,491
- − Management
- −$1,491
- − Depreciation
- −$1,455
- Taxable income
- $10,182
- Est. tax owed @ 24.0%
- −$2,444
- After-tax cash flow
- $7,915/yr
For passive investors: Depreciation is non-cash, so a rental often shows a tax loss while cash-flowing — sheltering income. Rental losses are passive: they offset passive income freely, and up to $25,000/yr can offset ordinary (W-2) income if you actively participate and your MAGI is under $100k (phasing out to $0 by $150k); unused losses carry forward. On sale, claimed depreciation is recaptured at up to 25%, and gains may owe capital-gains tax (a 1031 exchange can defer both). Figures are a year-1 estimate at your 24.0% rate — not tax advice; consult a CPA.
Schools (NCES district)
- District
- East Cleveland City School District
- NCES district ID
- 3904390
- Math proficiency
- 4% ▼ -16.00%
- Reading proficiency
- 17% ▼ -13.00%
- Median HH income
- $22,726
- Composite
- 7.38/100
- National rank
- #9954
- State rank
- #652 of 656 in OH
Livability — East Cleveland
- Score
- 66/100
- State rank
- #650
- US rank
- #11510
Category grades
Schools grade is shown separately in the Schools card above.
Census & demographics
- Census place
- East Cleveland, OH
- County
- Cuyahoga County · 1,090,369 people
- City population
- 17,848
- Metro
- Cleveland-Elyria, OH
- Population (ZIP)
- 17,848
- Household income
- $28,799
- Rent vs Own
- Severe rent burden
- 1702.0
Population outlook (Cuyahoga County) Hauer SSP2
- Today (2025)
- 1,244,621 people
- By 2030
- 1,230,093 · -1.2%
- By 2040
- 1,189,108 · -4.5%
- By 2050
- 1,145,706 · -7.9%
- By 2075
- 1,076,557 · -13.5%
- By 2100
- 978,987 · -21.3%
Race, ethnicity, and origin ACS 2023
- Neighborhood character
- Predominantly Black (89%)
- Race & ethnicity
- Black 89% White 7% Two or more races 2% Hispanic / Latino 1%
- Common ancestry
- Lithuanian 1%
- Foreign-born
- 4% · Canada
- Languages at home
- 93% English-only · French/Haitian/Cajun 3% Spanish 2% Russian/Polish/Slavic 1%
Political lean MEDSL · Cuyahoga
- 2024 margin
- Solid D (+31.5) · D 65.4% · R 33.9%
- 2008→2024 swing
- -7.4pp toward R · 2008: 38.9pp · 2024: 31.5pp
- All cycles
- 2024: D+31.5 2020: D+34.1 2016: D+35.0 2012: D+38.7 2008: D+38.9
Not yet ingested
- Civics
- —
Market trends
- HPI YoY
- ▼ -115.61%
- Current HPI
- 67.2162
- Rent YoY
- ▲ 5.16%
- Metro
- Cleveland-Elyria, OH
- State GDP YoY
- ▲ 1.98%
- F500 in state
- 48
Industry mix (Fortune 500 HQ in OH)
| Industry | F500 HQs | Revenue |
|---|---|---|
| Insurance | 3 | $145B |
|
||
| Industrial Machinery | 3 | $49B |
|
||
| Financial Services | 3 | $24B |
|
||
| Consumer Goods | 2 | $93B |
|
||
| Aerospace / Defense | 2 | $47B |
|
||
| Utilities | 2 | $33B |
|
||
Price history
-3.8% since first listed8 events — show timeline
- 2026-03-04 Listed $50,000 MLSNOW
- 2023-06-02 Sold (Public Records) $100,000 Public Records
- 2023-06-02 Sold (MLS) $100,000 MLSNOW
- 2023-04-27 Pending — MLSNOW
- 2023-04-07 Listed $45,500 MLSNOW
- 2023-02-07 Sold (Public Records) $395,274 Public Records
- 2021-07-02 Sold (Public Records) $55,000 Public Records
- 1987-03-17 Sold (Public Records) $52,000 Public Records
Property tax history
-3.9%/yrLatest (2025): $970 · -30.5% YoY. Source: county tax records.
Cash-flow waterfall
monthlySold comps — $/sqft
last 12 mo · ≤1 miLoading sold comps…