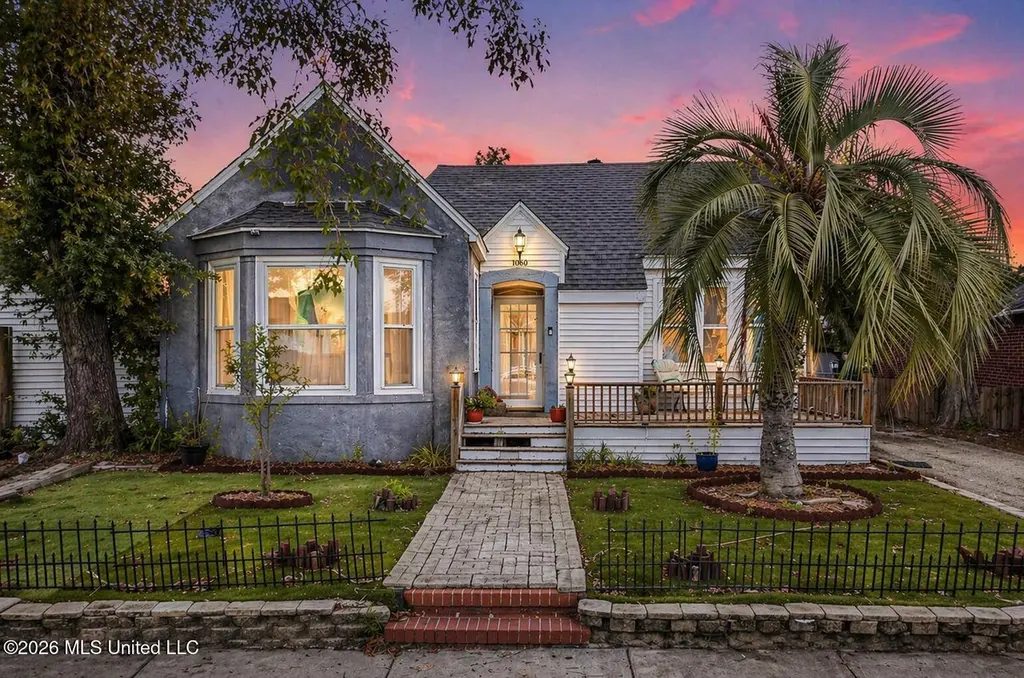
1090 Cherokee St · Biloxi, MS
Flood risk 5/10 · Moderate
- FEMA flood zone
- X (shaded)
- Chance of flooding over 30 yrs
- 0.34%
- Est. flood insurance / yr
- $507 – $1,088
Fire risk 1/10 · Minimal
- Est. fire insurance / yr
- $1,241 – $2,305
Heat risk 10/10 · Severe
- Hot days now (above 106°F)
- 7 days/yr
- Hot days in 30 yrs
- 22 days/yr
Wind risk 9/10 · Severe
- Chance of severe wind over 30 yrs
- 99.0%
Air-quality risk 2/10 · Minimal
- Unhealthy air days now
- 1 days/yr
- Unhealthy air days in 30 yrs
- 2 days/yr
Risk factors via First Street. Map © Google.
Why this score? — see what drove the D grade
The composite is a weighted blend of 9 inputs, each scored 0–100. Each bar is that input's sub-score; the figure is the points it added to the 100-point composite (weight × sub-score).
- Cash flow +16.4/30.0
- DSCR +5.1/10.0
- Schools +4.5/10.0
- Livability +4.0/5.0
- 1% rule +3.7/10.0
- ARV discount +2.5/15.0
- Rent growth +2.5/5.0
- Condition / age +2.5/5.0
- Appreciation +0.0/10.0
$259,000
🖨 Deal sheet 📄 Offer letter ✓ Due diligence
Listing remarks
Tucked away just minutes from Keesler Air Force Base and the heart of the Mississippi Gulf Coast, this beautifully updated home offers a rare mix of character, upgrades, and outdoor living. Located in a no flood zone, it also features a newer roof and updated HVAC system for added peace of mind. The backyard is where this property really shines. Designed for both relaxing and entertaining, you'll find a spacious deck overlooking a private in-ground pool surrounded by mature landscaping. The pool has been thoughtfully maintained with a liner less than a year old and a pump and filter replaced just two years ago. Inside, the home stands out from the typical cookie-cutter layout. The kitchen o
Key facts
- Updated hvac system
- Newer roof
- Spacious deck
Tags
Property features AI
Finance
- Other: Living area reported as 1,907 (per public records)
- HOA & community: Near entertainment
Exterior
- Parking: Driveway with space for 2 vehicles
- Utilities: Public water; Public sewer; Water connected; Sewer connected
- Home design: Single-family house; Two levels; Move-in ready
- Construction: Stucco construction; Asphalt shingle roof; Pilings/steel/wood and pillar/post/pier foundation; Built in two levels
- Exterior features: Private yard; Deck; Porch; Shed(s); Fenced; Near beach; In-ground private pool
Interior
- Kitchen: Dishwasher; Microwave; Refrigerator
- Bathrooms: 3 bathrooms
- Heating & cooling: Central heating (natural gas); Central air conditioning (electric)
- Interior features: Cathedral ceilings; Ceiling fans; Walk-in closets; Wet bar; Sliding doors; Electric fireplace
Neighborhood map
What this means for you Summary
Snapshot
- This is a 3-bed/1.0-bath single-family listed at $259k.
Deal economics
- At list price, monthly cash flow is $149 ($2k/yr) — positive.
- The deal already cash-flows at list — no discount required.
- To meet the 1% rule (rent ≥ 1% of price), the offer needs to be $227k (12.5% below list).
- Recommended offer: $227k (12.5% below list) — sets the bar for 1% rule.
- Cap rate 7.0% vs local median 3.5% in Biloxi — top-decile yield for the area; either an underpriced asset or a hidden risk that comps aren't pricing in. Stress-test before assuming the spread holds.
Location & tenants
- Location reads 79/100 on livability (#6 in MS, #2,141 nationally) — a middle-class / working-renter tenant base. Strengths: crime A+, cost of living A+, housing A+; Watch: commute D+, amenities F, employment D-.
- Biloxi Public School District (urban): math 60% / reading 48% proficiency, ranked #7 of 130 in MS (top 5%) — acceptable for families but not a draw, mixed tenant base, ~2y average lease.
- Zoned schools: Biloxi High School (math 65% / reading 53%, grade C+, #7 of 197 statewide, top 3%, 1,728 students, 100% FRL) — zoned schools average 100% FRL vs 59% district-wide (40 pts higher); higher-poverty schools than district average — tighter screening recommended.
- Market conditions: 164 active listings in the ZIP; 7 comparable units currently listed for rent nearby; rentals lingering (median 44d on market — plan ~5-8 weeks vacancy on turnover, expect pricing pressure); 71% of comp listings sitting > 30 days — soft ceiling on asking rent; lower-income renter base — watch delinquency; 2,194 units permitted in Harrison County in 2024 (0 in 5+ unit buildings).
- At $2,265/mo this rent would consume 66% of the median local household income ($41k/yr) (locally 329% of renters already pay >50% of income on rent) — very limited rent-growth headroom before tenants either downsize or default.
Forward outlook
- Local home prices are declining (-3.0%/yr); year-one equity from $2k of loan paydown is wiped out by about $8k of value loss. Plan a longer hold.
- Harrison County population projected at +27% by 2050 — long-run rental-demand tailwind backs the buy-and-hold thesis.
Negotiation context
- It's been on market 29 days — a 2% lower offer ($255k) is reasonable based on typical stale-listing flexibility.
- 4 sale attempts since 8y ago with the ask held roughly flat each time — persistent listings suggest the price (not the market) is what's stuck; bring a comps-based counter.
- Current owner paid $160k; list at $259k implies a 62% gain — meaningful room to come down on a strong offer.
Risks & watch-outs
- Watch-outs: built in 1920 — expect roof / HVAC / electrical / plumbing capex.
- Climate carrying-cost: moderate flood risk; severe wind risk, 99% chance of damaging wind over 30y; extreme-heat days projected 7→22/yr by 2055 (HVAC capex compounding) — expect insurance premiums to compound above CPI over the hold.
Questions for the listing agent
- Built in 1920 — when were the roof, HVAC, electrical panel, plumbing, and water heater last replaced?
- Is there a deadline driving the sale (1031 exchange, divorce, estate, relocation)? That informs how much negotiation room exists.
- The area grade is low — what's the realistic commute time and amenity access for the typical tenant pool here? Any planned neighborhood developments (good or bad) we should know about?
- What's the average days-on-market for RENTAL listings here right now (not sales)? A rising rental-DOM trend means longer vacancies and softer asking-rent achievability than the comps imply.
- What's the recent tenant-quality profile in this submarket — average credit score on applications, eviction rate, late-payment / NSF rate, and stable-employment percentage? A property-management company in the area should have these aggregated.
- How much new for-sale + rental construction is in the pipeline within 1–3 miles? Heavy new supply typically softens prices + rents 12–24 months out; constrained supply supports both.
Investment metrics
- 1% rule
- 0.87% ✗
- Cap rate
- 6.98%
- Cash-on-cash
- 2.46%
- DSCR
- 1.11
- GRM
- 9.5
CMA / ARV
- ARV (median comp)
- $232,948
- List price
- $259,000
- Delta
- 19.77%
- Verdict
- OVERPRICED
- Comps
- 20 within 1.0 mi
Show comp detail 7 sales within ~0.75 mi
| Address | Dist | Beds/Ba | Sqft | Sold | Price | $/sf | Match |
|---|---|---|---|---|---|---|---|
| 1059 Lafayette St | 0.42mi | 3/3.0 | 1,920 (+1%) | 6mo | $179,900 | $94 | 66 |
| 344 Porter Ave | 0.13mi | 3/1.5 | 1,786 (-6%) | 24mo | $159,900 | $90 | 62 |
| 1062 Lafayette St | 0.44mi | 3/2.0 | 1,822 (-4%) | 13mo | $265,000 | $145 | 57 |
| 1059 Balboa St | 0.17mi | 3/1.5 | 1,635 (-14%) | 15mo | $275,000 | $168 | 54 |
| 1057 Cherokee St | 0.11mi | 3/2.0 | 1,687 (-12%) | 22mo | $359,000 | $213 | 54 |
| 941 Diaz Ave | 0.66mi | 4/2.0 (+1) | 1,971 (+3%) | 12mo | $199,900 | $101 | 45 |
| 123 Morrison Ave | 0.75mi | 4/2.5 (+1) | 1,992 (+4%) | 11mo | $295,000 | $148 | 38 |
Match score weights: distance 35% · size 25% · config 20% · recency 20%. Top-matched comps best support the ARV.
Projected returns pro-forma
-3.0% appreciation · 3.0% rent growth · sell at horizon
- IRR
- -12.4%
- Equity multiple
- 0.55×
- Total profit
- $-32,560
- Equity at exit
- $38,618
- IRR
- -3.4%
- Equity multiple
- 0.77×
- Total profit
- $-16,397
- Equity at exit
- $22,394
Cash invested: $72,520 (down + closing). Projections, not guarantees.
Landlord ↔ Tenant lean methodology
- Overall (STATE)
- 90 Strongly Landlord-Friendly
- State Mississippi
- 90 Strongly Landlord-Friendly · R+11
- County
- — inherits STATE
- City
- — inherits STATE
ZIP-level market 39530
- Active inventory
- 164
- Price-to-rent
- 9.5×
Monthly cashflow live
- Estimated rent
- $2,265 high interval (Pro) →
- Mortgage (P&I)
- −$1,358
- Tax from tax record
- −$175 /mo · $2,097/yr
- Insurance
- −$108
- HOA
- −$0
- Vacancy / Maint / Mgmt
- −$476
- Net cashflow
- $149
Break-even live
UW: 25.0% down · 7.5% · 30yr · 1.5% tax · 5.0% vac · 8.0% maint · 8.0% mgmt
Financing live
Cash to close
- Down payment
- $64,750
- Closing costs
- $7,770
- Reserves months
- —
- Total cash needed
- —
Loan-product check · same deal, 3 products live
Conventional
25% down · 7.5% · 30yr
- Down + closing
- —
- Monthly P&I
- —
- Monthly cashflow
- —
- DSCR
- —
- Eligible?
- —
Personal DTI + credit; lowest rate.
DSCR
20% down · 8.5% · 30yr
- Down + closing
- —
- Monthly P&I
- —
- Monthly cashflow
- —
- DSCR
- —
- Eligible?
- —
No personal income docs; deal must DSCR.
Hard money
10% down · 12.0% · 12mo
- Down + closing
- —
- Monthly P&I
- —
- Monthly cashflow
- —
- DSCR
- —
- Eligible?
- —
Short-term bridge; refi at stabilization.
Rent comps 7 comps
| Address | Beds | Baths | Sqft | Rent | $/sqft | DOM | Units | Dist |
|---|---|---|---|---|---|---|---|---|
| 185 Saint Jude St Biloxi, MS | 3.0 | 2.0 | 1554 | $1,875 | $1.21 | 44d | 1 | 0.85mi |
| 1324 Beach Blvd Biloxi, MS | 3.0 | 3.0 | 2218 | $4,200 | $1.89 | 44d | 1 | 1.01mi |
| 145 Saint Francis St Biloxi, MS | 2.0 | 2.0 | 1467 | $2,900 | $1.98 | 44d | 1 | 1.08mi |
| 620 Murray St Biloxi, MS | 3.0 | 1.5 | 1300 | $1,600 | $1.23 | 44d | 1 | 1.24mi |
| 271 Ebony Ln Biloxi, MS | 3.0 | 2.0 | 1498 | $1,600 | $1.07 | 13d | 1 | 1.24mi |
| 626 Water St Biloxi, MS | 3.0 | 2.0 | 1800 | $2,300 | $1.28 | 44d | 1 | 1.40mi |
| 626 Water St Biloxi, MS | 3.0 | 2.0 | 1800 | $2,200 | $1.22 | 21d | 1 | 1.40mi |
Listing history 26 events
-
2026-06-18days on market $259,000 Active 29 DOM
-
2026-06-17days on market $259,000 Active 28 DOM
-
2026-06-16days on market $259,000 Active 27 DOM
-
2026-06-15days on market $259,000 Active 26 DOM
-
2026-06-14days on market $259,000 Active 24 DOM
-
2026-06-13pricedays on market $259,000 Active 23 DOM
-
2026-06-09days on market $265,000 Active 20 DOM
-
2026-06-08days on market $265,000 Active 19 DOM
-
2026-06-07days on market $265,000 Active 18 DOM
-
2026-06-05days on market $265,000 Active 15 DOM
-
2026-06-03days on market $265,000 Active 14 DOM
-
2026-06-02days on market $265,000 Active 13 DOM
-
2026-06-01days on market $265,000 Active 12 DOM
-
2026-05-31days on market $265,000 Active 11 DOM
-
2026-05-30pricedays on market $265,000 Active 10 DOM
-
2026-05-02status Pending 1391-char remark
-
2026-04-27price $279,000 1391-char remark
-
2026-03-31$285,000 Active 1391-char remark
-
2025-07-31historical
-
2025-07-30$229,000 Active
-
2019-02-26soldstatus $160,000
-
2019-02-11soldstatus
-
2018-11-26$170,000
-
2018-04-26soldstatus $160,000
-
2010-03-30soldstatus
-
2009-07-13soldstatus
ⓘ Source: listings_history table (triggers on properties + properties_extension) + one-shot
backfill from property_details.listing_events for pre-trigger history.
Tax reassessment forecast MS · Resets to sale price
- Current annual tax
- $2,097 · $175/mo
- Projected year-2 tax
- $2,097 · $175/mo
- Expected delta
- $0/yr ($0/mo · 0.0%)
ⓘ Screening estimate from a state-policy table — verify with the county assessor before closing.
Climate risk First Street
- Flood 5/10 Major FEMA zone X (shaded) · 34% chance over 30 yrs
- Wildfire 1/10 Low
- Heat 10/10 Extreme 7 d/yr ≥106°F today · 22 d/yr by 30 yrs out
- Wind 9/10 Extreme 99% chance of damaging wind over 30 yrs
- Air quality 2/10 Low 1 unhealthy d/yr today · 2 by 30 yrs out
Nearby sold comps map
Loading sold comps map…
Walkable amenities ~0.75 mi
Loading nearby amenities…
Taxation est. · year 1
- Rental income
- $27,182
- − Mortgage interest
- −$14,508
- − Property taxes
- −$2,097
- − Insurance
- −$1,295
- − Repairs & maintenance
- −$2,175
- − Management
- −$2,175
- − Depreciation
- −$7,535
- Taxable loss
- −$2,601
- Est. tax savings @ 24.0%
- +$624
- After-tax cash flow
- $2,408/yr
For passive investors: Depreciation is non-cash, so a rental often shows a tax loss while cash-flowing — sheltering income. Rental losses are passive: they offset passive income freely, and up to $25,000/yr can offset ordinary (W-2) income if you actively participate and your MAGI is under $100k (phasing out to $0 by $150k); unused losses carry forward. On sale, claimed depreciation is recaptured at up to 25%, and gains may owe capital-gains tax (a 1031 exchange can defer both). Figures are a year-1 estimate at your 24.0% rate — not tax advice; consult a CPA.
Schools (NCES district)
- District
- Biloxi Public School District
- NCES district ID
- 2800630
- Math proficiency
- 60% ▼ -7.00%
- Reading proficiency
- 48% ▼ -3.00%
- Median HH income
- $40,608
- Composite
- 45.26/100
- National rank
- #2657
- State rank
- #7 of 130 in MS
Livability — Biloxi
- Score
- 79/100
- State rank
- #6
- US rank
- #2141
Category grades
Schools grade is shown separately in the Schools card above.
Census & demographics
- Census place
- Biloxi, MS
- County
- Harrison County · 178,171 people
- City population
- 63,281
- Metro
- Gulfport-Biloxi, MS
- Population (ZIP)
- 7,701
- Household income
- $41,117
- Rent vs Own
- Severe rent burden
- 329.0
Population outlook (Harrison County) Hauer SSP2
- Today (2025)
- 228,444 people
- By 2030
- 241,942 · +5.9%
- By 2040
- 267,531 · +17.1%
- By 2050
- 291,062 · +27.4%
- By 2075
- 346,711 · +51.8%
- By 2100
- 378,165 · +65.5%
Race, ethnicity, and origin ACS 2023
- Neighborhood character
- Diverse neighborhood (Simpson 0.66)
- Race & ethnicity
- White 48% Black 28% Hispanic / Latino 15% Two or more races 5% Asian 4% Native American 3%
- Hispanic origin (detail)
- Mexican 6%
- Common ancestry
- Lithuanian 9% Slovak 2% Italian 1%
- Foreign-born
- 13% · Canada, Vietnam
- Languages at home
- 82% English-only · Spanish 14% Vietnamese 2% Other Indo-European 1%
Political lean MEDSL · Harrison
- 2024 margin
- Strong R (+28.9) · D 35.0% · R 63.9% · Other 1.1%
- 2008→2024 swing
- -2.9pp toward R · 2008: -26.0pp · 2024: -28.9pp
- All cycles
- 2024: R+28.9 2020: R+25.2 2016: R+30.7 2012: R+26.6 2008: R+26.0
Not yet ingested
- Civics
- —
Market trends
- HPI YoY
- ▼ -108.19%
- Current HPI
- 181.0603
- Rent YoY
- —
- Metro
- Gulfport-Biloxi, MS
- State GDP YoY
- —
- F500 in state
- 0
Price history
+61.9% since first listed15 events — show timeline
- 2026-06-10 Price Changed $259,000 MLSU
- 2026-05-29 Price Changed $265,000 MLSU
- 2026-05-20 Listed $270,000 MLSU
- 2026-05-02 Pending — MLSU
- 2026-05-02 Listing Removed — MLSU
- 2026-04-27 Price Changed $279,000 MLSU
- 2026-03-31 Listed $285,000 MLSU
- 2025-07-31 Listing Removed — MLSU
- 2025-07-30 Listed $229,000 MLSU
- 2019-02-26 Sold (Public Records) $160,000 Public Records
- 2019-02-11 Sold (MLS) — MLSU
- 2018-11-26 Listed $170,000 MLSU
- 2018-04-26 Sold (Public Records) $160,000 Public Records
- 2010-03-30 Sold (Public Records) — Public Records
- 2009-07-13 Sold (Public Records) — Public Records
Property tax history
+24.8%/yrLatest (2025): $2,097 · +5.1% YoY. Source: county tax records.
Cash-flow waterfall
monthlySold comps — $/sqft
last 12 mo · ≤1 miLoading sold comps…