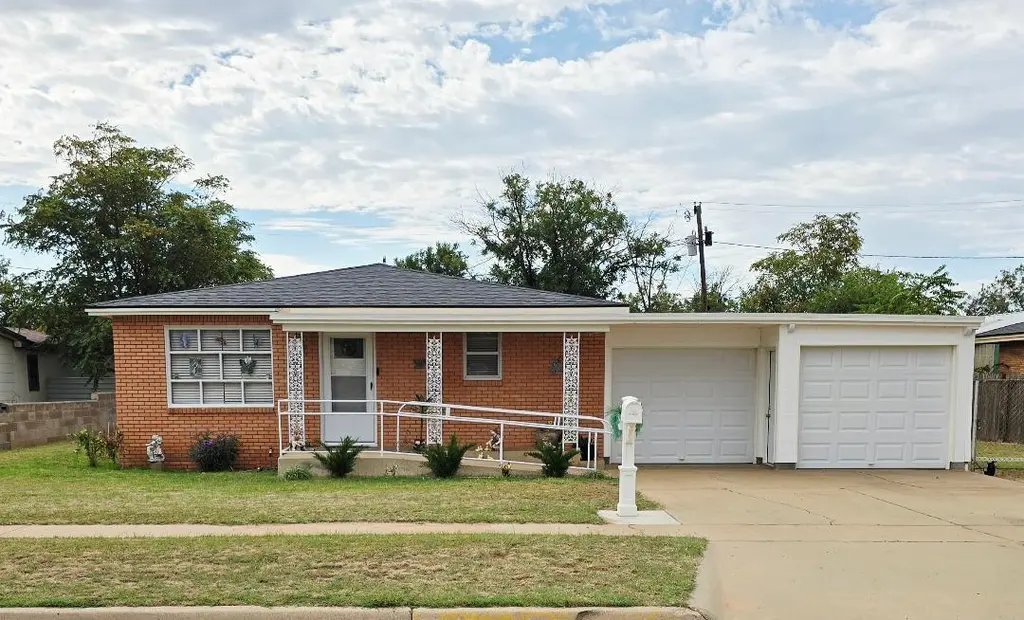
511 N 15th St · Lamesa, TX
Flood risk 1/10 · Minimal
- FEMA flood zone
- X (unshaded)
- Chance of flooding over 30 yrs
- 0.0%
- Est. flood insurance / yr
- $507 – $1,088
Fire risk 1/10 · Minimal
- Est. fire insurance / yr
- $1,222 – $2,270
Heat risk 5/10 · Moderate
- Hot days now (above 101°F)
- 7 days/yr
- Hot days in 30 yrs
- 20 days/yr
Wind risk 2/10 · Minimal
- Chance of severe wind over 30 yrs
- 1.0%
Air-quality risk 1/10 · Minimal
- Unhealthy air days now
- 0 days/yr
- Unhealthy air days in 30 yrs
- 0 days/yr
Risk factors via First Street. Map © Google.
Why this score? — see what drove the D grade
The composite is a weighted blend of 9 inputs, each scored 0–100. Each bar is that input's sub-score; the figure is the points it added to the 100-point composite (weight × sub-score).
- Cash flow +16.6/30.0
- ARV discount +7.5/15.0
- DSCR +5.2/10.0
- 1% rule +4.2/10.0
- Livability +3.5/5.0
- Rent growth +2.5/5.0
- Condition / age +2.5/5.0
- Schools +1.9/10.0
- Appreciation +0.0/10.0
$171,000
🖨 Deal sheet (PDF) 📄 Offer letter ✓ Due diligence
Listing remarks
Wonderful 3 bedroom 2 bath, 1530 sq ft home in Lamesa. This well maintained home shows pride of ownership. Lovely kitchen with new cabinets and countertops, range, dishwasher, gas stove and microwave(all kitchen appliances convey). Original hardwood flooring in all 3 bedrooms. Updated flooring in kitchen and bathrooms. New tankless water heater. Plumbing in both bathrooms has been updated to pvc and new glass shower doors installed, new cabinet in master bath. New front door and garage doors, Roof was updated in 2021 on home and shop. Storage exterior freshly painted. Cinder block 25x40 SHOP with water and electricity connected. Has a toilet, wash sink, brand new furnace(not yet connected)
Key facts
- New cabinets
- Updated flooring
- New countertops
Tags
Property features AI
Finance
- Other: Property type: Residential single family; Lot size approximately 0.24 acres; Road is paved and publicly maintained
Exterior
- Parking: Attached garage; 2 garage spaces; Driveway
- Security: Smoke detectors
- Utilities: Public water; Public sewer; Electricity connected; Natural gas connected; Natural gas available; Water connected; Solar
- Home design: Single family residence; Updated/remodeled; Single‑story; City street frontage; Faces front (garage orientation)
- Construction: Brick construction; Composition roof; Pillar/post/pier foundation; Built/updated (year not specified)
- Exterior features: Storage; Workshop; Front porch; Fenced yard with block and chain link sections and gate; Back yard
Interior
- Kitchen: Disposal; Dishwasher; Free‑standing gas range; Microwave; Refrigerator; Range hood
- Bedrooms: 6 total rooms (includes bedrooms and living spaces)
- Flooring: Ceramic tile; Carpet; Hardwood; Tile
- Bathrooms: 2 full bathrooms
- Heating & cooling: Central heating (natural gas); Central air conditioning (electric); Ceiling fans
- Interior features: Ceiling fans; Pantry; Storage
- Laundry & utility: Washer hookup; Electric dryer hookup; Electric water heater; Tankless water heater
Neighborhood map
What this means for you Summary
Snapshot
- This is a 3-bed/1.0-bath single-family listed at $171k.
Deal economics
- At list price, monthly cash flow is $104 ($1k/yr) — positive.
- The deal already cash-flows at list — no discount required.
- To meet the 1% rule (rent ≥ 1% of price), the offer needs to be $158k (7.9% below list).
- Recommended offer: $158k (7.9% below list) — sets the bar for 1% rule.
Location & tenants
- Location reads 69/100 on livability (#445 in TX) — a middle-class / working-renter tenant base. Strengths: cost of living A+, housing A+; Watch: health & safety C-, amenities F, commute F.
- Lamesa ISD (town): math 19% / reading 26% proficiency, ranked #755 of 826 in TX (top 91%) — low school quality limits family demand, transient renter base, plan for 1-2y turnover.
- Zoned schools: Lamesa Schools (math 19% / reading 26%, 1,588 students, 80% FRL) — zoned schools average 80% FRL vs 36% district-wide (43 pts higher); higher-poverty schools than district average — tighter screening recommended.
- Market conditions: 51 active listings in the ZIP; 2 comparable units currently listed for rent nearby; 1 units permitted in Dawson County in 2024 (0 in 5+ unit buildings).
Forward outlook
- Local home prices are declining (-3.0%/yr); year-one equity from $1k of loan paydown is wiped out by about $5k of value loss. Plan a longer hold.
Negotiation context
- It's been on market 20 days — a 2% lower offer ($168k) is reasonable based on typical stale-listing flexibility.
Risks & watch-outs
- Watch-outs: built in 1957 — expect roof / HVAC / electrical / plumbing capex.
- Climate carrying-cost: extreme-heat days projected 7→20/yr by 2055 (HVAC capex compounding) — expect insurance premiums to compound above CPI over the hold.
Questions for the listing agent
- Built in 1957 — when were the roof, HVAC, electrical panel, plumbing, and water heater last replaced?
- Is there a deadline driving the sale (1031 exchange, divorce, estate, relocation)? That informs how much negotiation room exists.
- Schools are D-rated, which usually means shorter tenancies and higher turnover. Who's the typical renter profile here, and what's been the actual vacancy rate?
- The area grade is low — what's the realistic commute time and amenity access for the typical tenant pool here? Any planned neighborhood developments (good or bad) we should know about?
- What's the average days-on-market for RENTAL listings here right now (not sales)? A rising rental-DOM trend means longer vacancies and softer asking-rent achievability than the comps imply.
- What's the recent tenant-quality profile in this submarket — average credit score on applications, eviction rate, late-payment / NSF rate, and stable-employment percentage? A property-management company in the area should have these aggregated.
- How much new for-sale + rental construction is in the pipeline within 1–3 miles? Heavy new supply typically softens prices + rents 12–24 months out; constrained supply supports both.
Investment metrics
- 1% rule
- 0.92% ✗
- Cap rate
- 7.02%
- Cash-on-cash
- 2.61%
- DSCR
- 1.12
- GRM
- 9.0
CMA / ARV
No comps found within radius.
Projected returns pro-forma
-3.0% appreciation · 3.0% rent growth · sell at horizon
- IRR
- -12.2%
- Equity multiple
- 0.56×
- Total profit
- $-21,083
- Equity at exit
- $25,497
- IRR
- -3.1%
- Equity multiple
- 0.79×
- Total profit
- $-9,830
- Equity at exit
- $14,785
Cash invested: $47,880 (down + closing). Projections, not guarantees.
Landlord ↔ Tenant lean methodology
- Overall (STATE)
- 87 Strongly Landlord-Friendly
- State Texas
- 87 Strongly Landlord-Friendly · R+5
- County
- — inherits STATE
- City
- — inherits STATE
ZIP-level market 79331
- Active inventory
- 51
- Price-to-rent
- 9.0×
Monthly cashflow live
- Estimated rent
- $1,576 medium interval (Pro) →
- Mortgage (P&I)
- −$897
- Tax from tax record
- −$173 /mo · $2,073/yr
- Insurance
- −$71
- HOA
- −$0
- Vacancy / Maint / Mgmt
- −$331
- Net cashflow
- $104
Break-even live
Sensitivity live
| Price | -10% $201 | -5% $152 | +0% $104 | +5% $56 | +10% $7 |
|---|---|---|---|---|---|
| Rent | -10% $-20 | -5% $42 | +0% $104 | +5% $166 | +10% $229 |
| Rate | -1.0pp $190 | -0.5pp $148 | base $104 | +0.5pp $60 | +1.0pp $15 |
UW: 25.0% down · 7.5% · 30yr · 1.5% tax · 5.0% vac · 8.0% maint · 8.0% mgmt
Financing live
Cash to close
- Down payment
- $42,750
- Closing costs
- $5,130
- Reserves months
- —
- Total cash needed
- —
Loan-product check · same deal, 3 products live
Conventional
25% down · 7.5% · 30yr
- Down + closing
- —
- Monthly P&I
- —
- Monthly cashflow
- —
- DSCR
- —
- Eligible?
- —
Personal DTI + credit; lowest rate.
DSCR
20% down · 8.5% · 30yr
- Down + closing
- —
- Monthly P&I
- —
- Monthly cashflow
- —
- DSCR
- —
- Eligible?
- —
No personal income docs; deal must DSCR.
Hard money
10% down · 12.0% · 12mo
- Down + closing
- —
- Monthly P&I
- —
- Monthly cashflow
- —
- DSCR
- —
- Eligible?
- —
Short-term bridge; refi at stabilization.
Rent comps 2 comps
| Address | Beds | Baths | Sqft | Rent | $/sqft | DOM | Units | Dist |
|---|---|---|---|---|---|---|---|---|
| 803 N 18th St Lamesa, TX | 3.0 | 2.0 | 1539 | $1,600 | $1.04 | 45d | 1 | 0.28mi |
| 214 N 23rd St Lamesa, TX | 3.0 | 2.0 | 1962 | $1,500 | $0.76 | 46d | 1 | 0.69mi |
Listing history 10 events
-
2026-06-09status $171,000 Pending 20 DOM
-
2026-06-08days on market $171,000 Active 20 DOM
-
2026-06-08days on market $171,000 Active 19 DOM
-
2026-06-05days on market $171,000 Active 17 DOM
-
2026-06-03days on market $171,000 Active 15 DOM
-
2026-06-02days on market $171,000 Active 14 DOM
-
2026-06-01days on market $171,000 Active 13 DOM
-
2026-05-31days on market $171,000 Active 12 DOM
-
2026-05-18$171,000 Active
-
2021-11-01soldstatus
ⓘ Source: listings_history table (triggers on properties + properties_extension) + one-shot
backfill from property_details.listing_events for pre-trigger history.
Tax reassessment forecast TX · Resets to sale price
- Current annual tax
- $2,073 · $173/mo
- Projected year-2 tax
- $3,129 · $261/mo
- Expected delta
- +$1,057/yr (+$88/mo · 51.0%)
ⓘ Screening estimate from a state-policy table — verify with the county assessor before closing.
Climate risk First Street
- Flood 1/10 Low FEMA zone X (unshaded) · 0% chance over 30 yrs
- Wildfire 1/10 Low
- Heat 5/10 Major 7 d/yr ≥101°F today · 20 d/yr by 30 yrs out
- Wind 2/10 Low 100% chance of damaging wind over 30 yrs
- Air quality 1/10 Low 0 unhealthy d/yr today · 0 by 30 yrs out
Nearby sold comps map
Loading sold comps map…
Walkable amenities ~0.75 mi
Loading nearby amenities…
Taxation est. · year 1
- Rental income
- $18,908
- − Mortgage interest
- −$9,579
- − Property taxes
- −$2,073
- − Insurance
- −$855
- − Repairs & maintenance
- −$1,513
- − Management
- −$1,513
- − Depreciation
- −$4,975
- Taxable loss
- −$1,598
- Est. tax savings @ 24.0%
- +$384
- After-tax cash flow
- $1,632/yr
For passive investors: Depreciation is non-cash, so a rental often shows a tax loss while cash-flowing — sheltering income. Rental losses are passive: they offset passive income freely, and up to $25,000/yr can offset ordinary (W-2) income if you actively participate and your MAGI is under $100k (phasing out to $0 by $150k); unused losses carry forward. On sale, claimed depreciation is recaptured at up to 25%, and gains may owe capital-gains tax (a 1031 exchange can defer both). Figures are a year-1 estimate at your 24.0% rate — not tax advice; consult a CPA.
Schools (NCES district)
- District
- Lamesa ISD
- NCES district ID
- 4826610
- Math proficiency
- 19% ▼ -15.00%
- Reading proficiency
- 26% ▬ 0.00%
- Median HH income
- $38,346
- Composite
- 18.85/100
- National rank
- #8862
- State rank
- #755 of 826 in TX
Livability — Lamesa
- Score
- 69/100
- State rank
- #445
- US rank
- #9067
Category grades
Schools grade is shown separately in the Schools card above.
Census & demographics
- Census place
- Lamesa, TX
- Population (ZIP)
- 11,751
Population outlook (Dawson County) Hauer SSP2
- Today (2025)
- 12,411 people
- By 2030
- 12,268 · -1.2%
- By 2040
- 12,260 · -1.2%
- By 2050
- 12,117 · -2.4%
- By 2075
- 11,504 · -7.3%
- By 2100
- 10,176 · -18.0%
Race, ethnicity, and origin ACS 2023
- Neighborhood character
- Diverse neighborhood (Simpson 0.57)
- Race & ethnicity
- Hispanic / Latino 56% White 34% Two or more races 24% Black 7%
- Hispanic origin (detail)
- Mexican 52%
- Common ancestry
- Lithuanian 2% Polish 2% Slovak 1%
- Foreign-born
- 6% · Canada
- Languages at home
- 65% English-only · Spanish 32% German/W. Germanic 2%
Political lean MEDSL · Dawson
- 2024 margin
- Solid R (+61.0) · D 19.0% · R 80.0%
- 2008→2024 swing
- -18.2pp toward R · 2008: -42.8pp · 2024: -61.0pp
- All cycles
- 2024: R+61.0 2020: R+56.6 2016: R+50.6 2012: R+43.2 2008: R+42.8
Not yet ingested
- Civics
- —
Market trends
- HPI YoY
- ▼ -76.06%
- Current HPI
- 135.9298
- Rent YoY
- —
- Metro
- —
- State GDP YoY
- ▲ 3.95%
- F500 in state
- 110
Industry mix (Fortune 500 HQ in TX)
| Industry | F500 HQs | Revenue |
|---|---|---|
| Energy | 16 | $1,198B |
|
||
| Technology | 5 | $198B |
|
||
| Engineering / Construction | 4 | $72B |
|
||
| Energy Services | 3 | $60B |
|
||
| Utilities | 3 | $41B |
|
||
| Healthcare | 2 | $330B |
|
||
Price history
2 events — show timeline
- 2026-05-18 Listed $171,000 LARMLS
- 2021-11-01 Sold (Public Records) — Public Records
Property tax history
+4.4%/yrLatest (2025): $2,073 · +3.2% YoY. Source: county tax records.
Cash-flow waterfall
monthlySold comps — $/sqft
last 12 mo · ≤1 miLoading sold comps…