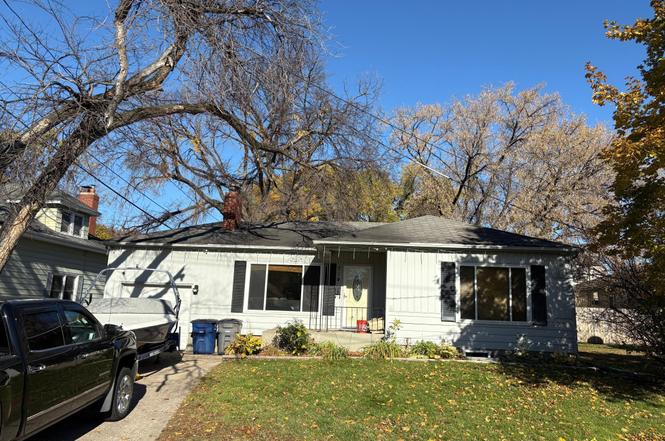
714 5th Ave S · Moorhead, MN
Flood risk 1/10 · Minimal
- FEMA flood zone
- X (unshaded)
- Chance of flooding over 30 yrs
- 0.0%
- Est. flood insurance / yr
- $473 – $860
Fire risk 1/10 · Minimal
- Est. fire insurance / yr
- $888 – $1,650
Heat risk 2/10 · Minimal
- Hot days now (above 98°F)
- 7 days/yr
- Hot days in 30 yrs
- 12 days/yr
Wind risk 2/10 · Minimal
- Chance of severe wind over 30 yrs
- —
Air-quality risk 3/10 · Minor
- Unhealthy air days now
- 3 days/yr
- Unhealthy air days in 30 yrs
- 3 days/yr
Risk factors via First Street. Map © Google.
Why this score? — see what drove the F grade
The composite is a weighted blend of 9 inputs, each scored 0–100. Each bar is that input's sub-score; the figure is the points it added to the 100-point composite (weight × sub-score).
- Cash flow +13.2/30.0
- DSCR +4.0/10.0
- 1% rule +3.9/10.0
- Livability +3.9/5.0
- Schools +3.7/10.0
- Rent growth +2.9/5.0
- Condition / age +2.5/5.0
- ARV discount +0.3/15.0
- Appreciation +0.0/10.0
$214,500
🖨 Deal sheet 📄 Offer letter ✓ Due diligence
Listing remarks MLS
Move-right in! This 2 bedroom rambler could easily be a 4 bedroom, with the addition of egress windows. Hardwood floors, decorator paint colors, wood blinds, no-maintenance metal siding, fenced yard and deck., Total SqFt: 987
Key facts
- Wood deck
- Newer furnace
- Patio
Tags
Property features AI
Finance
- Financial info: Standard rental license (property is licensed for rental)
Exterior
- Parking: Attached garage (1 car)
- Utilities: City water (connected); City sewer (connected); Natural gas
- Home design: Residential property; One-story; Main-level living area layout
- Construction: Block foundation; Above and below grade finished living areas (total living area 1,990)
- Exterior features: Full yard fencing; Lot size approximately 5,456 square feet
Interior
- Kitchen: Kitchen on main level
- Bedrooms: 4 bedrooms (all on main level)
- Bathrooms: 1 full bathroom; 1 three-quarter bathroom
- Heating & cooling: Forced air heating; Central air conditioning
- Interior features: Finished basement with block foundation; Full fenced yard; Deck; Patio; Storage room; Wood-burning fireplace (1)
- Laundry & utility: Laundry in basement
Neighborhood map
What this means for you Summary
Snapshot
- This is a 4-bed/2.0-bath single-family listed at $214k.
Deal economics
- At list price, monthly cash flow is $-3 ($-38/yr) — negative.
- To cash-flow at today's rent, offer at most $214k (0.3% below list).
- To meet the 1% rule (rent ≥ 1% of price), the offer needs to be $190k (11.5% below list).
- Recommended offer: $189k (12.0% below list) — sets the bar for market timing.
- Cap rate 6.3% vs local median 3.7% in Moorhead — top-decile yield for the area; either an underpriced asset or a hidden risk that comps aren't pricing in. Stress-test before assuming the spread holds.
Location & tenants
- Location reads 77/100 on livability (#143 in MN, #3,111 nationally) — a middle-class / working-renter tenant base. Strengths: housing A+, health & safety A+, cost of living A-; Watch: crime C-, amenities F, commute F.
- Moorhead Public School District (suburban): math 39% / reading 46% proficiency, ranked #202 of 301 in MN (top 67%) — families likely to look elsewhere, expect single-tenant / working-renter base with shorter leases.
- Market conditions: Rents rising (+1.4%/yr); 390 active listings in the ZIP; 10 comparable units currently listed for rent nearby; rentals leasing fast (median 13d on market — plan ~1-2 weeks tenant-placement turnaround); solid renter incomes; 269 units permitted in Clay County in 2024 (153 in 5+ unit buildings).
- This rent runs 30% of the median local income ($75k/yr) — at the standard rent-burdened threshold; future hikes will face affordability resistance.
Forward outlook
- Local home prices are declining (-3.0%/yr); year-one equity from $1k of loan paydown is wiped out by about $6k of value loss. Plan a longer hold.
- Clay County population projected at +23% by 2050 — long-run rental-demand tailwind backs the buy-and-hold thesis.
Negotiation context
- It's been on market 189 days — a 12% lower offer ($189k) is reasonable based on typical stale-listing flexibility.
- 2 sale attempts since 13y ago with the ask held roughly flat each time — persistent listings suggest the price (not the market) is what's stuck; bring a comps-based counter.
- Current owner paid $127k; list at $214k implies a 69% gain — meaningful room to come down on a strong offer.
Risks & watch-outs
- Watch-outs: built in 1951 — expect roof / HVAC / electrical / plumbing capex.
Questions for the listing agent
- What do current leases actually rent for vs. the listed asking? Can we see a recent rent roll and the last 12 months of T-12 income?
- It's been on market 189 days. Have you received any prior offers? Is the seller open to a 12% concession, seller financing, or rate buy-down credit?
- Built in 1951 — when were the roof, HVAC, electrical panel, plumbing, and water heater last replaced?
- Why hasn't it sold? Are there any deal-killer items the seller is aware of (foundation, flood, title, zoning, code violations)?
- Is there a deadline driving the sale (1031 exchange, divorce, estate, relocation)? That informs how much negotiation room exists.
- Schools are B-rated — typically a magnet for longer-tenancy family renters. What's the average tenant stay here, and is there a school-zone premium baked into asking?
- The area grade is low — what's the realistic commute time and amenity access for the typical tenant pool here? Any planned neighborhood developments (good or bad) we should know about?
- What's the average days-on-market for RENTAL listings here right now (not sales)? A rising rental-DOM trend means longer vacancies and softer asking-rent achievability than the comps imply.
- What's the recent tenant-quality profile in this submarket — average credit score on applications, eviction rate, late-payment / NSF rate, and stable-employment percentage? A property-management company in the area should have these aggregated.
- How much new for-sale + rental construction is in the pipeline within 1–3 miles? Heavy new supply typically softens prices + rents 12–24 months out; constrained supply supports both.
Investment metrics
- 1% rule
- 0.89% ✗
- Cap rate
- 6.27%
- Cash-on-cash
- -0.06%
- DSCR
- 1.00
- GRM
- 9.4
CMA / ARV
- ARV (on-the-fly)
- $185,070
- Comps found
- 1
Show comp detail 1 sale within ~0.75 mi
| Address | Dist | Beds/Ba | Sqft | Sold | Price | $/sf | Match |
|---|---|---|---|---|---|---|---|
| 216 6th Ave S | 0.34mi | 3/2.0 (-1) | 2,209 (+11%) | 11mo | $204,900 | $93 | 51 |
Match score weights: distance 35% · size 25% · config 20% · recency 20%. Top-matched comps best support the ARV.
Projected returns pro-forma
-3.0% appreciation · 1.41% rent growth · sell at horizon
- IRR
- -18.2%
- Equity multiple
- 0.37×
- Total profit
- $-37,911
- Equity at exit
- $31,983
- IRR
- -14.0%
- Equity multiple
- 0.25×
- Total profit
- $-44,990
- Equity at exit
- $18,546
Cash invested: $60,060 (down + closing). Projections, not guarantees.
Landlord ↔ Tenant lean methodology
- Overall (STATE)
- 46 Balanced
- State Minnesota
- 46 Balanced · D+2
- County
- — inherits STATE
- City
- — inherits STATE
ZIP-level market 56560
- Rents YoY
- 1.4%
- Active inventory
- 390
- Price-to-rent
- 9.4×
Monthly cashflow live
- Estimated rent
- $1,898 high interval (Pro) →
- Mortgage (P&I)
- −$1,125
- Tax from tax record
- −$289 /mo · $3,464/yr
- Insurance
- −$89
- HOA
- −$0
- Vacancy / Maint / Mgmt
- −$399
- Net cashflow
- $-3
Break-even live
UW: 25.0% down · 7.5% · 30yr · 1.5% tax · 5.0% vac · 8.0% maint · 8.0% mgmt
Financing live
Cash to close
- Down payment
- $53,625
- Closing costs
- $6,435
- Reserves months
- —
- Total cash needed
- —
Loan-product check · same deal, 3 products live
Conventional
25% down · 7.5% · 30yr
- Down + closing
- —
- Monthly P&I
- —
- Monthly cashflow
- —
- DSCR
- —
- Eligible?
- —
Personal DTI + credit; lowest rate.
DSCR
20% down · 8.5% · 30yr
- Down + closing
- —
- Monthly P&I
- —
- Monthly cashflow
- —
- DSCR
- —
- Eligible?
- —
No personal income docs; deal must DSCR.
Hard money
10% down · 12.0% · 12mo
- Down + closing
- —
- Monthly P&I
- —
- Monthly cashflow
- —
- DSCR
- —
- Eligible?
- —
Short-term bridge; refi at stabilization.
Rent comps 10 comps
| Address | Beds | Baths | Sqft | Rent | $/sqft | DOM | Units | Dist |
|---|---|---|---|---|---|---|---|---|
| 810 4th Ave S Unit 138 Moorhead, MN | 3.0 | 2.0 | 1750 | $1,325 | $0.76 | 20d | 1 | 0.12mi |
| 1521 1st Ave N Moorhead, MN | 1.0–3.0 | 1.0–2.0 | 1050 | $1,440 | $1.37 | 43d | 1 | 0.77mi |
| 337 10th Ave S Fargo, ND | 3.0 | 1.0 | 979 | $1,235 | $1.26 | 20d | 1 | 0.85mi |
| 23 Broadway N Fargo, ND | 1.0–3.0 | 1.0–2.0 | 912 | $1,700 | $1.86 | 20d | 5 | 0.95mi |
| 23 N Broadway Dr Unit 406 Fargo, ND | 3.0 | 2.0 | 1225 | $1,700 | $1.39 | 13d | 1 | 0.96mi |
| 419 3rd St N Fargo, ND | 1.0–3.0 | 1.0–2.0 | 1023 | $2,600 | $2.54 | 13d | 21 | 0.99mi |
| 630 1st Ave N Fargo, ND | 1.0–4.0 | 1.0–2.0 | 1098 | $1,700 | $1.55 | 13d | 6 | 1.06mi |
| 624 2nd Ave N Fargo, ND | 3.0 | 1.0–2.0 | 914 | $2,025 | $2.22 | 13d | 32 | 1.08mi |
| 405 Broadway N Fargo, ND | 3.0 | 1.0–2.0 | 973 | $2,250 | $2.31 | 13d | 24 | 1.13mi |
| 21 8th St N Fargo, ND | 4.0 | 1.0–3.0 | 949 | $1,680 | $1.77 | 13d | 6 | 1.21mi |
Listing history 11 events
-
2026-05-12status Pending
-
2026-04-22historical Contingent - Inspection
-
2026-03-11price $214,500
-
2026-02-18price $216,000
-
2026-01-06price $218,900
-
2025-11-04$219,900 Active
-
2013-05-28soldstatus $127,000
-
2013-05-24soldstatus $126,999 225-char remark
Show marketing remark (225 chars)
Move-right in! This 2 bedroom rambler could easily be a 4 bedroom, with the addition of egress windows. Hardwood floors, decorator paint colors, wood blinds, no-maintenance metal siding, fenced yard and deck., Total SqFt: 987
-
2013-04-17$126,999 225-char remark
Show marketing remark (225 chars)
Move-right in! This 2 bedroom rambler could easily be a 4 bedroom, with the addition of egress windows. Hardwood floors, decorator paint colors, wood blinds, no-maintenance metal siding, fenced yard and deck., Total SqFt: 987
-
2010-03-16soldstatus $121,500
-
2008-04-15soldstatus $119,000
ⓘ Source: listings_history table (triggers on properties + properties_extension) + one-shot
backfill from property_details.listing_events for pre-trigger history.
Tax reassessment forecast MN · Partial reset (capped growth)
- Current annual tax
- $3,464 · $289/mo
- Projected year-2 tax
- $3,464 · $289/mo
- Expected delta
- $0/yr ($0/mo · 0.0%)
ⓘ Screening estimate from a state-policy table — verify with the county assessor before closing.
Climate risk First Street
- Flood 1/10 Low FEMA zone X (unshaded) · 0% chance over 30 yrs
- Wildfire 1/10 Low
- Heat 2/10 Low 7 d/yr ≥98°F today · 12 d/yr by 30 yrs out
- Wind 2/10 Low
- Air quality 3/10 Moderate 3 unhealthy d/yr today · 3 by 30 yrs out
Nearby sold comps map
Loading sold comps map…
Walkable amenities ~0.75 mi
Loading nearby amenities…
Taxation est. · year 1
- Rental income
- $22,780
- − Mortgage interest
- −$12,015
- − Property taxes
- −$3,464
- − Insurance
- −$1,072
- − Repairs & maintenance
- −$1,822
- − Management
- −$1,822
- − Depreciation
- −$6,240
- Taxable loss
- −$3,656
- Est. tax savings @ 24.0%
- +$878
- After-tax cash flow
- $839/yr
For passive investors: Depreciation is non-cash, so a rental often shows a tax loss while cash-flowing — sheltering income. Rental losses are passive: they offset passive income freely, and up to $25,000/yr can offset ordinary (W-2) income if you actively participate and your MAGI is under $100k (phasing out to $0 by $150k); unused losses carry forward. On sale, claimed depreciation is recaptured at up to 25%, and gains may owe capital-gains tax (a 1031 exchange can defer both). Figures are a year-1 estimate at your 24.0% rate — not tax advice; consult a CPA.
Schools (NCES district)
- District
- Moorhead Public School District
- NCES district ID
- 2721420
- Math proficiency
- 39% ▼ -8.00%
- Reading proficiency
- 46% ▼ -6.00%
- Median HH income
- $53,009
- Composite
- 36.83/100
- National rank
- #4560
- State rank
- #202 of 301 in MN
Livability — Moorhead
- Score
- 77/100
- State rank
- #143
- US rank
- #3111
Category grades
Schools grade is shown separately in the Schools card above.
Census & demographics
- Census place
- Moorhead, MN
- County
- Clay County · 44,405 people
- City population
- 44,405
- Metro
- Fargo, ND-MN
- Population (ZIP)
- 44,405
- Household income
- $75,406
- Rent vs Own
- Severe rent burden
- 2229.0
Population outlook (Clay County) Hauer SSP2
- Today (2025)
- 67,880 people
- By 2030
- 70,881 · +4.4%
- By 2040
- 76,865 · +13.2%
- By 2050
- 83,205 · +22.6%
- By 2075
- 98,719 · +45.4%
- By 2100
- 111,657 · +64.5%
Race, ethnicity, and origin ACS 2023
- Neighborhood character
- Predominantly White (81%)
- Race & ethnicity
- White 81% Black 6% Two or more races 6% Hispanic / Latino 6% Asian 2%
- Hispanic origin (detail)
- Mexican 4%
- Common ancestry
- Portuguese 26% Lithuanian 3% Scottish 3%
- Foreign-born
- 6% · Canada, Vietnam
- Languages at home
- 91% English-only · Spanish 2% Other Indo-European 2% Arabic 1%
Political lean MEDSL · Clay
- 2024 margin
- Toss-up / Even · D 49.2% · R 48.8% · Other 2.0%
- 2008→2024 swing
- -15.5pp toward R · 2008: 16.0pp · 2024: 0.5pp
- All cycles
- 2024: D+0.5 2020: D+4.1 2016: R+2.0 2012: D+8.0 2008: D+16.0
Not yet ingested
- Civics
- —
Market trends
- HPI YoY
- ▼ -108.32%
- Current HPI
- 177.038
- Rent YoY
- ▲ 1.41%
- Metro
- Fargo, ND-MN
- State GDP YoY
- ▲ 2.41%
- F500 in state
- 34
Industry mix (Fortune 500 HQ in MN)
| Industry | F500 HQs | Revenue |
|---|---|---|
| Healthcare | 2 | $407B |
|
||
| Retail | 2 | $150B |
|
||
| Consumer Goods | 2 | $32B |
|
||
| Industrial Machinery | 2 | $6B |
|
||
| Agriculture | 1 | $40B |
|
||
| Healthcare / Medical Devices | 1 | $32B |
|
||
Price history
+80.3% since first listed11 events — show timeline
- 2026-05-12 Pending — NORTHSTARMLS as Distributed by MLS Grid
- 2026-04-22 Contingent — NORTHSTARMLS as Distributed by MLS Grid
- 2026-03-11 Price Changed $214,500 NORTHSTARMLS as Distributed by MLS Grid
- 2026-02-18 Price Changed $216,000 NORTHSTARMLS as Distributed by MLS Grid
- 2026-01-06 Price Changed $218,900 NORTHSTARMLS as Distributed by MLS Grid
- 2025-11-04 Listed $219,900 NORTHSTARMLS as Distributed by MLS Grid
- 2013-05-28 Sold (Public Records) $127,000 Public Records
- 2013-05-24 Sold (MLS) $126,999 NORTHSTARMLS as Distributed by MLS Grid
- 2013-04-17 Listed $126,999 NORTHSTARMLS as Distributed by MLS Grid
- 2010-03-16 Sold (Public Records) $121,500 Public Records
- 2008-04-15 Sold (Public Records) $119,000 Public Records
Property tax history
+7.6%/yrLatest (2026): $3,464 · +14.2% YoY. Source: county tax records.
Cash-flow waterfall
monthlySold comps — $/sqft
last 12 mo · ≤1 miLoading sold comps…