 Duplex
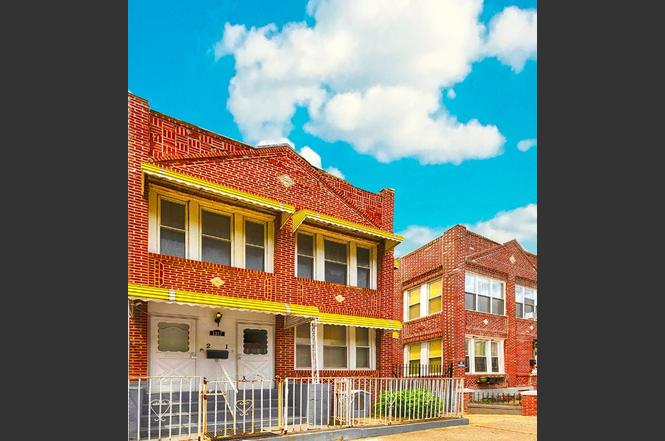
1317 Saint Lawrence Ave · New York, NY
Flood risk 1/10 · Minimal
- FEMA flood zone
- X (unshaded)
- Chance of flooding over 30 yrs
- 0.0%
- Est. flood insurance / yr
- $507 – $1,088
Fire risk 1/10 · Minimal
- Est. fire insurance / yr
- $691 – $1,283
Heat risk 6/10 · Moderate
- Hot days now (above 99°F)
- 7 days/yr
- Hot days in 30 yrs
- 15 days/yr
Wind risk 6/10 · Moderate
- Chance of severe wind over 30 yrs
- 27.0%
Air-quality risk 4/10 · Minor
- Unhealthy air days now
- 5 days/yr
- Unhealthy air days in 30 yrs
- 6 days/yr
Risk factors via First Street. Map © Google.
Why this score? — see what drove the C- grade
The composite is a weighted blend of 9 inputs, each scored 0–100. Each bar is that input's sub-score; the figure is the points it added to the 100-point composite (weight × sub-score).
- ARV discount +13.0/15.0
- Cash flow +10.8/30.0
- Appreciation +7.0/10.0
- Schools +5.0/10.0
- Livability +3.8/5.0
- DSCR +3.1/10.0
- Rent growth +2.5/5.0
- Condition / age +2.5/5.0
- 1% rule +2.4/10.0
$988,500
🖨 Deal sheet (PDF) 📄 Offer letter ✓ Due diligence
Multi-family units
County records classify this as Multi-Family (2-4 Unit). Listing-text estimate: 2 units. confirmed
Listing remarks
This red brick semi-attached two family home was built in 1925. It is located in one of the most sought after residential areas in Soundview. St Lawrence Avenue is a quiet residential street with new and well maintained homes. It has a sensible size enclosed veranda. It has a full basement that is approximately 660 sq ft above grade. The shared driveway leads to the back of the home that has a 400 sq ft enclosed double garage and a small garden. The exterior condition is average. The lot is 2500 sq ft whose lot dimensions are 25 ft X 100 ft. The maximum usable floor area as built is 3,125 sq ft. The usable floor area as built is 3,300 sq ft. The property tax $6,959.00.Each apartment has a
Key facts
- Renovated bathroom
- Full basement
- Renovated kitchen
Tags
Property features AI
Finance
- Other: Pets allowed in the building
- HOA & community: Association fee due monthly
Exterior
- Parking: Garage
- Home design: Two stories; Entry level at grade
- Construction: Lot approximately 2,500 (dimensions listed as 25 x 100)
- Exterior features: Building garden; Garden; Private outdoor space (under 60 sqft); Terrace; North and south exposures
Interior
- Bathrooms: Two full bathrooms
- Heating & cooling: Radiant heating; Window air conditioning units
- Interior features: Unfurnished; Total of 12 rooms; Two-unit building
- Laundry & utility: No building laundry
Neighborhood map
What this means for you Summary
Snapshot
- This is a 2 × 3-bed/1.0-bath units multifamily listed at $988k.
Deal economics
- At list price, monthly cash flow is $-454 ($-5k/yr) — negative. Per door: $-227/mo.
- To cash-flow at today's rent, offer at most $908k (8.1% below list).
- To meet the 1% rule (rent ≥ 1% of price), the offer needs to be $729k (26.3% below list).
- Recommended offer: $729k (26.3% below list) — sets the bar for 1% rule.
- Cap rate 5.7% vs local median 2.6% in New York — top-decile yield for the area; either an underpriced asset or a hidden risk that comps aren't pricing in. Stress-test before assuming the spread holds.
Location & tenants
- Location reads 75/100 on livability (#268 in NY, #4,188 nationally) — a middle-class / working-renter tenant base. Strengths: amenities A+, commute A+, health & safety A; Watch: crime F, cost of living F.
- Zoned schools: Ps 214 (math 30% / reading 50%, grade F, #1,418 of 2,108 statewide, top 68%, 836 students, 92% FRL); Jhs 383 Philippa Schuyler (math 32% / reading 67%, grade C, #280 of 729 statewide, top 40%, 822 students, 85% FRL); Midwood High School (math 94% / reading 96%, grade A+, #83 of 1,100 statewide, top 8%, 4,062 students, 73% FRL).
- Market conditions: 54 active listings in the ZIP; 6,929 units permitted in Bronx County in 2024 (6,829 in 5+ unit buildings).
Forward outlook
- In year one you build about $47k of equity ($7k loan paydown + $40k appreciation (4.1% local appreciation)).
- Bronx County population projected at +21% by 2050 — long-run rental-demand tailwind backs the buy-and-hold thesis.
- By year 2, paydown + projected appreciation supports a ~$76k cash-out refi (75% LTV) — recoverable capital for the next deal without selling this one.
Negotiation context
- It's been on market 318 days — a 12% lower offer ($870k) is reasonable based on typical stale-listing flexibility.
- Current owner paid $25k; list at $988k implies a 3854% gain — meaningful room to come down on a strong offer.
Risks & watch-outs
- Watch-outs: built in 1900 — expect roof / HVAC / electrical / plumbing capex.
- Climate carrying-cost: major wind risk, 27% chance of damaging wind over 30y; extreme-heat days projected 7→15/yr by 2055 (HVAC capex compounding) — expect insurance premiums to compound above CPI over the hold.
Questions for the listing agent
- What do current leases actually rent for vs. the listed asking? Can we see a recent rent roll and the last 12 months of T-12 income?
- It's been on market 318 days. Have you received any prior offers? Is the seller open to a 26% concession, seller financing, or rate buy-down credit?
- Can we see the unit-by-unit rent roll, current vacancy, and any below-market leases? What's the average tenancy length?
- What capital expenditures (roof, boiler, parking lot, exteriors) have been made in the last 5 years, and what's planned in the next 2?
- Built in 1900 — when were the roof, HVAC, electrical panel, plumbing, and water heater last replaced?
- Why hasn't it sold? Are there any deal-killer items the seller is aware of (foundation, flood, title, zoning, code violations)?
- Is there a deadline driving the sale (1031 exchange, divorce, estate, relocation)? That informs how much negotiation room exists.
- Schools are B-rated — typically a magnet for longer-tenancy family renters. What's the average tenant stay here, and is there a school-zone premium baked into asking?
- Crime grade is F in this area — have there been break-ins, vandalism, or insurance claims at this property in the last 3 years? What carrier currently insures it and at what premium?
- What's the average days-on-market for RENTAL listings here right now (not sales)? A rising rental-DOM trend means longer vacancies and softer asking-rent achievability than the comps imply.
- What's the recent tenant-quality profile in this submarket — average credit score on applications, eviction rate, late-payment / NSF rate, and stable-employment percentage? A property-management company in the area should have these aggregated.
- How much new apartment / multifamily construction is in the pipeline within 1–3 miles? Heavy new supply (>2% of stock underway) typically softens rents 12–24 months out; light construction supports rent growth.
Investment metrics
- 1% rule
- 0.74% ✗
- Cap rate
- 5.74%
- Cash-on-cash
- -1.97%
- DSCR
- 0.91
- GRM
- 11.3
CMA / ARV
- ARV (on-the-fly)
- $1,125,300
- Comps found
- 12
Show comp detail 12 sales within ~0.75 mi
| Address | Dist | Beds/Ba | Sqft | Sold | Price | $/sf | Match |
|---|---|---|---|---|---|---|---|
| 1321 Commonwealth Ave | 0.05mi | 7/— (+1) | 3,685 (+12%) | 5mo | $1,258,000 | $341 | 69 |
| 1506 E 172nd St | 0.67mi | 6/4.0 | 3,198 (-3%) | 2mo | $950,000 | $297 | 54 |
| 1143 White Plains Rd | 0.42mi | 7/4.0 (+1) | 3,321 (+1%) | 15mo | $1,345,000 | $405 | 54 |
| 1126 Beach Ave | 0.35mi | 7/2.0 (+1) | 2,982 (-10%) | 14mo | $849,999 | $285 | 50 |
| 1830 Gleason Ave | 0.29mi | 7/5.0 (+1) | 3,403 (+3%) | 21mo | $1,290,000 | $379 | 47 |
| 1620 Taylor Ave | 0.55mi | 6/3.0 | 2,805 (-15%) | 1mo | $1,100,000 | $392 | 44 |
| 1171 Leland Ave | 0.33mi | 7/4.0 (+1) | 3,717 (+13%) | 8mo | $1,100,000 | $296 | 44 |
| 1169 Leland Ave | 0.33mi | 7/4.0 (+1) | 3,717 (+13%) | 8mo | $995,200 | $268 | 44 |
| 1412 White Plains Rd | 0.32mi | 6/3.0 | 3,780 (+14%) | 20mo | $1,225,000 | $324 | 41 |
| 641 Baker Ave | 0.63mi | 5/3.0 (-1) | 3,133 (-5%) | 16mo | $1,070,000 | $342 | 40 |
| 532 Van Nest Ave | 0.55mi | 5/2.5 (-1) | 2,938 (-11%) | 18mo | $975,000 | $332 | 34 |
| 2032 Benedict Ave | 0.60mi | 7/2.5 (+1) | 2,874 (-13%) | 19mo | $1,130,000 | $393 | 28 |
Match score weights: distance 35% · size 25% · config 20% · recency 20%. Top-matched comps best support the ARV.
Projected returns pro-forma
4.08% appreciation · 3.0% rent growth · sell at horizon
- IRR
- 8.7%
- Equity multiple
- 1.53×
- Total profit
- $147,694
- Equity at exit
- $505,992
- IRR
- 10.7%
- Equity multiple
- 2.80×
- Total profit
- $497,932
- Equity at exit
- $831,451
Cash invested: $276,780 (down + closing). Projections, not guarantees.
Landlord ↔ Tenant lean methodology
- Overall (CITY)
- 0 Strongly Tenant-Friendly
- State New York
- 15 Strongly Tenant-Friendly · D+10
- County
- — inherits STATE
- City New York
- 0 Strongly Tenant-Friendly · D+34
ZIP-level market 10472
- Home prices YoY
- 1.8%
- Active inventory
- 54
- Price-to-rent
- 22.6×
Monthly cashflow live
- Estimated rent
- $7,286 medium interval (Pro) →
- Mortgage (P&I)
- −$5,184
- Tax from tax record
- −$615 /mo · $7,376/yr
- Insurance
- −$412
- HOA
- −$0
- Vacancy / Maint / Mgmt
- −$1,530
- Net cashflow
- $-454
Break-even live
Sensitivity live
| Price | -10% $105 | -5% $-175 | +0% $-454 | +5% $-734 | +10% $-1,014 |
|---|---|---|---|---|---|
| Rent | -10% $-1,030 | -5% $-742 | +0% $-454 | +5% $-167 | +10% $121 |
| Rate | -1.0pp $43 | -0.5pp $-203 | base $-454 | +0.5pp $-711 | +1.0pp $-971 |
2-unit breakdown (identical units grouped — click to expand)
| Units | Beds | Baths | Est. rent |
|---|---|---|---|
| 2× units | 3 | 1 | $7,286 |
| #1 | 3 | 1 | $3,643 |
| #2 | 3 | 1 | $3,643 |
| Total (2 units) | $7,286 | ||
UW: 25.0% down · 7.5% · 30yr · 1.5% tax · 5.0% vac · 8.0% maint · 8.0% mgmt
Financing live
Cash to close
- Down payment
- $247,125
- Closing costs
- $29,655
- Reserves months
- —
- Total cash needed
- —
Loan-product check · same deal, 3 products live
Conventional
25% down · 7.5% · 30yr
- Down + closing
- —
- Monthly P&I
- —
- Monthly cashflow
- —
- DSCR
- —
- Eligible?
- —
Personal DTI + credit; lowest rate.
DSCR
20% down · 8.5% · 30yr
- Down + closing
- —
- Monthly P&I
- —
- Monthly cashflow
- —
- DSCR
- —
- Eligible?
- —
No personal income docs; deal must DSCR.
Hard money
10% down · 12.0% · 12mo
- Down + closing
- —
- Monthly P&I
- —
- Monthly cashflow
- —
- DSCR
- —
- Eligible?
- —
Short-term bridge; refi at stabilization.
Listing history 12 events
-
2026-06-21days on market $988,500 Active 318 DOM
-
2026-06-18days on market $988,500 Active 315 DOM
-
2026-06-17days on market $988,500 Active 314 DOM
-
2026-06-15days on market $988,500 Active 312 DOM
-
2026-06-13days on market $988,500 Active 310 DOM
-
2026-06-10days on market $988,500 Active 306 DOM
-
2026-06-08days on market $988,500 Active 305 DOM
-
2026-06-03days on market $988,500 Active 300 DOM
-
2026-06-01days on market $988,500 Active 298 DOM
-
2026-05-31days on market $988,500 Active 297 DOM
-
2025-08-07$988,500 Active
-
2020-04-23soldstatus $25,000
ⓘ Source: listings_history table (triggers on properties + properties_extension) + one-shot
backfill from property_details.listing_events for pre-trigger history.
Tax reassessment forecast NY · Partial reset (capped growth)
- Current annual tax
- $7,376 · $615/mo
- Projected year-2 tax
- $12,041 · $1,003/mo
- Expected delta
- +$4,665/yr (+$389/mo · 63.2%)
ⓘ Screening estimate from a state-policy table — verify with the county assessor before closing.
Climate risk First Street
- Flood 1/10 Low FEMA zone X (unshaded) · 0% chance over 30 yrs
- Wildfire 1/10 Low
- Heat 6/10 Major 7 d/yr ≥99°F today · 15 d/yr by 30 yrs out
- Wind 6/10 Major 27% chance of damaging wind over 30 yrs
- Air quality 4/10 Moderate 5 unhealthy d/yr today · 6 by 30 yrs out
Nearby sold comps map
Loading sold comps map…
Walkable amenities ~0.75 mi
Loading nearby amenities…
Taxation est. · year 1
- Rental income
- $87,432
- − Mortgage interest
- −$55,371
- − Property taxes
- −$7,376
- − Insurance
- −$4,942
- − Repairs & maintenance
- −$6,995
- − Management
- −$6,995
- − Depreciation
- −$28,756
- Taxable loss
- −$23,004
- Est. tax savings @ 24.0%
- +$5,521
- After-tax cash flow
- $68/yr
For passive investors: Depreciation is non-cash, so a rental often shows a tax loss while cash-flowing — sheltering income. Rental losses are passive: they offset passive income freely, and up to $25,000/yr can offset ordinary (W-2) income if you actively participate and your MAGI is under $100k (phasing out to $0 by $150k); unused losses carry forward. On sale, claimed depreciation is recaptured at up to 25%, and gains may owe capital-gains tax (a 1031 exchange can defer both). Figures are a year-1 estimate at your 24.0% rate — not tax advice; consult a CPA.
Schools (NCES district)
No district data.
Livability — New York
- Score
- 75/100
- State rank
- #268
- US rank
- #4188
Category grades
Schools grade is shown separately in the Schools card above.
Census & demographics
- Census place
- New York, NY
- City population
- 7,731,280
- Population (ZIP)
- 63,820
Population outlook (Bronx County) Hauer SSP2
- Today (2025)
- 1,607,353 people
- By 2030
- 1,681,852 · +4.6%
- By 2040
- 1,824,421 · +13.5%
- By 2050
- 1,945,470 · +21.0%
- By 2075
- 2,187,887 · +36.1%
- By 2100
- 2,244,136 · +39.6%
Race, ethnicity, and origin ACS 2023
- Neighborhood character
- Diverse neighborhood (Simpson 0.56)
- Race & ethnicity
- Hispanic / Latino 62% Black 23% Two or more races 9% Asian 8% White 2% Native American 1%
- Hispanic origin (detail)
- Mexican 8% Puerto Rican 20% Cuban 1% Dominican 20%
- Foreign-born
- 40% · Canada, Jamaica
- Languages at home
- 36% English-only · Spanish 52% Other Indo-European 7% French/Haitian/Cajun 2%
Political lean MEDSL · Bronx
- 2024 margin
- Solid D (+45.4) · D 72.7% · R 27.3%
- 2008→2024 swing
- -32.3pp toward R · 2008: 77.8pp · 2024: 45.4pp
- All cycles
- 2024: D+45.4 2020: D+67.6 2016: D+79.1 2012: D+82.9 2008: D+77.8
Not yet ingested
- Civics
- —
Market trends
- HPI YoY
- ▲ 4.08%
- Current HPI
- 236.8002
- Rent YoY
- —
- Metro
- —
- State GDP YoY
- ▲ 2.60%
- F500 in state
- 92
Industry mix (Fortune 500 HQ in NY)
| Industry | F500 HQs | Revenue |
|---|---|---|
| Financial Services | 10 | $950B |
|
||
| Consumer Goods | 9 | $162B |
|
||
| Insurance | 4 | $225B |
|
||
| Telecommunications | 2 | $144B |
|
||
| Pharmaceuticals | 2 | $112B |
|
||
| Media / Entertainment | 2 | $69B |
|
||
Price history
+3854.0% since first listed2 events — show timeline
- 2025-08-07 Listed $988,500 RLS at REBNY
- 2020-04-23 Sold (Public Records) $25,000 Public Records
Property tax history
+4.3%/yrLatest (2025): $7,376 · +6.0% YoY. Source: county tax records.
Cash-flow waterfall
monthlySold comps — $/sqft
last 12 mo · ≤1 miLoading sold comps…