5322 Treetops Dr Unit I · Naples Manor, FL
Flood risk 9/10 · Severe
- FEMA flood zone
- AE
- Chance of flooding over 30 yrs
- 0.99%
- Est. flood insurance / yr
- $1,737 – $8,500
Fire risk 3/10 · Minor
- Est. fire insurance / yr
- $947 – $1,759
Heat risk 10/10 · Severe
- Hot days now (above 107°F)
- 7 days/yr
- Hot days in 30 yrs
- 29 days/yr
Wind risk 10/10 · Severe
- Chance of severe wind over 30 yrs
- 99.0%
Air-quality risk 2/10 · Minimal
- Unhealthy air days now
- 2 days/yr
- Unhealthy air days in 30 yrs
- 2 days/yr
Risk factors via First Street. Map © Google.
Why this score? — see what drove the B grade
The composite is a weighted blend of 9 inputs, each scored 0–100. Each bar is that input's sub-score; the figure is the points it added to the 100-point composite (weight × sub-score).
- Cash flow +30.0/30.0
- 1% rule +10.0/10.0
- DSCR +10.0/10.0
- ARV discount +7.5/15.0
- Schools +5.0/10.0
- Rent growth +3.9/5.0
- Livability +3.3/5.0
- Condition / age +2.5/5.0
- Appreciation +0.0/10.0
$150,000
🖨 Deal sheet 📄 Offer letter ✓ Due diligence
Listing remarks MLS
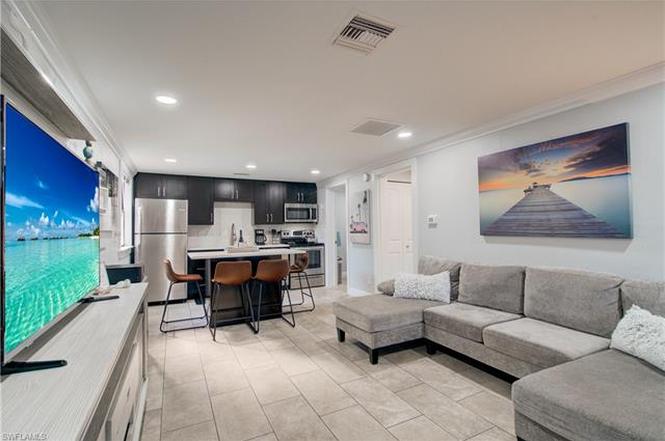
Price to Sell-1 bed/ 1 bath condo, great location, easy access to Downtown Naples and the Naples Beaches. Great investment property or perfect for a seasonal getaway.
Key facts
- Updated condo
- $642 HOA
- Garage
Tags
Property features AI
Finance
- HOA & community: Mandatory HOA with professional management; Quarterly condo fee of $1,926 (total annual recurring fees $7,704); One-time fees $150; Community pool; HOA covers lawn/land maintenance, legal/accounting, exterior pest control, reserves, sewer, trash removal and water
Exterior
- Parking: 1 assigned parking space
- Utilities: Central water; Central sewer; Cable available
- Home design: Residential garden apartment in a low-rise (1-3) building; Rear exposure facing east; Treetops of Naples community; Entry level: Ground (single-story unit)
- Construction: Wood frame construction; Wood siding exterior; Shingle roof; Built in 1980; Garden apartment building
- Exterior features: Double-hung windows; Zero lot line; Paved road access; Central irrigation; View: See remarks
Interior
- Kitchen: Dishwasher; Range; Refrigerator/Icemaker; Disposal
- Bedrooms: 1 bedroom — Master bedroom on ground level
- Flooring: Vinyl
- Bathrooms: 1 full bathroom; Master bath with shower only
- Heating & cooling: Heat pump; Central electric cooling
- Interior features: Built-in cabinets; Cable prewire; Screened lanai/porch; Efficiency floor plan; Furnished
- Laundry & utility: Washer/dryer hookup; Dryer; Laundry in residence
Neighborhood map
What this means for you Summary
Snapshot
- This is a 1-bed/1.0-bath condo listed at $150k.
Deal economics
- At list price, monthly cash flow is $154 ($2k/yr) — positive.
- The deal already cash-flows at list — no discount required.
- Meets the 1% rule at list price ($3k rent vs $150k).
- Recommended offer: $136k (9.0% below list) — sets the bar for market timing.
Location & tenants
- Location reads 66/100 on livability (#615 in FL) — a middle-class / working-renter tenant base. Strengths: housing A+, health & safety A+, cost of living B+; Watch: amenities F, commute F, employment D-.
- Collier (suburban): math 60% / reading 56% proficiency, ranked #16 of 73 in FL (top 22%) — acceptable for families but not a draw, mixed tenant base, ~2y average lease.
- Zoned schools: Manatee Elementary School (math 58% / reading 51%, grade C, #892 of 2,144 statewide, top 44%, 584 students, 73% FRL); Lely High School (math 40% / reading 39%, grade F, #304 of 667 statewide, top 47%, 1,504 students, 54% FRL).
- Market conditions: Rents rising fast (+5.6%/yr); 597 active listings in the ZIP; 2 comparable units currently listed for rent nearby; solid renter incomes; 3,520 units permitted in Collier County in 2024 (959 in 5+ unit buildings).
- This rent runs 40% of the median local income ($82k/yr) — at the standard rent-burdened threshold; future hikes will face affordability resistance.
Forward outlook
- Local home prices are declining (-3.0%/yr); year-one equity from $1k of loan paydown is wiped out by about $4k of value loss. Plan a longer hold.
- Collier County population projected at +30% by 2050 — long-run rental-demand tailwind backs the buy-and-hold thesis.
- At projected returns (-3.0% appreciation + 5.6% rent growth), your $42k cash investment doubles in ~10 years — after that, you're playing with house money.
Negotiation context
- It's been on market 98 days — a 9% lower offer ($136k) is reasonable based on typical stale-listing flexibility.
- 7 sale attempts since 9y ago with the ask held roughly flat each time — persistent listings suggest the price (not the market) is what's stuck; bring a comps-based counter.
Risks & watch-outs
- Watch-outs: flood insurance adds $427/mo; HOA is 23% of rent.
- Climate carrying-cost: in FEMA flood zone AE (mandatory federal flood insurance); severe wind risk, 99% chance of damaging wind over 30y; extreme-heat days projected 7→29/yr by 2055 (HVAC capex compounding) — expect insurance premiums to compound above CPI over the hold.
Questions for the listing agent
- It's been on market 98 days. Have you received any prior offers? Is the seller open to a 9% concession, seller financing, or rate buy-down credit?
- What's the actual annual flood-insurance premium (NFIP or private), and is the property in a SFHA with mandatory coverage?
- What does the HOA fee cover, when was the last increase, and are there any pending special assessments or reserve-fund shortfalls?
- Any open or pending special assessments — roof, HVAC, plumbing, elevator, façade? What's the per-unit balance and payoff schedule, and is the seller paying it off at close or rolling it to the buyer?
- Why hasn't it sold? Are there any deal-killer items the seller is aware of (foundation, flood, title, zoning, code violations)?
- Is there a deadline driving the sale (1031 exchange, divorce, estate, relocation)? That informs how much negotiation room exists.
- Schools are F-rated, which usually means shorter tenancies and higher turnover. Who's the typical renter profile here, and what's been the actual vacancy rate?
- What's the average days-on-market for RENTAL listings here right now (not sales)? A rising rental-DOM trend means longer vacancies and softer asking-rent achievability than the comps imply.
- What's the recent tenant-quality profile in this submarket — average credit score on applications, eviction rate, late-payment / NSF rate, and stable-employment percentage? A property-management company in the area should have these aggregated.
- How much new apartment / multifamily construction is in the pipeline within 1–3 miles? Heavy new supply (>2% of stock underway) typically softens rents 12–24 months out; light construction supports rent growth.
Investment metrics
- 1% rule
- 1.82% ✓
- Cap rate
- 10.94%
- Cash-on-cash
- 16.59%
- DSCR
- 1.74
- GRM
- 4.6
CMA / ARV
No comps found within radius.
Projected returns pro-forma
-3.0% appreciation · 5.59% rent growth · sell at horizon
- IRR
- -4.0%
- Equity multiple
- 0.84×
- Total profit
- $-6,530
- Equity at exit
- $22,365
- IRR
- 10.4%
- Equity multiple
- 1.98×
- Total profit
- $41,210
- Equity at exit
- $12,969
Cash invested: $42,000 (down + closing). Projections, not guarantees.
Landlord ↔ Tenant lean methodology
- Overall (STATE)
- 87 Strongly Landlord-Friendly
- State Florida
- 87 Strongly Landlord-Friendly · R+3
- County
- — inherits STATE
- City
- — inherits STATE
ZIP-level market 34113
- Rents YoY
- 5.6%
- Active inventory
- 597
- Price-to-rent
- 4.6×
Monthly cashflow live
- Estimated rent
- $2,736 medium interval (Pro) →
- Mortgage (P&I)
- −$787
- Tax from tax record
- −$90 /mo · $1,077/yr
- Insurance
- −$62
- Flood insurance flood zone
- −$427 /mo · $5,118/yr
- HOA
- −$642
- Vacancy / Maint / Mgmt
- −$575
- Net cashflow
- $154
Break-even live
UW: 25.0% down · 7.5% · 30yr · 1.5% tax · 5.0% vac · 8.0% maint · 8.0% mgmt
Financing live
Cash to close
- Down payment
- $37,500
- Closing costs
- $4,500
- Reserves months
- —
- Total cash needed
- —
Loan-product check · same deal, 3 products live
Conventional
25% down · 7.5% · 30yr
- Down + closing
- —
- Monthly P&I
- —
- Monthly cashflow
- —
- DSCR
- —
- Eligible?
- —
Personal DTI + credit; lowest rate.
DSCR
20% down · 8.5% · 30yr
- Down + closing
- —
- Monthly P&I
- —
- Monthly cashflow
- —
- DSCR
- —
- Eligible?
- —
No personal income docs; deal must DSCR.
Hard money
10% down · 12.0% · 12mo
- Down + closing
- —
- Monthly P&I
- —
- Monthly cashflow
- —
- DSCR
- —
- Eligible?
- —
Short-term bridge; refi at stabilization.
Rent comps 2 comps
| Address | Beds | Baths | Sqft | Rent | $/sqft | DOM | Units | Dist |
|---|---|---|---|---|---|---|---|---|
| 5222 Treetops Dr Naples, FL | 1.0 | 1.0 | 600 | $1,800 | $3.00 | 23d | 1 | 0.03mi |
| 5314 Gilchrist St Naples, FL | 2.0 | 1.0 | 636 | $2,000 | $3.14 | 13d | 1 | 0.43mi |
HOA detail condo
- Monthly dues
- $642 · $7,704/yr
- Assessments
- None detected in remarks — confirm with the listing agent.
Listing history 40 events
-
2026-06-18days on market $150,000 Active 98 DOM
-
2026-06-17days on market $150,000 Active 97 DOM
-
2026-06-16days on market $150,000 Active 96 DOM
-
2026-06-15days on market $150,000 Active 95 DOM
-
2026-06-14days on market $150,000 Active 93 DOM
-
2026-06-10days on market $150,000 Active 90 DOM
-
2026-06-09days on market $150,000 Active 89 DOM
-
2026-06-08days on market $150,000 Active 88 DOM
-
2026-06-07days on market $150,000 Active 87 DOM
-
2026-06-03days on market $150,000 Active 83 DOM
-
2026-06-02days on market $150,000 Active 82 DOM
-
2026-06-01days on market $150,000 Active 81 DOM
-
2026-05-31days on market $150,000 Active 80 DOM
-
2026-05-30days on market $150,000 Active 79 DOM
-
2026-03-12$150,000 Active
-
2026-02-11historical
-
2025-03-14$155,000 Active
-
2022-06-22soldstatus $150,000
-
2022-06-16soldstatus $150,000 Sold 166-char remark
Show marketing remark (166 chars)
Price to Sell-1 bed/ 1 bath condo, great location, easy access to Downtown Naples and the Naples Beaches. Great investment property or perfect for a seasonal getaway.
-
2022-05-11status Pending With Contingencies 166-char remark
Show marketing remark (166 chars)
Price to Sell-1 bed/ 1 bath condo, great location, easy access to Downtown Naples and the Naples Beaches. Great investment property or perfect for a seasonal getaway.
-
2022-05-03$159,000 Active 166-char remark
Show marketing remark (166 chars)
Price to Sell-1 bed/ 1 bath condo, great location, easy access to Downtown Naples and the Naples Beaches. Great investment property or perfect for a seasonal getaway.
-
2020-09-29soldstatus $210,000
-
2019-12-31historical
-
2019-09-19price $84,999
-
2019-08-05status Active
-
2019-05-23historical
-
2019-05-03$80,000 Active
-
2019-05-03historical
-
2019-04-18price $80,000
-
2019-04-17$8,000 Active
-
2017-12-26soldstatus $40,000
-
2017-03-21soldstatus $27,500
-
2017-03-15price $27,500
-
2017-03-15historical
-
2017-03-15soldstatus $27,500 Sold
-
2017-03-14price $34,900
-
2017-02-21status Pending
-
2017-02-10price $34,900
-
2017-01-24$39,900 Active
-
1995-01-04soldstatus $19,000
ⓘ Source: listings_history table (triggers on properties + properties_extension) + one-shot
backfill from property_details.listing_events for pre-trigger history.
Tax reassessment forecast FL · Resets to sale price
- Current annual tax
- $1,077 · $90/mo
- Projected year-2 tax
- $1,245 · $104/mo
- Expected delta
- +$168/yr (+$14/mo · 15.6%)
ⓘ Screening estimate from a state-policy table — verify with the county assessor before closing.
Climate risk First Street
- Flood 9/10 Extreme FEMA zone AE · 99% chance over 30 yrs
- Wildfire 3/10 Moderate
- Heat 10/10 Extreme 7 d/yr ≥107°F today · 29 d/yr by 30 yrs out
- Wind 10/10 Extreme 99% chance of damaging wind over 30 yrs
- Air quality 2/10 Low 2 unhealthy d/yr today · 2 by 30 yrs out
Nearby sold comps map
Loading sold comps map…
Walkable amenities ~0.75 mi
Loading nearby amenities…
Taxation est. · year 1
- Rental income
- $32,835
- − Mortgage interest
- −$8,402
- − Property taxes
- −$1,077
- − Insurance
- −$5,868
- − Repairs & maintenance
- −$2,627
- − Management
- −$2,627
- − HOA
- −$7,704
- − Depreciation
- −$4,364
- Taxable income
- $166
- Est. tax owed @ 24.0%
- −$40
- After-tax cash flow
- $1,811/yr
For passive investors: Depreciation is non-cash, so a rental often shows a tax loss while cash-flowing — sheltering income. Rental losses are passive: they offset passive income freely, and up to $25,000/yr can offset ordinary (W-2) income if you actively participate and your MAGI is under $100k (phasing out to $0 by $150k); unused losses carry forward. On sale, claimed depreciation is recaptured at up to 25%, and gains may owe capital-gains tax (a 1031 exchange can defer both). Figures are a year-1 estimate at your 24.0% rate — not tax advice; consult a CPA.
Schools (NCES district)
- District
- Collier
- NCES district ID
- 1200330
- Math proficiency
- 60% ▼ -4.00%
- Reading proficiency
- 56% ▼ -2.00%
- Median HH income
- $58,275
- Composite
- 50.23/100
- National rank
- #1892
- State rank
- #16 of 73 in FL
Livability — Naples Manor
- Score
- 66/100
- State rank
- #615
- US rank
- #11875
Category grades
Schools grade is shown separately in the Schools card above.
Census & demographics
- County
- Collier County · 396,295 people
- Metro
- Naples-Marco Island, FL
- Population (ZIP)
- 26,056
- Household income
- $81,674
- Rent vs Own
- Severe rent burden
- 954.0
Population outlook (Collier County) Hauer SSP2
- Today (2025)
- 420,858 people
- By 2030
- 450,054 · +6.9%
- By 2040
- 502,232 · +19.3%
- By 2050
- 544,932 · +29.5%
- By 2075
- 627,203 · +49.0%
- By 2100
- 659,015 · +56.6%
Race, ethnicity, and origin ACS 2023
- Neighborhood character
- Diverse neighborhood (Simpson 0.59)
- Race & ethnicity
- White 56% Hispanic / Latino 28% Black 12% Two or more races 11% Asian 2%
- Hispanic origin (detail)
- Mexican 17% Puerto Rican 3% Cuban 2%
- Common ancestry
- Hispanic 10% Romanian 3% Lithuanian 2%
- Foreign-born
- 26% · Canada, Jamaica, Vietnam
- Languages at home
- 63% English-only · Spanish 24% French/Haitian/Cajun 9% Other Indo-European 2%
Political lean MEDSL · Collier
- 2024 margin
- Solid R (+33.1) · D 33.1% · R 66.2%
- 2008→2024 swing
- -10.6pp toward R · 2008: -22.5pp · 2024: -33.1pp
- All cycles
- 2024: R+33.1 2020: R+24.7 2016: R+26.0 2012: R+30.1 2008: R+22.5
Not yet ingested
- Civics
- —
Market trends
- HPI YoY
- ▼ -194.86%
- Current HPI
- 279.4232
- Rent YoY
- ▲ 5.59%
- Metro
- Naples-Marco Island, FL
- State GDP YoY
- ▲ 3.28%
- F500 in state
- 36
Industry mix (Fortune 500 HQ in FL)
| Industry | F500 HQs | Revenue |
|---|---|---|
| Industrial Technology | 2 | $29B |
|
||
| Insurance | 2 | $17B |
|
||
| Retail | 1 | $60B |
|
||
| Technology Distribution | 1 | $58B |
|
||
| Homebuilding | 1 | $35B |
|
||
| Technology Manufacturing | 1 | $35B |
|
||
Price history
+689.5% since first listed26 events — show timeline
- 2026-03-12 Listed $150,000 NAPLESMLS
- 2026-02-11 Listing Removed — NAPLESMLS
- 2025-03-14 Listed $155,000 NAPLESMLS
- 2022-06-22 Sold (Public Records) $150,000 Public Records
- 2022-06-16 Sold (MLS) $150,000 NAPLESMLS
- 2022-05-11 Pending — NAPLESMLS
- 2022-05-03 Listed $159,000 NAPLESMLS
- 2020-09-29 Sold (Public Records) $210,000 Public Records
- 2019-12-31 Listing Removed — NAPLESMLS
- 2019-09-19 Price Changed $84,999 NAPLESMLS
- 2019-08-05 Relisted — NAPLESMLS
- 2019-05-23 Listing Removed — NAPLESMLS
- 2019-05-03 Listing Removed — NAPLESMLS
- 2019-05-03 Listed $80,000 NAPLESMLS
- 2019-04-18 Price Changed $80,000 NAPLESMLS
- 2019-04-17 Listed $8,000 NAPLESMLS
- 2017-12-26 Sold (Public Records) $40,000 Public Records
- 2017-03-21 Sold (Public Records) $27,500 Public Records
- 2017-03-15 Price Changed $27,500 NAPLESMLS
- 2017-03-15 Listing Removed — NAPLESMLS
- 2017-03-15 Sold (MLS) $27,500 NAPLESMLS
- 2017-03-14 Price Changed $34,900 NAPLESMLS
- 2017-02-21 Pending — NAPLESMLS
- 2017-02-10 Price Changed $34,900 NAPLESMLS
- 2017-01-24 Listed $39,900 NAPLESMLS
- 1995-01-04 Sold (Public Records) $19,000 Public Records
Property tax history
+14.1%/yrLatest (2025): $1,077 · +4.3% YoY. Source: county tax records.
Cash-flow waterfall
monthlySold comps — $/sqft
last 12 mo · ≤1 miLoading sold comps…