334 White Oak Rd · Gillis, LA
Flood risk 8/10 · Major
- FEMA flood zone
- A
- Chance of flooding over 30 yrs
- 0.99%
- Est. flood insurance / yr
- $1,009 – $1,996
Fire risk 5/10 · Moderate
- Est. fire insurance / yr
- $1,269 – $2,357
Heat risk 8/10 · Major
- Hot days now (above 110°F)
- 7 days/yr
- Hot days in 30 yrs
- 22 days/yr
Wind risk 9/10 · Severe
- Chance of severe wind over 30 yrs
- 99.0%
Air-quality risk 2/10 · Minimal
- Unhealthy air days now
- 2 days/yr
- Unhealthy air days in 30 yrs
- 2 days/yr
Risk factors via First Street. Map © Google.
Why this score? — see what drove the C+ grade
The composite is a weighted blend of 9 inputs, each scored 0–100. Each bar is that input's sub-score; the figure is the points it added to the 100-point composite (weight × sub-score).
- Cash flow +24.6/30.0
- DSCR +7.9/10.0
- ARV discount +7.5/15.0
- 1% rule +5.4/10.0
- Appreciation +5.2/10.0
- Schools +3.0/10.0
- Rent growth +2.5/5.0
- Condition / age +2.5/5.0
- Livability +2.0/5.0
$124,900
🖨 Deal sheet 📄 Offer letter ✓ Due diligence
Listing remarks
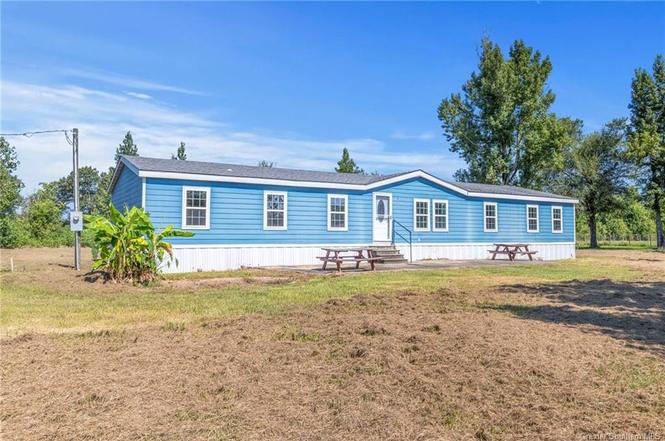
Enjoy peaceful country living with modern upgrades in this beautifully remodeled 4-bedroom, 2-bath double-wide mobile home located in Ragley. Situated on a serene one-acre lot, this 2001 home offers over 2,000 square feet of open, inviting living space designed for both comfort and functionality. Step inside to find fresh paint, updated flooring, and elegant granite countertops throughout, creating a clean and cohesive look. Major improvements include a brand-new roof and new Hardie siding, giving the home lasting value and curb appeal. The spacious layout features two generous living areas, including a cozy den with a fireplace—perfect for relaxing evenings—and a separate forma
Key facts
- Modern upgrades
- Brand new roof
- New hardie siding
Tags
Neighborhood map
What this means for you Summary
Snapshot
- This is a 4-bed/2.0-bath manufactured listed at $125k.
Deal economics
- At list price, monthly cash flow is $133 ($2k/yr) — positive.
- The deal already cash-flows at list — no discount required.
- Meets the 1% rule at list price ($1k rent vs $125k).
- Recommended offer: $114k (9.0% below list) — sets the bar for market timing.
- Cap rate 8.8% vs local median 3.4% in Gillis — top-decile yield for the area; either an underpriced asset or a hidden risk that comps aren't pricing in. Stress-test before assuming the spread holds.
Location & tenants
- Location reads 39/100 on livability (#468 in LA) — a limited-amenity area; tenant pool skews transient or value-seeking. Strengths: cost of living A+, crime A; Watch: amenities F, commute F, employment F.
- Beauregard Parish (rural): math 30% / reading 41% proficiency, ranked #32 of 98 in LA (top 33%) — families likely to look elsewhere, expect single-tenant / working-renter base with shorter leases.
- Zoned schools: South Beauregard Upper Elementary School (math 41% / reading 49%, grade D, #46 of 218 statewide, top 22%, 393 students, 53% FRL); South Beauregard High School (math 24% / reading 44%, grade F, #115 of 265 statewide, top 43%, 801 students, 48% FRL).
- Market conditions: 84 active listings in the ZIP; 83 units permitted in Beauregard Parish in 2024 (0 in 5+ unit buildings).
Forward outlook
- In year one you build about $1k of equity ($864 loan paydown + $488 appreciation (0.4% local appreciation)).
- At projected returns (0.4% appreciation + 3.0% rent growth), your $35k cash investment doubles in ~9 years — after that, you're playing with house money.
Negotiation context
- It's been on market 107 days — a 9% lower offer ($114k) is reasonable based on typical stale-listing flexibility.
- 6 sale attempts since 7y ago; this cycle's ask has dropped $15k (11%) from the opening price — seller is motivated, your offer sets the floor, not the list.
- Current owner paid $50k; list at $125k implies a 150% gain — meaningful room to come down on a strong offer.
Risks & watch-outs
- Watch-outs: flood insurance adds $125/mo.
- Climate carrying-cost: in FEMA flood zone A (mandatory federal flood insurance); severe wind risk, 99% chance of damaging wind over 30y; moderate wildfire risk; extreme-heat days projected 7→22/yr by 2055 (HVAC capex compounding) — expect insurance premiums to compound above CPI over the hold.
Questions for the listing agent
- It's been on market 107 days. Have you received any prior offers? Is the seller open to a 9% concession, seller financing, or rate buy-down credit?
- What's the actual annual flood-insurance premium (NFIP or private), and is the property in a SFHA with mandatory coverage?
- Why hasn't it sold? Are there any deal-killer items the seller is aware of (foundation, flood, title, zoning, code violations)?
- Is there a deadline driving the sale (1031 exchange, divorce, estate, relocation)? That informs how much negotiation room exists.
- Schools are F-rated, which usually means shorter tenancies and higher turnover. Who's the typical renter profile here, and what's been the actual vacancy rate?
- What's the average days-on-market for RENTAL listings here right now (not sales)? A rising rental-DOM trend means longer vacancies and softer asking-rent achievability than the comps imply.
- What's the recent tenant-quality profile in this submarket — average credit score on applications, eviction rate, late-payment / NSF rate, and stable-employment percentage? A property-management company in the area should have these aggregated.
- How much new for-sale + rental construction is in the pipeline within 1–3 miles? Heavy new supply typically softens prices + rents 12–24 months out; constrained supply supports both.
Investment metrics
- 1% rule
- 1.04% ✓
- Cap rate
- 8.77%
- Cash-on-cash
- 8.86%
- DSCR
- 1.39
- GRM
- 8.0
CMA / ARV
No comps found within radius.
Projected returns pro-forma
0.39% appreciation · 3.0% rent growth · sell at horizon
- IRR
- 4.2%
- Equity multiple
- 1.20×
- Total profit
- $7,164
- Equity at exit
- $38,727
- IRR
- 9.1%
- Equity multiple
- 2.04×
- Total profit
- $36,340
- Equity at exit
- $48,563
Cash invested: $34,972 (down + closing). Projections, not guarantees.
Landlord ↔ Tenant lean methodology
- Overall (STATE)
- 90 Strongly Landlord-Friendly
- State Louisiana
- 90 Strongly Landlord-Friendly · R+12
- County
- — inherits STATE
- City
- — inherits STATE
ZIP-level market 70657
- Home prices YoY
- 0.3%
- Active inventory
- 84
- Price-to-rent
- 8.0×
Monthly cashflow live
- Estimated rent
- $1,300 medium interval (Pro) →
- Mortgage (P&I)
- −$655
- Tax from tax record
- −$62 /mo · $743/yr
- Insurance
- −$52
- Flood insurance flood zone
- −$125 /mo · $1,502/yr
- HOA
- −$0
- Vacancy / Maint / Mgmt
- −$273
- Net cashflow
- $133
Break-even live
UW: 25.0% down · 7.5% · 30yr · 1.5% tax · 5.0% vac · 8.0% maint · 8.0% mgmt
Financing live
Cash to close
- Down payment
- $31,225
- Closing costs
- $3,747
- Reserves months
- —
- Total cash needed
- —
Loan-product check · same deal, 3 products live
Conventional
25% down · 7.5% · 30yr
- Down + closing
- —
- Monthly P&I
- —
- Monthly cashflow
- —
- DSCR
- —
- Eligible?
- —
Personal DTI + credit; lowest rate.
DSCR
20% down · 8.5% · 30yr
- Down + closing
- —
- Monthly P&I
- —
- Monthly cashflow
- —
- DSCR
- —
- Eligible?
- —
No personal income docs; deal must DSCR.
Hard money
10% down · 12.0% · 12mo
- Down + closing
- —
- Monthly P&I
- —
- Monthly cashflow
- —
- DSCR
- —
- Eligible?
- —
Short-term bridge; refi at stabilization.
Listing history 18 events
-
2026-04-27status Pending
-
2026-04-20price $124,900
-
2026-04-20price $124,900
-
2026-03-20price $127,900
-
2026-03-20price $127,900
-
2026-02-23price $129,900
-
2026-02-23price $129,900
-
2026-01-14status Active
-
2026-01-06status Pending
-
2026-01-02$139,900 Active
-
2025-02-04status Active
-
2024-10-26price $139,900
-
2024-08-26status Active
-
2024-08-20$159,900 Active
-
2019-10-14soldstatus
-
2019-10-04$100,000
-
2010-10-26soldstatus $50,000
-
2009-12-30soldstatus $30,000
ⓘ Source: listings_history table (triggers on properties + properties_extension) + one-shot
backfill from property_details.listing_events for pre-trigger history.
Tax reassessment forecast LA · Resets to sale price
- Current annual tax
- $743 · $62/mo
- Projected year-2 tax
- $743 · $62/mo
- Expected delta
- $0/yr ($0/mo · 0.0%)
ⓘ Screening estimate from a state-policy table — verify with the county assessor before closing.
Climate risk First Street
- Flood 8/10 Severe FEMA zone A · 99% chance over 30 yrs
- Wildfire 5/10 Major
- Heat 8/10 Severe 7 d/yr ≥110°F today · 22 d/yr by 30 yrs out
- Wind 9/10 Extreme 99% chance of damaging wind over 30 yrs
- Air quality 2/10 Low 2 unhealthy d/yr today · 2 by 30 yrs out
Nearby sold comps map
Loading sold comps map…
Walkable amenities ~0.75 mi
Loading nearby amenities…
Taxation est. · year 1
- Rental income
- $15,601
- − Mortgage interest
- −$6,996
- − Property taxes
- −$743
- − Insurance
- −$2,127
- − Repairs & maintenance
- −$1,248
- − Management
- −$1,248
- − Depreciation
- −$3,633
- Taxable loss
- −$395
- Est. tax savings @ 24.0%
- +$95
- After-tax cash flow
- $1,690/yr
For passive investors: Depreciation is non-cash, so a rental often shows a tax loss while cash-flowing — sheltering income. Rental losses are passive: they offset passive income freely, and up to $25,000/yr can offset ordinary (W-2) income if you actively participate and your MAGI is under $100k (phasing out to $0 by $150k); unused losses carry forward. On sale, claimed depreciation is recaptured at up to 25%, and gains may owe capital-gains tax (a 1031 exchange can defer both). Figures are a year-1 estimate at your 24.0% rate — not tax advice; consult a CPA.
Schools (NCES district)
- District
- Beauregard Parish
- NCES district ID
- 2200180
- Math proficiency
- 30% ▼ -40.00%
- Reading proficiency
- 41% ▼ -35.00%
- Median HH income
- $46,033
- Composite
- 30.34/100
- National rank
- #6265
- State rank
- #32 of 98 in LA
Livability — Gillis
- Score
- 39/100
- State rank
- #468
- US rank
- #27399
Category grades
Schools grade is shown separately in the Schools card above.
Census & demographics
- Population (ZIP)
- 4,807
Population outlook (Beauregard County) Hauer SSP2
- Today (2025)
- 37,760 people
- By 2030
- 38,140 · +1.0%
- By 2040
- 38,518 · +2.0%
- By 2050
- 38,164 · +1.1%
- By 2075
- 36,437 · -3.5%
- By 2100
- 32,493 · -13.9%
Race, ethnicity, and origin ACS 2023
- Neighborhood character
- Predominantly White (96%)
- Race & ethnicity
- White 96% Hispanic / Latino 2% Two or more races 2% Black 1%
- Common ancestry
- Lithuanian 10% Portuguese 1% Iranian 1%
- Foreign-born
- 0%
- Languages at home
- 97% English-only · French/Haitian/Cajun 2% Spanish 1%
Political lean MEDSL · Beauregard
- 2024 margin
- Solid R (+71.3) · D 13.8% · R 85.1% · Other 1.1%
- 2008→2024 swing
- -16.9pp toward R · 2008: -54.3pp · 2024: -71.3pp
- All cycles
- 2024: R+71.3 2020: R+67.5 2016: R+65.3 2012: R+58.2 2008: R+54.3
Not yet ingested
- Civics
- —
Market trends
- HPI YoY
- ▲ 0.39%
- Current HPI
- 144.4678
- Rent YoY
- —
- Metro
- —
- State GDP YoY
- ▲ 3.29%
- F500 in state
- 10
Industry mix (Fortune 500 HQ in LA)
| Industry | F500 HQs | Revenue |
|---|---|---|
| Telecommunications | 2 | $23B |
|
||
| Utilities | 1 | $12B |
|
||
| Wholesale / Distribution | 1 | $5B |
|
||
| Advertising | 1 | $2B |
|
||
Price history
+316.3% since first listed18 events — show timeline
- 2026-04-27 Pending — SWLAR
- 2026-04-20 Price Changed $124,900 SWLAR
- 2026-04-20 Price Changed $124,900 GFPAR
- 2026-03-20 Price Changed $127,900 GFPAR
- 2026-03-20 Price Changed $127,900 SWLAR
- 2026-02-23 Price Changed $129,900 GFPAR
- 2026-02-23 Price Changed $129,900 SWLAR
- 2026-01-14 Relisted — SWLAR
- 2026-01-06 Pending — SWLAR
- 2026-01-02 Listed $139,900 SWLAR
- 2025-02-04 Relisted — GFPAR
- 2024-10-26 Price Changed $139,900 GFPAR
- 2024-08-26 Relisted — GFPAR
- 2024-08-20 Listed $159,900 GFPAR
- 2019-10-14 Sold (MLS) — SWLAR
- 2019-10-04 Listed $100,000 SWLAR
- 2010-10-26 Sold (Public Records) $50,000 Public Records
- 2009-12-30 Sold (Public Records) $30,000 Public Records
Property tax history
+0.8%/yrLatest (2025): $743 · +1.8% YoY. Source: county tax records.
Cash-flow waterfall
monthlySold comps — $/sqft
last 12 mo · ≤1 miLoading sold comps…