 Triplex
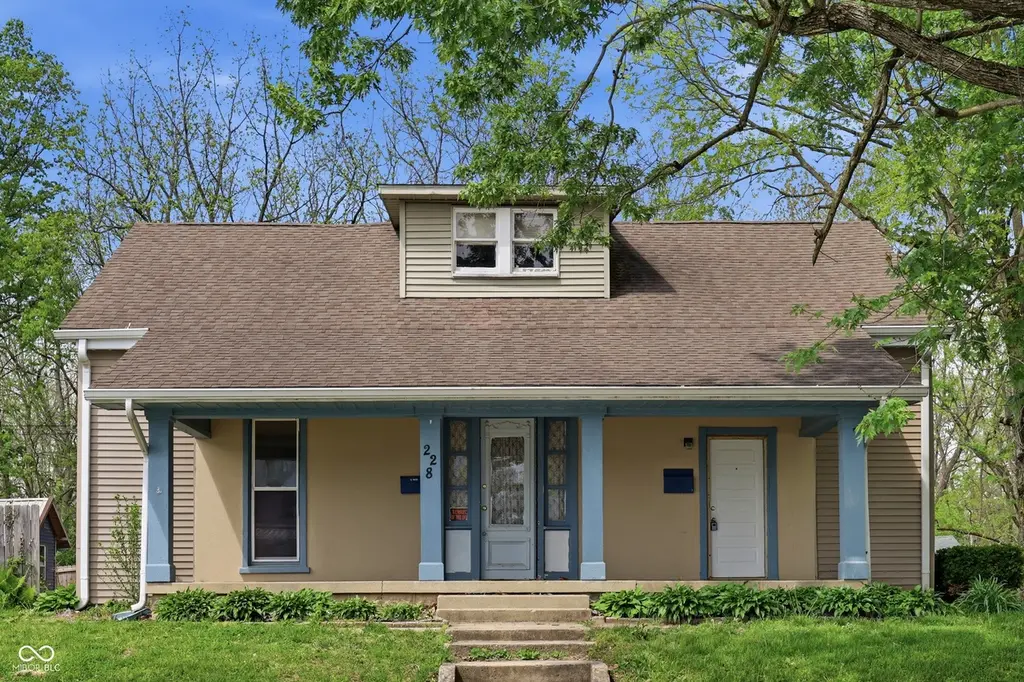
228 S Madison St · Knightstown, IN
Flood risk 1/10 · Minimal
- FEMA flood zone
- X (unshaded)
- Chance of flooding over 30 yrs
- 0.0%
- Est. flood insurance / yr
- $473 – $860
Fire risk 1/10 · Minimal
- Est. fire insurance / yr
- $717 – $1,331
Heat risk 3/10 · Minor
- Hot days now (above 100°F)
- 7 days/yr
- Hot days in 30 yrs
- 18 days/yr
Wind risk 2/10 · Minimal
- Chance of severe wind over 30 yrs
- 1.0%
Air-quality risk 2/10 · Minimal
- Unhealthy air days now
- 1 days/yr
- Unhealthy air days in 30 yrs
- 1 days/yr
Risk factors via First Street. Map © Google.
Why this score? — see what drove the B- grade
The composite is a weighted blend of 9 inputs, each scored 0–100. Each bar is that input's sub-score; the figure is the points it added to the 100-point composite (weight × sub-score).
- Cash flow +30.0/30.0
- 1% rule +10.0/10.0
- DSCR +10.0/10.0
- ARV discount +7.5/15.0
- Livability +3.5/5.0
- Schools +2.7/10.0
- Rent growth +2.5/5.0
- Condition / age +2.5/5.0
- Appreciation +0.0/10.0
$120,000
🖨 Deal sheet 📄 Offer letter ✓ Due diligence
Multi-family units
County records classify this as Multi-Family (2-4 Unit). Listing-text estimate: 3 units. confirmed
Listing remarks
This triplex located at 228 South Madison Street in Knightstown, Indiana. Built in 1950, the property features three units with efficient layouts and offers significant value-add potential. With one unit already renovated and ready for immediate occupancy, an investor can generate rental income while completing the remaining two units. The property consists of two 2-bedroom units and one 1-bedroom unit, appealing to a wide range of tenants. The two-bedroom units include dedicated laundry hookups, a highly desirable amenity that enhances convenience and increases tenant demand. This asset presents a clear opportunity to maximize rental income through strategic renovations and operational imp
Key facts
- Modern amenities
- 7,405 sq ft lot
- Built 1950
Tags
Property features AI
Finance
- Other: Current/possible use: Apartment (>20); Lot under 1/4 acre (0.17 acres)
- Financial info: Three total units; Owner pays sewer and water; Reported gross income: $0; Reported expenses: $0; Unit rents listed: one unit at $750/month, one unit at $900/month
Exterior
- Security: Smoke detector(s)
- Utilities: Frontage road access
- Home design: Residential income property (Triplex); One and one-half stories
- Construction: Brick and stucco exterior
- Exterior features: Storage shed
Interior
- Kitchen: Unit kitchens present (multiple units)
- Bedrooms: One 1-bedroom unit (1 level); One 2-bedroom unit (2 levels)
- Heating & cooling: Natural gas heating; Baseboard heating
- Interior features: Has basement; Smoke detector(s)
Neighborhood map
What this means for you Summary
Snapshot
- This is a 2×2bd/1ba + 1×1bd/1ba units multifamily listed at $120k.
Deal economics
- At list price, monthly cash flow is $2k ($20k/yr) — positive. Per door: $556/mo.
- The deal already cash-flows at list — no discount required.
- Meets the 1% rule at list price ($3k rent vs $120k).
- Recommended offer: $116k (3.0% below list) — sets the bar for market timing.
Location & tenants
- Location reads 70/100 on livability (#170 in IN) — a middle-class / working-renter tenant base. Strengths: crime A+, cost of living A+, housing A+; Watch: health & safety C-, employment D, amenities F.
- C A Beard Memorial School Corporation (rural): math 29% / reading 33% proficiency, ranked #231 of 301 in IN (top 77%) — families likely to look elsewhere, expect single-tenant / working-renter base with shorter leases.
- Zoned schools: Knightstown Elementary School (math 57% / reading 32%, grade F, #379 of 994 statewide, top 41%, 382 students, 49% FRL); Knightstown High School (math 22% / reading 72%, grade D-, #143 of 369 statewide, top 44%, 325 students, 49% FRL).
- Zoned-school proficiency averages 46% at this address vs 31% district-wide (+15 pts) — the actual schools serving this property are materially stronger than the C A Beard Memorial School Corporation average implies; a family-tenant draw the district grade alone would hide.
- Market conditions: 38 active listings in the ZIP; 47 units permitted in Henry County in 2024 (0 in 5+ unit buildings).
Forward outlook
- Local home prices are declining (-3.0%/yr); year-one equity from $830 of loan paydown is wiped out by about $4k of value loss. Plan a longer hold.
- Henry County population projected at -12% by 2050 — secular population decline; favor cash flow + early exit over multi-decade hold.
- At projected returns (-3.0% appreciation + 3.0% rent growth), your $34k cash investment doubles in ~2 years — after that, you're playing with house money.
Negotiation context
- It's been on market 52 days — a 3% lower offer ($116k) is reasonable based on typical stale-listing flexibility.
- 3 sale attempts since 12y ago with the ask held roughly flat each time — persistent listings suggest the price (not the market) is what's stuck; bring a comps-based counter.
Risks & watch-outs
- Watch-outs: built in 1950 — expect roof / HVAC / electrical / plumbing capex.
Questions for the listing agent
- It's been on market 52 days. Have you received any prior offers? Is the seller open to a 3% concession, seller financing, or rate buy-down credit?
- Can we see the unit-by-unit rent roll, current vacancy, and any below-market leases? What's the average tenancy length?
- What capital expenditures (roof, boiler, parking lot, exteriors) have been made in the last 5 years, and what's planned in the next 2?
- Built in 1950 — when were the roof, HVAC, electrical panel, plumbing, and water heater last replaced?
- Is there a deadline driving the sale (1031 exchange, divorce, estate, relocation)? That informs how much negotiation room exists.
- Schools are D-rated, which usually means shorter tenancies and higher turnover. Who's the typical renter profile here, and what's been the actual vacancy rate?
- What's the average days-on-market for RENTAL listings here right now (not sales)? A rising rental-DOM trend means longer vacancies and softer asking-rent achievability than the comps imply.
- What's the recent tenant-quality profile in this submarket — average credit score on applications, eviction rate, late-payment / NSF rate, and stable-employment percentage? A property-management company in the area should have these aggregated.
- How much new apartment / multifamily construction is in the pipeline within 1–3 miles? Heavy new supply (>2% of stock underway) typically softens rents 12–24 months out; light construction supports rent growth.
Investment metrics
- 1% rule
- 2.59% ✓
- Cap rate
- 22.98%
- Cash-on-cash
- 59.60%
- DSCR
- 3.65
- GRM
- 3.2
CMA / ARV
No comps found within radius.
Projected returns pro-forma
-3.0% appreciation · 3.0% rent growth · sell at horizon
- IRR
- 58.3%
- Equity multiple
- 3.59×
- Total profit
- $86,867
- Equity at exit
- $17,892
- IRR
- 63.1%
- Equity multiple
- 7.33×
- Total profit
- $212,588
- Equity at exit
- $10,375
Cash invested: $33,600 (down + closing). Projections, not guarantees.
Landlord ↔ Tenant lean methodology
- Overall (STATE)
- 90 Strongly Landlord-Friendly
- State Indiana
- 90 Strongly Landlord-Friendly · R+11
- County
- — inherits STATE
- City
- — inherits STATE
ZIP-level market 46148
- Home prices YoY
- -19.9%
- Active inventory
- 38
- Price-to-rent
- 9.5×
Monthly cashflow live
- Estimated rent
- $3,104 medium interval (Pro) →
- Mortgage (P&I)
- −$629
- Tax from tax record
- −$104 /mo · $1,248/yr
- Insurance
- −$50
- HOA
- −$0
- Vacancy / Maint / Mgmt
- −$652
- Net cashflow
- $1,669
Break-even live
3-unit breakdown (identical units grouped — click to expand)
| Units | Beds | Baths | Est. rent |
|---|---|---|---|
| 2× units | 2 | 1 | $2,100 |
| #1 | 2 | 1 | $1,050 |
| #2 | 2 | 1 | $1,050 |
| 1× unit | 1 | 1 | $1,003 |
| Total (3 units) | $3,104 | ||
UW: 25.0% down · 7.5% · 30yr · 1.5% tax · 5.0% vac · 8.0% maint · 8.0% mgmt
Financing live
Cash to close
- Down payment
- $30,000
- Closing costs
- $3,600
- Reserves months
- —
- Total cash needed
- —
Loan-product check · same deal, 3 products live
Conventional
25% down · 7.5% · 30yr
- Down + closing
- —
- Monthly P&I
- —
- Monthly cashflow
- —
- DSCR
- —
- Eligible?
- —
Personal DTI + credit; lowest rate.
DSCR
20% down · 8.5% · 30yr
- Down + closing
- —
- Monthly P&I
- —
- Monthly cashflow
- —
- DSCR
- —
- Eligible?
- —
No personal income docs; deal must DSCR.
Hard money
10% down · 12.0% · 12mo
- Down + closing
- —
- Monthly P&I
- —
- Monthly cashflow
- —
- DSCR
- —
- Eligible?
- —
Short-term bridge; refi at stabilization.
Listing history 17 events
-
2026-06-18days on market $120,000 Active 52 DOM
-
2026-06-17days on market $120,000 Active 51 DOM
-
2026-06-16days on market $120,000 Active 50 DOM
-
2026-06-15days on market $120,000 Active 49 DOM
-
2026-06-13days on market $120,000 Active 47 DOM
-
2026-06-09days on market $120,000 Active 43 DOM
-
2026-06-08days on market $120,000 Active 42 DOM
-
2026-06-07days on market $120,000 Active 41 DOM
-
2026-06-03days on market $120,000 Active 37 DOM
-
2026-06-02days on market $120,000 Active 36 DOM
-
2026-06-01days on market $120,000 Active 35 DOM
-
2026-05-31days on market $120,000 Active 34 DOM
-
2026-04-26$120,000 Active
-
2014-10-10historical
-
2014-10-09historical
-
2014-06-23$59,000
-
2014-04-07$59,000
ⓘ Source: listings_history table (triggers on properties + properties_extension) + one-shot
backfill from property_details.listing_events for pre-trigger history.
Tax reassessment forecast IN · Partial reset (capped growth)
- Current annual tax
- $1,248 · $104/mo
- Projected year-2 tax
- $1,248 · $104/mo
- Expected delta
- $0/yr ($0/mo · 0.0%)
ⓘ Screening estimate from a state-policy table — verify with the county assessor before closing.
Climate risk First Street
- Flood 1/10 Low FEMA zone X (unshaded) · 0% chance over 30 yrs
- Wildfire 1/10 Low
- Heat 3/10 Moderate 7 d/yr ≥100°F today · 18 d/yr by 30 yrs out
- Wind 2/10 Low 100% chance of damaging wind over 30 yrs
- Air quality 2/10 Low 1 unhealthy d/yr today · 1 by 30 yrs out
Nearby sold comps map
Loading sold comps map…
Walkable amenities ~0.75 mi
Loading nearby amenities…
Taxation est. · year 1
- Rental income
- $37,248
- − Mortgage interest
- −$6,722
- − Property taxes
- −$1,248
- − Insurance
- −$600
- − Repairs & maintenance
- −$2,980
- − Management
- −$2,980
- − Depreciation
- −$3,491
- Taxable income
- $19,228
- Est. tax owed @ 24.0%
- −$4,615
- After-tax cash flow
- $15,412/yr
For passive investors: Depreciation is non-cash, so a rental often shows a tax loss while cash-flowing — sheltering income. Rental losses are passive: they offset passive income freely, and up to $25,000/yr can offset ordinary (W-2) income if you actively participate and your MAGI is under $100k (phasing out to $0 by $150k); unused losses carry forward. On sale, claimed depreciation is recaptured at up to 25%, and gains may owe capital-gains tax (a 1031 exchange can defer both). Figures are a year-1 estimate at your 24.0% rate — not tax advice; consult a CPA.
Schools (NCES district)
- District
- C A Beard Memorial School Corporation
- NCES district ID
- 1801060
- Math proficiency
- 29% ▼ -11.00%
- Reading proficiency
- 33% ▼ -10.00%
- Median HH income
- $47,269
- Composite
- 26.76/100
- National rank
- #7133
- State rank
- #231 of 301 in IN
Livability — Knightstown
- Score
- 70/100
- State rank
- #170
- US rank
- #8004
Category grades
Schools grade is shown separately in the Schools card above.
Census & demographics
- Census place
- Knightstown, IN
- Population (ZIP)
- 4,948
Population outlook (Henry County) Hauer SSP2
- Today (2025)
- 48,028 people
- By 2030
- 47,125 · -1.9%
- By 2040
- 44,820 · -6.7%
- By 2050
- 42,207 · -12.1%
- By 2075
- 35,814 · -25.4%
- By 2100
- 26,779 · -44.2%
Race, ethnicity, and origin ACS 2023
- Neighborhood character
- Predominantly White (98%)
- Race & ethnicity
- White 98% Two or more races 2%
- Common ancestry
- Serbian 2% Slovak 2% Portuguese 1%
- Foreign-born
- 0%
- Languages at home
- 99% English-only · Spanish 1%
Political lean MEDSL · Henry
- 2024 margin
- Solid R (+47.7) · D 25.3% · R 73.0% · Other 1.7%
- 2008→2024 swing
- -43.8pp toward R · 2008: -3.9pp · 2024: -47.7pp
- All cycles
- 2024: R+47.7 2020: R+45.2 2016: R+43.7 2012: R+17.0 2008: R+3.9
Not yet ingested
- Civics
- —
Market trends
- HPI YoY
- ▼ -53.84%
- Current HPI
- 216.4292
- Rent YoY
- —
- Metro
- —
- State GDP YoY
- ▲ 2.90%
- F500 in state
- 18
Industry mix (Fortune 500 HQ in IN)
| Industry | F500 HQs | Revenue |
|---|---|---|
| Industrial Machinery | 2 | $37B |
|
||
| Healthcare | 1 | $177B |
|
||
| Pharmaceuticals | 1 | $45B |
|
||
| Metals / Steel | 1 | $18B |
|
||
| Agriculture | 1 | $17B |
|
||
| Packaging | 1 | $12B |
|
||
Price history
+103.4% since first listed5 events — show timeline
- 2026-04-26 Listed $120,000 MIBOR as Distributed by MLS Grid
- 2014-10-10 Listing Removed — MIBOR as Distributed by MLS Grid
- 2014-10-09 Listing Removed — MIBOR as Distributed by MLS Grid
- 2014-06-23 Listed $59,000 MIBOR as Distributed by MLS Grid
- 2014-04-07 Listed $59,000 MIBOR as Distributed by MLS Grid
Property tax history
+4.6%/yrLatest (2024): $1,248 · +38.0% YoY. Source: county tax records.
Cash-flow waterfall
monthlySold comps — $/sqft
last 12 mo · ≤1 miLoading sold comps…