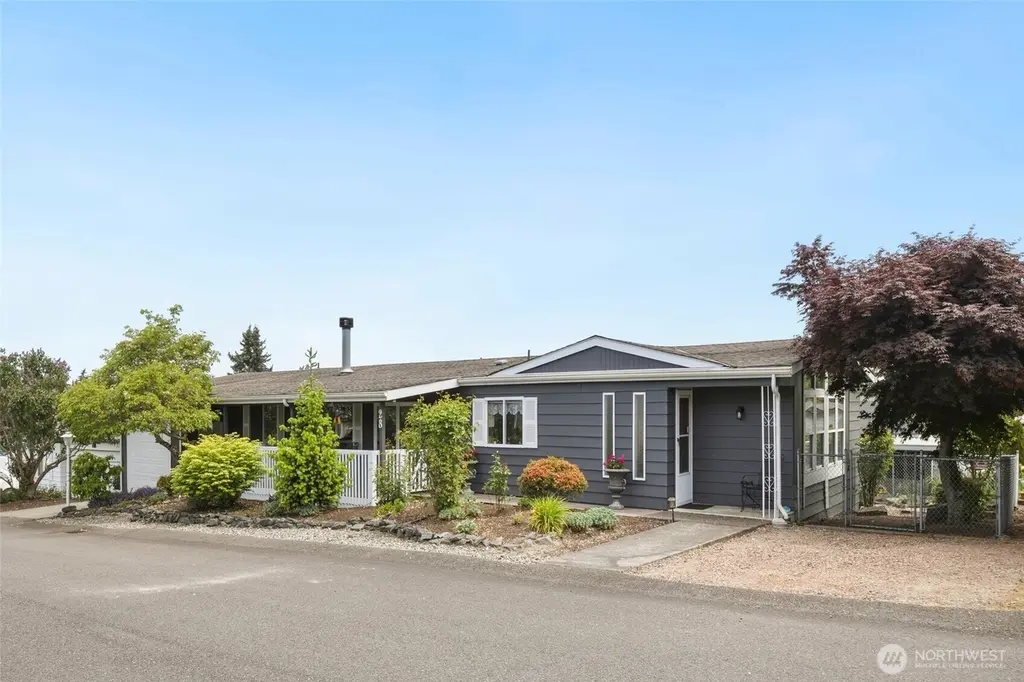
2500 Alder St #28 · Milton, WA
Flood risk 1/10 · Minimal
- FEMA flood zone
- X (unshaded)
- Chance of flooding over 30 yrs
- 0.0%
- Est. flood insurance / yr
- $507 – $1,088
Fire risk 1/10 · Minimal
- Est. fire insurance / yr
- $604 – $1,122
Heat risk 3/10 · Minor
- Hot days now (above 88°F)
- 7 days/yr
- Hot days in 30 yrs
- 15 days/yr
Wind risk 1/10 · Minimal
- Chance of severe wind over 30 yrs
- —
Air-quality risk 7/10 · Major
- Unhealthy air days now
- 10 days/yr
- Unhealthy air days in 30 yrs
- 11 days/yr
Risk factors via First Street. Map © Google.
Why this score? — see what drove the B- grade
The composite is a weighted blend of 9 inputs, each scored 0–100. Each bar is that input's sub-score; the figure is the points it added to the 100-point composite (weight × sub-score).
- Cash flow +30.0/30.0
- 1% rule +10.0/10.0
- DSCR +10.0/10.0
- ARV discount +5.8/15.0
- Schools +4.7/10.0
- Livability +3.9/5.0
- Rent growth +2.5/5.0
- Condition / age +2.5/5.0
- Appreciation +0.0/10.0
$143,500
🖨 Deal sheet 📄 Offer letter ✓ Due diligence
Listing remarks
Welcome to Heather Hills, a premier 55+ gated community in Milton. Close to all amenities but tucked away from the hustle & bustle. This home has been updated inside & out. Updated kitchen has all the bells & whistles. Textured walls, rounded corners, neutral colors throughout the home. Energy efficient furnace & heat pump - A/C. Freshly painted exterior, newer Trex deck, fenced yard are some the many features of this level entry home. Cozy up to the wood fireplace in the family room. Slider to covered deck & garage access. Primary suite w/ walk in closet & an updated 4 pc bath for your comfort. Guest bedroom with direct access to 3/4 bathroom. Utility ro
Key facts
- Covered deck
- Newer trex deck
- Fenced yard
Tags
Property features AI
Finance
- Other: Bus routes nearby (402 / 501)
- Financial info: Listing terms: Cash or Conventional
- HOA & community: Senior community (senior exemption applies); Park name: Heather Hills; 132 homes in park; Pets allowed: cats and dogs; Land lease: $1,340
Exterior
- Parking: Individual garage; Uncovered parking; Has garage
- Security: Security gate
- Utilities: Public water; Public sewer; Electric power; Water heater: electric; Cable: Comcast; Internet: T-Mobile / Comcast; Energy sources: Electric and wood
- Home design: Manufactured home (double wide); One level; Pillar/post/pier foundation; Faces west; Good condition; Manufactured after 6/15/1976; Mobile home remains in place
- Construction: Metal/vinyl construction materials; Composition roof; Metal skirting
- Exterior features: Corner lot; Patio/porch/deck; Landscaped; Double-pane windows; Vaulted ceilings; Walk-in closet (built-in); Metal/vinyl exterior
Interior
- Kitchen: Dishwasher; Garbage disposal; Microwave; Refrigerator
- Bedrooms: 2 bedrooms
- Flooring: Ceramic tile; Laminate; Vinyl / Vinyl plank; Carpet
- Bathrooms: 1 full bathroom; 1 three-quarter bathroom; 1 bathtub; 2 showers
- Heating & cooling: Forced air heating; Heat pump; Forced air cooling; High-efficiency cooling
- Interior features: Fireplace (wood burning); Water heater (electric)
- Laundry & utility: Washer; Dryer; Utility room; Water heater located in closet
Neighborhood map
What this means for you Summary
Snapshot
- This is a 2-bed/2.0-bath manufactured listed at $144k.
Deal economics
- At list price, monthly cash flow is $1k ($12k/yr) — positive.
- The deal already cash-flows at list — no discount required.
- Meets the 1% rule at list price ($3k rent vs $144k).
- Recommended offer: $139k (3.0% below list) — sets the bar for market timing.
- Cap rate 14.7% vs local median 2.5% in Milton — top-decile yield for the area; either an underpriced asset or a hidden risk that comps aren't pricing in. Stress-test before assuming the spread holds.
Location & tenants
- Location reads 77/100 on livability (#145 in WA, #2,880 nationally) — a middle-class / working-renter tenant base. Strengths: commute A+, housing A+, health & safety A+; Watch: crime D-, amenities F, cost of living F.
- Fife School District (suburban): math 44% / reading 57% proficiency, ranked #127 of 291 in WA (top 44%) — acceptable for families but not a draw, mixed tenant base, ~2y average lease.
- Market conditions: 47 active listings in the ZIP; 5 comparable units currently listed for rent nearby; rentals leasing fast (median 2d on market — plan ~1-2 weeks tenant-placement turnaround); solid renter incomes; 10,555 units permitted in King County in 2024 (7,119 in 5+ unit buildings).
- This rent runs 31% of the median local income ($97k/yr) — at the standard rent-burdened threshold; future hikes will face affordability resistance.
Forward outlook
- Local home prices are declining (-3.0%/yr); year-one equity from $992 of loan paydown is wiped out by about $4k of value loss. Plan a longer hold.
- King County population projected at +44% by 2050 — long-run rental-demand tailwind backs the buy-and-hold thesis.
- At projected returns (-3.0% appreciation + 3.0% rent growth), your $40k cash investment doubles in ~4 years — after that, you're playing with house money.
Negotiation context
- It's been on market 32 days — a 3% lower offer ($139k) is reasonable based on typical stale-listing flexibility.
- 8 sale attempts since 23y ago with the ask held roughly flat each time — persistent listings suggest the price (not the market) is what's stuck; bring a comps-based counter.
Questions for the listing agent
- It's been on market 32 days. Have you received any prior offers? Is the seller open to a 3% concession, seller financing, or rate buy-down credit?
- Built in 1978 — when were the roof, HVAC, electrical panel, plumbing, and water heater last replaced?
- Is there a deadline driving the sale (1031 exchange, divorce, estate, relocation)? That informs how much negotiation room exists.
- Crime grade is D in this area — have there been break-ins, vandalism, or insurance claims at this property in the last 3 years? What carrier currently insures it and at what premium?
- What's the average days-on-market for RENTAL listings here right now (not sales)? A rising rental-DOM trend means longer vacancies and softer asking-rent achievability than the comps imply.
- What's the recent tenant-quality profile in this submarket — average credit score on applications, eviction rate, late-payment / NSF rate, and stable-employment percentage? A property-management company in the area should have these aggregated.
- How much new for-sale + rental construction is in the pipeline within 1–3 miles? Heavy new supply typically softens prices + rents 12–24 months out; constrained supply supports both.
Investment metrics
- 1% rule
- 1.76% ✓
- Cap rate
- 14.72%
- Cash-on-cash
- 30.09%
- DSCR
- 2.34
- GRM
- 4.7
CMA / ARV
- ARV (on-the-fly)
- $138,240
- Comps found
- 12
Show comp detail 12 sales within ~0.75 mi
| Address | Dist | Beds/Ba | Sqft | Sold | Price | $/sf | Match |
|---|---|---|---|---|---|---|---|
| 2500 Alder St #302 | 0.00mi | 2/2.0 | 1,536 (0%) | 11mo | $132,000 | $86 | 91 |
| 2500 Alder St #52 | 0.13mi | 2/2.0 | 1,536 (0%) | 5mo | $145,000 | $94 | 90 |
| 2500 Alder St #33 | 0.00mi | 2/2.0 | 1,440 (-6%) | 2mo | $130,000 | $90 | 88 |
| 2500 Alder St #63 | 0.00mi | 3/2.0 (+1) | 1,566 (+2%) | 6mo | $155,000 | $99 | 87 |
| 2500 Alder St #221 | 0.00mi | 3/2.0 (+1) | 1,536 (0%) | 13mo | $110,000 | $72 | 84 |
| 2500 Alder St #312 | 0.00mi | 3/2.0 (+1) | 1,632 (+6%) | 8mo | $105,000 | $64 | 78 |
| 2500 Alder St #202 | 0.00mi | 2/2.0 | 1,440 (-6%) | 16mo | $59,995 | $42 | 76 |
| 2500 Alder St #318 | 0.00mi | 2/2.0 | 1,650 (+7%) | 20mo | $82,000 | $50 | 70 |
| 97 28th Ave S | 0.19mi | 2/2.0 | 1,680 (+9%) | 9mo | $433,000 | $258 | 68 |
| 2500 Alder St #6 | 0.00mi | 3/2.0 (+1) | 1,344 (-12%) | 16mo | $85,000 | $63 | 61 |
| 37301 28th Ave S #34 | 0.58mi | 2/2.0 | 1,568 (+2%) | 11mo | $300,000 | $191 | 61 |
| 37301 28th Ave S #4 | 0.60mi | 2/2.0 | 1,568 (+2%) | 11mo | $262,500 | $167 | 59 |
Match score weights: distance 35% · size 25% · config 20% · recency 20%. Top-matched comps best support the ARV.
Projected returns pro-forma
-3.0% appreciation · 3.0% rent growth · sell at horizon
- IRR
- 24.7%
- Equity multiple
- 2.02×
- Total profit
- $40,962
- Equity at exit
- $21,396
- IRR
- 32.5%
- Equity multiple
- 3.95×
- Total profit
- $118,463
- Equity at exit
- $12,407
Cash invested: $40,180 (down + closing). Projections, not guarantees.
Landlord ↔ Tenant lean methodology
- Overall (STATE)
- 28 Tenant-Leaning
- State Washington
- 28 Tenant-Leaning · D+8
- County
- — inherits STATE
- City
- — inherits STATE
ZIP-level market 98354
- Active inventory
- 47
- Price-to-rent
- 4.7×
Monthly cashflow live
- Estimated rent
- $2,531 high interval (Pro) →
- Mortgage (P&I)
- −$753
- Tax est. 1.5%
- −$179 /mo · $2,152/yr
- Insurance
- −$60
- HOA
- −$0
- Vacancy / Maint / Mgmt
- −$531
- Net cashflow
- $1,008
Break-even live
UW: 25.0% down · 7.5% · 30yr · 1.5% tax · 5.0% vac · 8.0% maint · 8.0% mgmt
Financing live
Cash to close
- Down payment
- $35,875
- Closing costs
- $4,305
- Reserves months
- —
- Total cash needed
- —
Loan-product check · same deal, 3 products live
Conventional
25% down · 7.5% · 30yr
- Down + closing
- —
- Monthly P&I
- —
- Monthly cashflow
- —
- DSCR
- —
- Eligible?
- —
Personal DTI + credit; lowest rate.
DSCR
20% down · 8.5% · 30yr
- Down + closing
- —
- Monthly P&I
- —
- Monthly cashflow
- —
- DSCR
- —
- Eligible?
- —
No personal income docs; deal must DSCR.
Hard money
10% down · 12.0% · 12mo
- Down + closing
- —
- Monthly P&I
- —
- Monthly cashflow
- —
- DSCR
- —
- Eligible?
- —
Short-term bridge; refi at stabilization.
Rent comps 5 comps
| Address | Beds | Baths | Sqft | Rent | $/sqft | DOM | Units | Dist |
|---|---|---|---|---|---|---|---|---|
| 1211 S 376th St Milton, WA | 1.0–2.0 | 1.0–2.0 | 952 | $3,350 | $3.52 | 1d | 63 | 0.84mi |
| 1926 S 368th Pl #206 Federal Way, WA | 2.0 | 2.5 | 1176 | $2,995 | $2.55 | 1d | 1 | 0.89mi |
| 2800 Queens Way Milton, WA | 1.0–3.0 | 1.0–2.5 | 1015 | $2,346 | $2.31 | 1d | 26 | 1.00mi |
| 10304 20th St E Edgewood, WA | 1.0–3.0 | 1.0–2.0 | 911 | $2,250 | $2.47 | 1d | 18 | 1.48mi |
| 2020 S 360th St Federal Way, WA | 1.0–3.0 | 1.0–2.0 | 971 | $1,915 | $1.97 | 1d | 24 | 1.50mi |
Listing history 35 events
-
2026-06-18days on market $143,500 Active 32 DOM
-
2026-06-17days on market $143,500 Active 31 DOM
-
2026-06-16days on market $143,500 Active 30 DOM
-
2026-06-15days on market $143,500 Active 29 DOM
-
2026-06-13days on market $143,500 Active 27 DOM
-
2026-06-13days on market $143,500 Active 26 DOM
-
2026-06-09days on market $143,500 Active 23 DOM
-
2026-06-08days on market $143,500 Active 22 DOM
-
2026-06-07days on market $143,500 Active 21 DOM
-
2026-06-04days on market $143,500 Active 18 DOM
-
2026-06-03days on market $143,500 Active 17 DOM
-
2026-06-02days on market $143,500 Active 16 DOM
-
2026-06-01days on market $143,500 Active 15 DOM
-
2026-05-31days on market $143,500 Active 14 DOM
-
2026-05-17$143,500 Active
-
2023-11-08soldstatus $138,000 Closed
-
2023-11-07status Pending
-
2023-10-29status Pending - Backup Offer Requested
-
2023-09-12price $144,500
-
2023-08-29status Active
-
2023-08-27status Pending - Backup Offer Requested
-
2023-07-28status Active
-
2023-07-21status Pending - Backup Offer Requested
-
2023-06-30price $150,000
-
2023-05-30status Active
-
2023-05-25status Pending - Backup Offer Requested
-
2023-04-24$155,780 Active
-
2016-04-25soldstatus $60,000 Sold
-
2016-04-10status Pending
-
2016-04-04status Pending Inspection
-
2016-03-24$60,000 Active
-
2006-09-25soldstatus $98,000
-
2006-06-20$98,000
-
2004-03-25soldstatus $54,000
-
2003-12-04$59,950
ⓘ Source: listings_history table (triggers on properties + properties_extension) + one-shot
backfill from property_details.listing_events for pre-trigger history.
Climate risk First Street
- Flood 1/10 Low FEMA zone X (unshaded) · 0% chance over 30 yrs
- Wildfire 1/10 Low
- Heat 3/10 Moderate 7 d/yr ≥88°F today · 15 d/yr by 30 yrs out
- Wind 1/10 Low
- Air quality 7/10 Severe 10 unhealthy d/yr today · 11 by 30 yrs out
Nearby sold comps map
Loading sold comps map…
Walkable amenities ~0.75 mi
Loading nearby amenities…
Taxation est. · year 1
- Rental income
- $30,370
- − Mortgage interest
- −$8,038
- − Property taxes
- −$2,152
- − Insurance
- −$718
- − Repairs & maintenance
- −$2,430
- − Management
- −$2,430
- − Depreciation
- −$4,175
- Taxable income
- $10,428
- Est. tax owed @ 24.0%
- −$2,503
- After-tax cash flow
- $9,589/yr
For passive investors: Depreciation is non-cash, so a rental often shows a tax loss while cash-flowing — sheltering income. Rental losses are passive: they offset passive income freely, and up to $25,000/yr can offset ordinary (W-2) income if you actively participate and your MAGI is under $100k (phasing out to $0 by $150k); unused losses carry forward. On sale, claimed depreciation is recaptured at up to 25%, and gains may owe capital-gains tax (a 1031 exchange can defer both). Figures are a year-1 estimate at your 24.0% rate — not tax advice; consult a CPA.
Schools (NCES district)
- District
- Fife School District
- NCES district ID
- 5302880
- Math proficiency
- 44% ▼ -4.00%
- Reading proficiency
- 57% ▼ -1.00%
- Median HH income
- $64,187
- Composite
- 46.52/100
- National rank
- #5310
- State rank
- #127 of 291 in WA
Livability — Milton
- Score
- 77/100
- State rank
- #145
- US rank
- #2880
Category grades
Schools grade is shown separately in the Schools card above.
Census & demographics
- Census place
- Milton, WA
- County
- Pierce County · 788,257 people
- City population
- 8,597
- Metro
- Seattle-Tacoma-Bellevue, WA
- Population (ZIP)
- 8,597
- Household income
- $96,866
- Rent vs Own
- Severe rent burden
- 465.0
Population outlook (King County) Hauer SSP2
- Today (2025)
- 2,576,485 people
- By 2030
- 2,803,316 · +8.8%
- By 2040
- 3,255,921 · +26.4%
- By 2050
- 3,706,444 · +43.9%
- By 2075
- 4,746,063 · +84.2%
- By 2100
- 5,407,730 · +109.9%
Race, ethnicity, and origin ACS 2023
- Neighborhood character
- Predominantly White (68%)
- Race & ethnicity
- White 68% Hispanic / Latino 14% Two or more races 10% Asian 6% Black 3% Native American 1%
- Hispanic origin (detail)
- Mexican 10% Puerto Rican 1%
- Common ancestry
- Subsaharan African 4% Scotch-Irish 4% Portuguese 4%
- Foreign-born
- 13% · Canada, South Korea, Vietnam
- Languages at home
- 78% English-only · Spanish 9% Russian/Polish/Slavic 5% German/W. Germanic 2%
Political lean MEDSL · King
- 2024 margin
- Solid D (+51.7) · D 74.2% · R 22.5% · Other 3.4%
- 2008→2024 swing
- +9.6pp toward D · 2008: 42.1pp · 2024: 51.7pp
- All cycles
- 2024: D+51.7 2020: D+52.7 2016: D+50.4 2012: D+39.9 2008: D+42.1
Not yet ingested
- Civics
- —
Market trends
- HPI YoY
- ▼ -248.03%
- Current HPI
- 319.2485
- Rent YoY
- —
- Metro
- Seattle-Tacoma-Bellevue, WA
- State GDP YoY
- ▲ 4.65%
- F500 in state
- 22
Industry mix (Fortune 500 HQ in WA)
| Industry | F500 HQs | Revenue |
|---|---|---|
| Retail | 2 | $269B |
|
||
| Technology / Retail | 1 | $638B |
|
||
| Technology | 1 | $245B |
|
||
| Telecommunications | 1 | $38B |
|
||
| Food / Beverage | 1 | $36B |
|
||
| Automotive / Trucks | 1 | $34B |
|
||
Price history
+139.4% since first listed21 events — show timeline
- 2026-05-17 Listed $143,500 NWMLS as Distributed by MLS Grid
- 2023-11-08 Sold (MLS) $138,000 NWMLS as Distributed by MLS Grid
- 2023-11-07 Pending — NWMLS as Distributed by MLS Grid
- 2023-10-29 Pending — NWMLS as Distributed by MLS Grid
- 2023-09-12 Price Changed $144,500 NWMLS as Distributed by MLS Grid
- 2023-08-29 Relisted — NWMLS as Distributed by MLS Grid
- 2023-08-27 Pending — NWMLS as Distributed by MLS Grid
- 2023-07-28 Relisted — NWMLS as Distributed by MLS Grid
- 2023-07-21 Pending — NWMLS as Distributed by MLS Grid
- 2023-06-30 Price Changed $150,000 NWMLS as Distributed by MLS Grid
- 2023-05-30 Relisted — NWMLS as Distributed by MLS Grid
- 2023-05-25 Pending — NWMLS as Distributed by MLS Grid
- 2023-04-24 Listed $155,780 NWMLS as Distributed by MLS Grid
- 2016-04-25 Sold (MLS) $60,000 NWMLS as Distributed by MLS Grid
- 2016-04-10 Pending — NWMLS as Distributed by MLS Grid
- 2016-04-04 Pending — NWMLS as Distributed by MLS Grid
- 2016-03-24 Listed $60,000 NWMLS as Distributed by MLS Grid
- 2006-09-25 Sold (MLS) $98,000 NWMLS as Distributed by MLS Grid
- 2006-06-20 Listed $98,000 NWMLS as Distributed by MLS Grid
- 2004-03-25 Sold (MLS) $54,000 NWMLS as Distributed by MLS Grid
- 2003-12-04 Listed $59,950 NWMLS as Distributed by MLS Grid
Cash-flow waterfall
monthlySold comps — $/sqft
last 12 mo · ≤1 miLoading sold comps…