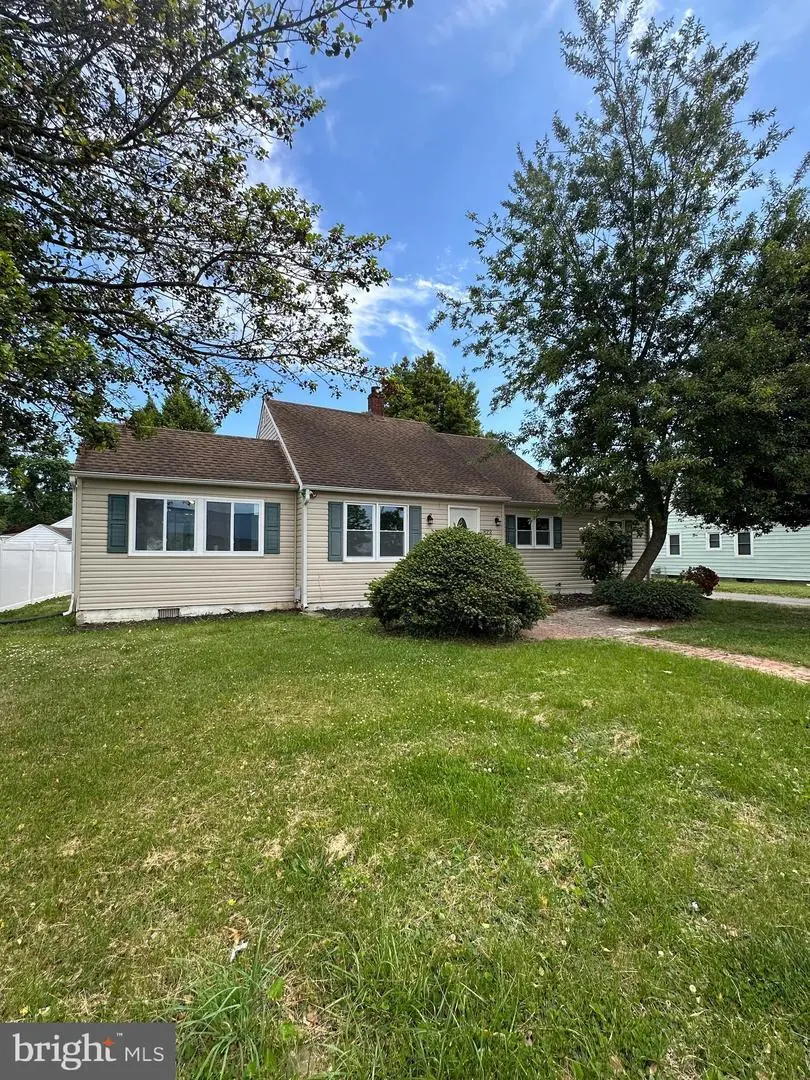
822 White Oak Rd · Dover, DE
Flood risk 1/10 · Minimal
- FEMA flood zone
- X (unshaded)
- Chance of flooding over 30 yrs
- 0.0%
- Est. flood insurance / yr
- $473 – $860
Fire risk 1/10 · Minimal
- Est. fire insurance / yr
- $476 – $884
Heat risk 8/10 · Major
- Hot days now (above 101°F)
- 7 days/yr
- Hot days in 30 yrs
- 16 days/yr
Wind risk 8/10 · Major
- Chance of severe wind over 30 yrs
- 80.0%
Air-quality risk 2/10 · Minimal
- Unhealthy air days now
- 1 days/yr
- Unhealthy air days in 30 yrs
- 2 days/yr
Risk factors via First Street. Map © Google.
Why this score? — see what drove the D- grade
The composite is a weighted blend of 9 inputs, each scored 0–100. Each bar is that input's sub-score; the figure is the points it added to the 100-point composite (weight × sub-score).
- Cash flow +12.2/30.0
- ARV discount +7.9/15.0
- DSCR +3.6/10.0
- Livability +3.4/5.0
- Rent growth +3.0/5.0
- Condition / age +2.5/5.0
- 1% rule +2.4/10.0
- Schools +2.0/10.0
- Appreciation +0.0/10.0
$279,900
🖨 Deal sheet 📄 Offer letter ✓ Due diligence
Listing remarks MLS
Welcome to 822 White Oak Road. This cozy 3 bedroom cape is located in Edgehill which is conveniently located to the hub of Dover. Depending on the amount of space you need, This home could be used as a 3 bedroom with a family room or a 4th bedroom. One of the bedrooms are located upstairs for privacy and offers an additional area for sitting or Storage. There are 3 off street parking located at the rear of the property. Enjoy the great outdoors with patio areas off the kitchen and family room. Call today to schedule your tour of this great home!
Key facts
- 0.24 acre lot
- Built 1951
- Listed 12 days
Property features AI
Exterior
- Parking: Driveway
- Utilities: Public water; Public sewer; Electric hot water; 200+ amp electrical service; Municipal trash service
- Home design: Detached single-family home; Pitched shingle roof; Entry levels include main and upper floors; Effective remodel year 2003
- Construction: Vinyl siding exterior; Brick/mortar foundation; Built prior to 2003 (assessor data)
- Exterior features: Level lot; Patio(s); Street lighting
Interior
- Kitchen: Eat-in kitchen
- Bedrooms: Three bedrooms on the main level; One bedroom on the first upper level
- Bathrooms: Two full bathrooms (one on main level, one on first upper level)
- Heating & cooling: Heat pump with electric backup; Central air conditioning
- Interior features: Eat-in kitchen; Full unfinished basement
- Laundry & utility: Laundry located in the basement
Neighborhood map
What this means for you Summary
Snapshot
- This is a 3-bed/1.0-bath single-family listed at $280k.
Deal economics
- At list price, monthly cash flow is $-58 ($-699/yr) — negative.
- To cash-flow at today's rent, offer at most $270k (3.7% below list).
- To meet the 1% rule (rent ≥ 1% of price), the offer needs to be $207k (25.9% below list).
- Recommended offer: $207k (25.9% below list) — sets the bar for 1% rule.
Location & tenants
- Location reads 67/100 on livability (#38 in DE) — a middle-class / working-renter tenant base. Strengths: amenities A+, cost of living A+, housing A+; Watch: schools C-, crime F, commute F.
- Capital School District (urban): math 14% / reading 31% proficiency, ranked #24 of 26 in DE (top 92%) — low school quality limits family demand, transient renter base, plan for 1-2y turnover.
- Market conditions: Rents rising (+2.0%/yr); 184 active listings in the ZIP; 13 comparable units currently listed for rent nearby; rentals lingering (median 44d on market — plan ~5-8 weeks vacancy on turnover, expect pricing pressure); 100% of comp listings sitting > 30 days — soft ceiling on asking rent; 1,201 units permitted in Kent County in 2024 (116 in 5+ unit buildings).
- This rent runs 37% of the median local income ($66k/yr) — at the standard rent-burdened threshold; future hikes will face affordability resistance.
Forward outlook
- Local home prices are declining (-3.0%/yr); year-one equity from $2k of loan paydown is wiped out by about $8k of value loss. Plan a longer hold.
- Kent County population projected at +22% by 2050 — long-run rental-demand tailwind backs the buy-and-hold thesis.
Negotiation context
- Only 12 days on market — expect competitive offers; lowballing is unlikely to land.
- 11 sale attempts since 23y ago with the ask held roughly flat each time — persistent listings suggest the price (not the market) is what's stuck; bring a comps-based counter.
- Current owner paid $126k; list at $280k implies a 122% gain — meaningful room to come down on a strong offer.
Risks & watch-outs
- Watch-outs: built in 1951 — expect roof / HVAC / electrical / plumbing capex.
- Climate carrying-cost: severe wind risk, 80% chance of damaging wind over 30y; extreme-heat days projected 7→16/yr by 2055 (HVAC capex compounding) — expect insurance premiums to compound above CPI over the hold.
Questions for the listing agent
- What do current leases actually rent for vs. the listed asking? Can we see a recent rent roll and the last 12 months of T-12 income?
- Built in 1951 — when were the roof, HVAC, electrical panel, plumbing, and water heater last replaced?
- Is there a deadline driving the sale (1031 exchange, divorce, estate, relocation)? That informs how much negotiation room exists.
- Crime grade is F in this area — have there been break-ins, vandalism, or insurance claims at this property in the last 3 years? What carrier currently insures it and at what premium?
- The area grade is low — what's the realistic commute time and amenity access for the typical tenant pool here? Any planned neighborhood developments (good or bad) we should know about?
- What's the average days-on-market for RENTAL listings here right now (not sales)? A rising rental-DOM trend means longer vacancies and softer asking-rent achievability than the comps imply.
- What's the recent tenant-quality profile in this submarket — average credit score on applications, eviction rate, late-payment / NSF rate, and stable-employment percentage? A property-management company in the area should have these aggregated.
- How much new for-sale + rental construction is in the pipeline within 1–3 miles? Heavy new supply typically softens prices + rents 12–24 months out; constrained supply supports both.
Investment metrics
- 1% rule
- 0.74% ✗
- Cap rate
- 6.04%
- Cash-on-cash
- -0.89%
- DSCR
- 0.96
- GRM
- 11.2
CMA / ARV
- ARV (median comp)
- $282,509
- List price
- $279,900
- Delta
- -0.92%
- Verdict
- FAIR
- Comps
- 20 within 1.0 mi
Show comp detail 12 sales within ~0.75 mi
| Address | Dist | Beds/Ba | Sqft | Sold | Price | $/sf | Match |
|---|---|---|---|---|---|---|---|
| 630 Maple Pkwy | 0.22mi | 4/1.0 (+1) | 1,552 (-2%) | 2mo | $290,000 | $187 | 80 |
| 727 E Division St | 0.33mi | 3/1.0 | 1,706 (+8%) | 6mo | $250,000 | $147 | 67 |
| 40 Anchor Ln | 0.59mi | 3/2.0 | 1,556 (-2%) | 2mo | $330,000 | $212 | 64 |
| 920 E Division St | 0.38mi | 3/2.0 | 1,715 (+8%) | 1mo | $335,000 | $195 | 64 |
| 931 Boggs Dr | 0.51mi | 4/2.0 (+1) | 1,588 (+0%) | 9mo | $265,000 | $167 | 59 |
| 337 Macarthur Dr | 0.46mi | 3/2.0 | 1,690 (+7%) | 6mo | $205,000 | $121 | 58 |
| 848 Townsend Blvd | 0.63mi | 3/3.0 | 1,548 (-2%) | 4mo | $329,000 | $213 | 56 |
| 529 Greenhill Rd | 0.50mi | 3/1.0 | 1,804 (+14%) | 2mo | $220,000 | $122 | 52 |
| 46 Rodney Rd | 0.61mi | 3/1.5 | 1,701 (+8%) | 8mo | $290,000 | $170 | 50 |
| 870 E Loockerman St | 0.44mi | 4/1.0 (+1) | 1,748 (+11%) | 9mo | $289,900 | $166 | 50 |
| 789 Miller Dr | 0.72mi | 3/2.5 | 1,673 (+6%) | 9mo | $290,000 | $173 | 44 |
| 1401 S Hancock Ave | 0.65mi | 3/2.0 | 1,344 (-15%) | 5mo | $324,900 | $242 | 37 |
Match score weights: distance 35% · size 25% · config 20% · recency 20%. Top-matched comps best support the ARV.
Projected returns pro-forma
-3.0% appreciation · 2.03% rent growth · sell at horizon
- IRR
- -18.8%
- Equity multiple
- 0.35×
- Total profit
- $-51,188
- Equity at exit
- $41,734
- IRR
- -13.2%
- Equity multiple
- 0.26×
- Total profit
- $-57,889
- Equity at exit
- $24,201
Cash invested: $78,372 (down + closing). Projections, not guarantees.
Landlord ↔ Tenant lean methodology
- Overall (STATE)
- 70 Landlord-Friendly
- State Delaware
- 70 Landlord-Friendly · D+7
- County
- — inherits STATE
- City
- — inherits STATE
ZIP-level market 19901
- Rents YoY
- 2.0%
- Active inventory
- 184
- Price-to-rent
- 11.2×
Monthly cashflow live
- Estimated rent
- $2,075 high interval (Pro) →
- Mortgage (P&I)
- −$1,468
- Tax from tax record
- −$113 /mo · $1,353/yr
- Insurance
- −$117
- HOA
- −$0
- Vacancy / Maint / Mgmt
- −$436
- Net cashflow
- $-58
Break-even live
UW: 25.0% down · 7.5% · 30yr · 1.5% tax · 5.0% vac · 8.0% maint · 8.0% mgmt
Financing live
Cash to close
- Down payment
- $69,975
- Closing costs
- $8,397
- Reserves months
- —
- Total cash needed
- —
Loan-product check · same deal, 3 products live
Conventional
25% down · 7.5% · 30yr
- Down + closing
- —
- Monthly P&I
- —
- Monthly cashflow
- —
- DSCR
- —
- Eligible?
- —
Personal DTI + credit; lowest rate.
DSCR
20% down · 8.5% · 30yr
- Down + closing
- —
- Monthly P&I
- —
- Monthly cashflow
- —
- DSCR
- —
- Eligible?
- —
No personal income docs; deal must DSCR.
Hard money
10% down · 12.0% · 12mo
- Down + closing
- —
- Monthly P&I
- —
- Monthly cashflow
- —
- DSCR
- —
- Eligible?
- —
Short-term bridge; refi at stabilization.
Rent comps 13 comps
| Address | Beds | Baths | Sqft | Rent | $/sqft | DOM | Units | Dist |
|---|---|---|---|---|---|---|---|---|
| 104 Bayard Ave Dover, DE | 3.0 | 2.5 | 2168 | $2,350 | $1.08 | 43d | 1 | 0.56mi |
| 201 N American Ave Dover, DE | 3.0 | 2.0 | 1600 | $2,000 | $1.25 | 43d | 1 | 0.63mi |
| 91 Chatham Ct Dover, DE | 2.0 | 2.5 | 1530 | $1,750 | $1.14 | 43d | 1 | 0.68mi |
| 214 W Division St Dover, DE | 3.0 | 2.0 | 2072 | $2,350 | $1.13 | 43d | 1 | 0.93mi |
| 216 W Division St Dover, DE | 3.0 | 1.0 | 2072 | $2,200 | $1.06 | 43d | 1 | 0.93mi |
| 480 Country Dr Dover, DE | 3.0 | 1.0–2.0 | 715 | $1,875 | $2.62 | 43d | 22 | 0.96mi |
| 205 Fairfax Ln Dover, DE | 3.0 | 2.5 | 1428 | $1,975 | $1.38 | 43d | 1 | 1.04mi |
| 203 Fairfax Ln Dover, DE | 3.0 | 2.5 | 1428 | $1,975 | $1.38 | 43d | 1 | 1.05mi |
| 6000 Winners Cir Dover, DE | 2.0 | 2.0 | 1269 | $1,920 | $1.51 | 43d | 10 | 1.06mi |
| 522 Carol St Dover, DE | 3.0 | 1.5 | 1722 | $1,950 | $1.13 | 43d | 1 | 1.09mi |
| 100 Isabelle Isle Dover, DE | 2.0–3.0 | 2.0 | 1273 | $2,299 | $1.81 | 43d | 9 | 1.24mi |
| 355A Ridgely St Dover, DE | 1.0–3.0 | 1.0–2.5 | 1238 | $2,695 | $2.18 | 43d | 17 | 1.24mi |
| 46 Lincoln St Dover, DE | 2.0 | 2.0 | 1073 | $1,700 | $1.58 | 43d | 1 | 1.34mi |
Listing history 35 events
-
2026-06-13status $279,900 Pending 12 DOM
-
2026-06-02days on market $279,900 Active 12 DOM
-
2026-06-01days on market $279,900 Active 11 DOM
-
2026-05-31days on market $279,900 Active 10 DOM
-
2026-05-30days on market $279,900 Active 9 DOM
-
2026-05-13historical $279,900 681-char remark
-
2026-04-09soldstatus $126,000
-
2015-06-05soldstatus $141,000
-
2015-05-27soldstatus $144,000 551-char remark
Show marketing remark (551 chars)
Welcome to 822 White Oak Road. This cozy 3 bedroom cape is located in Edgehill which is conveniently located to the hub of Dover. Depending on the amount of space you need, This home could be used as a 3 bedroom with a family room or a 4th bedroom. One of the bedrooms are located upstairs for privacy and offers an additional area for sitting or Storage. There are 3 off street parking located at the rear of the property. Enjoy the great outdoors with patio areas off the kitchen and family room. Call today to schedule your tour of this great home!
-
2015-05-27soldstatus $144,000 Sold
Show marketing remark (551 chars)
Welcome to 822 White Oak Road. This cozy 3 bedroom cape is located in Edgehill which is conveniently located to the hub of Dover. Depending on the amount of space you need, This home could be used as a 3 bedroom with a family room or a 4th bedroom. One of the bedrooms are located upstairs for privacy and offers an additional area for sitting or Storage. There are 3 off street parking located at the rear of the property. Enjoy the great outdoors with patio areas off the kitchen and family room. Call today to schedule your tour of this great home!
-
2015-04-20status Under Contract
Show marketing remark (553 chars)
Welcome to 822 White Oak Road. This cozy 3 bedroom cape is located in Edgehill which is conveniently located to the hub of Dover. Depending on the amount of space you need, This home could be used as a 3 bedroom with a family room or a 4th bedroom. One of the bedrooms are located upstairs for privacy and offers an additional area for sitting or Storage. There are 3 off street parking located at the rear of the property. Enjoy the great outdoors with patio areas off the kitchen and family room. Call today to schedule your tour of this great home!
-
2015-04-17historical 551-char remark
Show marketing remark (551 chars)
Welcome to 822 White Oak Road. This cozy 3 bedroom cape is located in Edgehill which is conveniently located to the hub of Dover. Depending on the amount of space you need, This home could be used as a 3 bedroom with a family room or a 4th bedroom. One of the bedrooms are located upstairs for privacy and offers an additional area for sitting or Storage. There are 3 off street parking located at the rear of the property. Enjoy the great outdoors with patio areas off the kitchen and family room. Call today to schedule your tour of this great home!
-
2015-04-04$145,000 Active
Show marketing remark (551 chars)
Welcome to 822 White Oak Road. This cozy 3 bedroom cape is located in Edgehill which is conveniently located to the hub of Dover. Depending on the amount of space you need, This home could be used as a 3 bedroom with a family room or a 4th bedroom. One of the bedrooms are located upstairs for privacy and offers an additional area for sitting or Storage. There are 3 off street parking located at the rear of the property. Enjoy the great outdoors with patio areas off the kitchen and family room. Call today to schedule your tour of this great home!
-
2015-04-04$145,000 551-char remark
Show marketing remark (551 chars)
Welcome to 822 White Oak Road. This cozy 3 bedroom cape is located in Edgehill which is conveniently located to the hub of Dover. Depending on the amount of space you need, This home could be used as a 3 bedroom with a family room or a 4th bedroom. One of the bedrooms are located upstairs for privacy and offers an additional area for sitting or Storage. There are 3 off street parking located at the rear of the property. Enjoy the great outdoors with patio areas off the kitchen and family room. Call today to schedule your tour of this great home!
-
2011-12-01soldstatus $107,000
-
2011-12-01soldstatus $107,000
-
2011-10-05historical
-
2011-04-20$109,900
-
2011-04-20$109,900
-
2011-04-20historical
-
2011-03-16$134,900
-
2011-03-15historical
-
2010-12-15$144,900
-
2008-09-23historical
-
2008-04-08$199,000
-
2007-03-16soldstatus $189,467
-
2007-02-09soldstatus $189,500
-
2006-12-18historical
-
2006-12-05$189,500
-
2004-07-24historical
-
2004-07-12$155,000
-
2003-03-31soldstatus $72,000
-
2003-03-20soldstatus $72,000
-
2003-02-26$72,000
-
2003-02-26historical
ⓘ Source: listings_history table (triggers on properties + properties_extension) + one-shot
backfill from property_details.listing_events for pre-trigger history.
Tax reassessment forecast DE · Partial reset (capped growth)
- Current annual tax
- $1,353 · $113/mo
- Projected year-2 tax
- $1,488 · $124/mo
- Expected delta
- +$135/yr (+$11/mo · 10.0%)
ⓘ Screening estimate from a state-policy table — verify with the county assessor before closing.
Climate risk First Street
- Flood 1/10 Low FEMA zone X (unshaded) · 0% chance over 30 yrs
- Wildfire 1/10 Low
- Heat 8/10 Severe 7 d/yr ≥101°F today · 16 d/yr by 30 yrs out
- Wind 8/10 Severe 80% chance of damaging wind over 30 yrs
- Air quality 2/10 Low 1 unhealthy d/yr today · 2 by 30 yrs out
Nearby sold comps map
Loading sold comps map…
Walkable amenities ~0.75 mi
Loading nearby amenities…
Taxation est. · year 1
- Rental income
- $24,895
- − Mortgage interest
- −$15,679
- − Property taxes
- −$1,353
- − Insurance
- −$1,400
- − Repairs & maintenance
- −$1,992
- − Management
- −$1,992
- − Depreciation
- −$8,143
- Taxable loss
- −$5,662
- Est. tax savings @ 24.0%
- +$1,359
- After-tax cash flow
- $659/yr
For passive investors: Depreciation is non-cash, so a rental often shows a tax loss while cash-flowing — sheltering income. Rental losses are passive: they offset passive income freely, and up to $25,000/yr can offset ordinary (W-2) income if you actively participate and your MAGI is under $100k (phasing out to $0 by $150k); unused losses carry forward. On sale, claimed depreciation is recaptured at up to 25%, and gains may owe capital-gains tax (a 1031 exchange can defer both). Figures are a year-1 estimate at your 24.0% rate — not tax advice; consult a CPA.
Schools (NCES district)
- District
- Capital School District
- NCES district ID
- 1000190
- Math proficiency
- 14% ▼ -17.00%
- Reading proficiency
- 31% ▼ -12.00%
- Median HH income
- $48,499
- Composite
- 19.78/100
- National rank
- #8703
- State rank
- #24 of 26 in DE
Livability — Dover
- Score
- 67/100
- State rank
- #38
- US rank
- #10574
Category grades
Schools grade is shown separately in the Schools card above.
Census & demographics
- Census place
- Dover, DE
- County
- Kent County · 82,184 people
- City population
- 76,581
- Metro
- Dover, DE
- Population (ZIP)
- 37,763
- Household income
- $66,388
- Rent vs Own
- Severe rent burden
- 1320.0
Population outlook (Kent County) Hauer SSP2
- Today (2025)
- 194,477 people
- By 2030
- 204,351 · +5.1%
- By 2040
- 222,135 · +14.2%
- By 2050
- 236,483 · +21.6%
- By 2075
- 266,327 · +36.9%
- By 2100
- 275,335 · +41.6%
Race, ethnicity, and origin ACS 2023
- Neighborhood character
- Diverse neighborhood (Simpson 0.68)
- Race & ethnicity
- White 44% Black 34% Hispanic / Latino 13% Two or more races 11% Asian 2%
- Hispanic origin (detail)
- Mexican 3% Puerto Rican 6%
- Common ancestry
- Romanian 2% Hispanic 1% Lithuanian 1%
- Foreign-born
- 7% · Canada, South Korea
- Languages at home
- 88% English-only · Spanish 7% French/Haitian/Cajun 1% Other Asian/Pacific 1%
Political lean MEDSL · Kent
- 2024 margin
- Toss-up / Even · D 50.2% · R 48.2% · Other 1.7%
- 2008→2024 swing
- -7.8pp toward R · 2008: 9.8pp · 2024: 2.0pp
- All cycles
- 2024: D+2.0 2020: D+4.1 2016: R+4.9 2012: D+4.9 2008: D+9.8
Not yet ingested
- Civics
- —
Market trends
- HPI YoY
- ▼ -113.29%
- Current HPI
- 199.5132
- Rent YoY
- ▲ 2.03%
- Metro
- Dover, DE
- State GDP YoY
- —
- F500 in state
- 0
Price history
+288.8% since first listed33 events — show timeline
- 2026-06-10 Pending — BRIGHT MLS
- 2026-06-02 Listing Removed — BRIGHT MLS
- 2026-05-22 Listed $279,900 BRIGHT MLS
- 2026-05-13 Coming Soon $279,900 BRIGHT MLS
- 2026-04-09 Sold (Public Records) $126,000 Public Records
- 2015-06-05 Sold (Public Records) $141,000 Public Records
- 2015-05-27 Sold (MLS) $144,000 BRIGHT MLS
- 2015-05-27 Sold (MLS) $144,000 TREND
- 2015-04-20 Pending — TREND
- 2015-04-17 Listing Removed — BRIGHT MLS
- 2015-04-04 Listed $145,000 TREND
- 2015-04-04 Listed $145,000 BRIGHT MLS
- 2011-12-01 Sold (MLS) $107,000 TREND
- 2011-12-01 Sold (MLS) $107,000 BRIGHT MLS
- 2011-10-05 Listing Removed — BRIGHT MLS
- 2011-04-20 Listing Removed — BRIGHT MLS
- 2011-04-20 Listed $109,900 TREND
- 2011-04-20 Listed $109,900 BRIGHT MLS
- 2011-03-16 Listed $134,900 BRIGHT MLS
- 2011-03-15 Listing Removed — BRIGHT MLS
- 2010-12-15 Listed $144,900 BRIGHT MLS
- 2008-09-23 Listing Removed — BRIGHT MLS
- 2008-04-08 Listed $199,000 BRIGHT MLS
- 2007-03-16 Sold (Public Records) $189,467 Public Records
- 2007-02-09 Sold (MLS) $189,500 BRIGHT MLS
- 2006-12-18 Listing Removed — BRIGHT MLS
- 2006-12-05 Listed $189,500 BRIGHT MLS
- 2004-07-24 Listing Removed — BRIGHT MLS
- 2004-07-12 Listed $155,000 BRIGHT MLS
- 2003-03-31 Sold (Public Records) $72,000 Public Records
- 2003-03-20 Sold (MLS) $72,000 BRIGHT MLS
- 2003-02-26 Listed $72,000 BRIGHT MLS
- 2003-02-26 Listing Removed — BRIGHT MLS
Property tax history
+4.7%/yrLatest (2025): $1,353 · +3.5% YoY. Source: county tax records.
Cash-flow waterfall
monthlySold comps — $/sqft
last 12 mo · ≤1 miLoading sold comps…