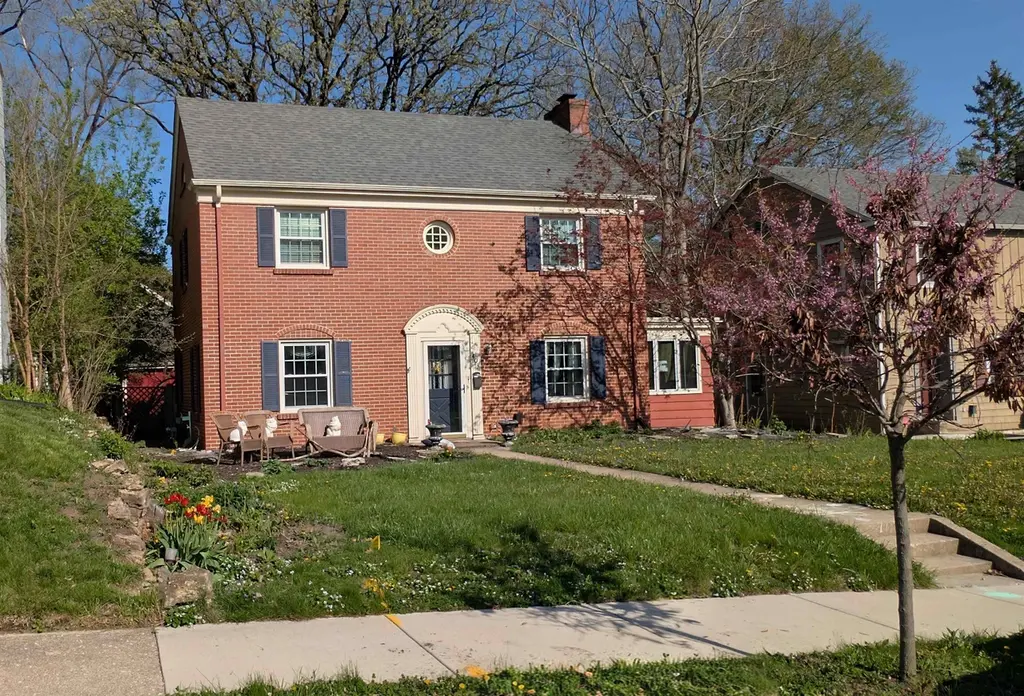
403 N Highland Ave · Rockford, IL
Flood risk 1/10 · Minimal
- FEMA flood zone
- X (unshaded)
- Chance of flooding over 30 yrs
- 0.0%
- Est. flood insurance / yr
- $473 – $860
Fire risk 1/10 · Minimal
- Est. fire insurance / yr
- $804 – $1,492
Heat risk 2/10 · Minimal
- Hot days now (above 101°F)
- 7 days/yr
- Hot days in 30 yrs
- 15 days/yr
Wind risk 2/10 · Minimal
- Chance of severe wind over 30 yrs
- —
Air-quality risk 2/10 · Minimal
- Unhealthy air days now
- 1 days/yr
- Unhealthy air days in 30 yrs
- 2 days/yr
Risk factors via First Street. Map © Google.
Why this score? — see what drove the D+ grade
The composite is a weighted blend of 9 inputs, each scored 0–100. Each bar is that input's sub-score; the figure is the points it added to the 100-point composite (weight × sub-score).
- ARV discount +15.0/15.0
- Cash flow +13.3/30.0
- 1% rule +5.5/10.0
- DSCR +4.0/10.0
- Rent growth +4.0/5.0
- Livability +3.1/5.0
- Condition / age +2.5/5.0
- Schools +1.2/10.0
- Appreciation +0.0/10.0
$169,900
🖨 Deal sheet 📄 Offer letter ✓ Due diligence
Listing remarks MLS
Beautifully maintained all brick colonial in popular Highland Park area! 3 bedrooms, 1.5 bathrooms, 2 car garage. Inviting entryway opens to a spacious living room with fireplace. Private den or playroom offers additional living space off of the living room. Separate dining room off the kitchen. Kitchen overlooks a private oasis of a fenced backyard with water fountain, zen garden area, and potting shed. The upstairs offers 3 bedrooms and a large bath with his and her sinks. Finished rec room or "man cave" in basement. Character abounds in this beauty with arched doorways, hardwood flooring, and crown moldings. Freshly painted and new carpeting. Roof, furnace, windows, HWH, and appliances all new in 2015. Located in walking distance to parks, schools, restaurants and entertainment!
Key facts
- Solid home
- Nice backyard
- Functional layout
Tags
Property features AI
Exterior
- Parking: Detached garage (1.5 spaces)
- Utilities: Public water; Public sewer
- Home design: Single-family house; 2 stories
- Construction: Brick construction; Basement (finished, full)
- Exterior features: Shingle roof
Interior
- Kitchen: Gas cooktop; Refrigerator
- Bathrooms: 1 full bathroom; 1 half bathroom
- Heating & cooling: Forced air heating; Central air conditioning
- Interior features: Gas fireplace; Finished full basement
- Laundry & utility: Gas water heater
Neighborhood map
What this means for you Summary
Snapshot
- This is a 3-bed/1.5-bath single-family listed at $170k.
Deal economics
- At list price, monthly cash flow is $1 ($6/yr) — positive.
- The deal already cash-flows at list — no discount required.
- Meets the 1% rule at list price ($2k rent vs $170k).
Location & tenants
- Location reads 62/100 on livability (#876 in IL) — a middle-class / working-renter tenant base. Strengths: cost of living A+, housing A+, health & safety A+; Watch: schools F, crime F, amenities F.
- Rockford SD 205 (urban): math 12% / reading 16% proficiency, ranked #533 of 620 in IL (top 86%) — low school quality limits family demand, transient renter base, plan for 1-2y turnover; 73% free/reduced lunch — lower-income household profile, screen leases tightly.
- Market conditions: Rents rising fast (+5.9%/yr); 151 active listings in the ZIP; 3 comparable units currently listed for rent nearby; rentals at typical pace (median 21d on market — plan ~3-4 weeks tenant-placement turnaround); solid renter incomes; 285 units permitted in Winnebago County in 2024 (0 in 5+ unit buildings).
Forward outlook
- Local home prices are declining (-3.0%/yr); year-one equity from $1k of loan paydown is wiped out by about $5k of value loss. Plan a longer hold.
- Winnebago County population projected at -20% by 2050 — secular population decline; favor cash flow + early exit over multi-decade hold.
Negotiation context
- Only 8 days on market — expect competitive offers; lowballing is unlikely to land.
- 4 sale attempts since 6y ago with the ask held roughly flat each time — persistent listings suggest the price (not the market) is what's stuck; bring a comps-based counter.
- Current owner paid $138k; 24% above their basis — modest negotiation headroom, anchor on the comps not their cost.
Risks & watch-outs
- Watch-outs: property tax is 3.2% of price; built in 1937 — expect roof / HVAC / electrical / plumbing capex.
Questions for the listing agent
- Built in 1937 — when were the roof, HVAC, electrical panel, plumbing, and water heater last replaced?
- Property tax is high relative to price — has the assessment been appealed recently, and will the sale trigger a re-assessment?
- Is there a deadline driving the sale (1031 exchange, divorce, estate, relocation)? That informs how much negotiation room exists.
- Schools are F-rated, which usually means shorter tenancies and higher turnover. Who's the typical renter profile here, and what's been the actual vacancy rate?
- Crime grade is F in this area — have there been break-ins, vandalism, or insurance claims at this property in the last 3 years? What carrier currently insures it and at what premium?
- The area grade is low — what's the realistic commute time and amenity access for the typical tenant pool here? Any planned neighborhood developments (good or bad) we should know about?
- What's the average days-on-market for RENTAL listings here right now (not sales)? A rising rental-DOM trend means longer vacancies and softer asking-rent achievability than the comps imply.
- What's the recent tenant-quality profile in this submarket — average credit score on applications, eviction rate, late-payment / NSF rate, and stable-employment percentage? A property-management company in the area should have these aggregated.
- How much new for-sale + rental construction is in the pipeline within 1–3 miles? Heavy new supply typically softens prices + rents 12–24 months out; constrained supply supports both.
Investment metrics
- 1% rule
- 1.05% ✓
- Cap rate
- 6.30%
- Cash-on-cash
- 0.01%
- DSCR
- 1.00
- GRM
- 7.9
CMA / ARV
- ARV (on-the-fly)
- $218,442
- Comps found
- 12
Show comp detail 12 sales within ~0.75 mi
| Address | Dist | Beds/Ba | Sqft | Sold | Price | $/sf | Match |
|---|---|---|---|---|---|---|---|
| 422 N Gardiner Ave | 0.10mi | 3/2.5 | 2,082 (-7%) | 4mo | $274,000 | $132 | 76 |
| 117 N Highland Ave | 0.19mi | 3/1.5 | 2,453 (+10%) | 0mo | $265,000 | $108 | 74 |
| 627 Paris Ave | 0.31mi | 4/1.5 (+1) | 2,176 (-2%) | 4mo | $173,000 | $80 | 74 |
| 1611 Jackson St | 0.24mi | 3/2.5 | 2,029 (-9%) | 1mo | $195,000 | $96 | 70 |
| 2322 E State St | 0.46mi | 3/1.5 | 2,373 (+6%) | 2mo | $212,000 | $89 | 66 |
| 743 Bohm Ct | 0.43mi | 4/2.0 (+1) | 2,282 (+2%) | 4mo | $195,000 | $85 | 65 |
| 215 Robert Ave | 0.56mi | 3/1.0 | 2,198 (-1%) | 6mo | $215,000 | $98 | 64 |
| 2127 Jackson St | 0.26mi | 3/1.5 | 2,500 (+12%) | 5mo | $250,000 | $100 | 63 |
| 302 N Rockford Ave | 0.34mi | 4/2.0 (+1) | 1,970 (-12%) | 1mo | $257,000 | $130 | 57 |
| 611 Robert Ave | 0.58mi | 3/2.0 | 2,058 (-8%) | 6mo | $195,000 | $95 | 53 |
| 2133 Guilford Rd | 0.58mi | 4/2.0 (+1) | 2,445 (+10%) | 7mo | $265,000 | $108 | 44 |
| 634 13th St | 0.69mi | 3/2.0 | 1,920 (-14%) | 5mo | $100,000 | $52 | 38 |
Match score weights: distance 35% · size 25% · config 20% · recency 20%. Top-matched comps best support the ARV.
Projected returns pro-forma
-3.0% appreciation · 5.92% rent growth · sell at horizon
- IRR
- -12.3%
- Equity multiple
- 0.54×
- Total profit
- $-21,918
- Equity at exit
- $25,333
- IRR
- 1.3%
- Equity multiple
- 1.11×
- Total profit
- $5,221
- Equity at exit
- $14,690
Cash invested: $47,572 (down + closing). Projections, not guarantees.
Landlord ↔ Tenant lean methodology
- Overall (STATE)
- 43 Moderately Tenant-Leaning
- State Illinois
- 43 Moderately Tenant-Leaning · D+7
- County
- — inherits STATE
- City
- — inherits STATE
ZIP-level market 61107
- Home prices YoY
- -20.1%
- Rents YoY
- 5.9%
- Active inventory
- 151
- Price-to-rent
- 7.9×
Monthly cashflow live
- Estimated rent
- $1,788 medium interval (Pro) →
- Mortgage (P&I)
- −$891
- Tax from tax record
- −$450 /mo · $5,405/yr
- Insurance
- −$71
- HOA
- −$0
- Vacancy / Maint / Mgmt
- −$376
- Net cashflow
- $1
Break-even live
UW: 25.0% down · 7.5% · 30yr · 1.5% tax · 5.0% vac · 8.0% maint · 8.0% mgmt
Financing live
Cash to close
- Down payment
- $42,475
- Closing costs
- $5,097
- Reserves months
- —
- Total cash needed
- —
Loan-product check · same deal, 3 products live
Conventional
25% down · 7.5% · 30yr
- Down + closing
- —
- Monthly P&I
- —
- Monthly cashflow
- —
- DSCR
- —
- Eligible?
- —
Personal DTI + credit; lowest rate.
DSCR
20% down · 8.5% · 30yr
- Down + closing
- —
- Monthly P&I
- —
- Monthly cashflow
- —
- DSCR
- —
- Eligible?
- —
No personal income docs; deal must DSCR.
Hard money
10% down · 12.0% · 12mo
- Down + closing
- —
- Monthly P&I
- —
- Monthly cashflow
- —
- DSCR
- —
- Eligible?
- —
Short-term bridge; refi at stabilization.
Rent comps 3 comps
| Address | Beds | Baths | Sqft | Rent | $/sqft | DOM | Units | Dist |
|---|---|---|---|---|---|---|---|---|
| 1202 18th St Unit 3 Rockford, IL | 3.0 | 1.0 | 1500 | $1,700 | $1.13 | 13d | 1 | 1.03mi |
| 913 N Main St Rockford, IL | 2.0 | 1.0–2.0 | 1050 | $2,300 | $2.19 | 20d | 1 | 1.25mi |
| 708 29th St Rockford, IL | 3.0 | 2.0 | 1800 | $1,600 | $0.89 | 20d | 1 | 1.25mi |
Listing history 16 events
-
2026-06-07status $169,900 Pending 8 DOM
-
2026-06-03days on market $169,900 Active 8 DOM
-
2026-06-02days on market $169,900 Active 7 DOM
-
2026-06-01status $169,900 Active 6 DOM
-
2026-05-22status Pending
-
2026-05-18status Active
-
2026-05-13status Pending
-
2026-05-11$169,900 Active
-
2020-07-24soldstatus $137,500
-
2020-07-23soldstatus $137,500 Closed Sale 802-char remark
Show marketing remark (802 chars)
Beautifully maintained all brick colonial in popular Highland Park area! 3 bedrooms, 1.5 bathrooms, 2 car garage. Inviting entryway opens to a spacious living room with fireplace. Private den or playroom offers additional living space off of the living room. Separate dining room off the kitchen. Kitchen overlooks a private oasis of a fenced backyard with water fountain, zen garden area, and potting shed. The upstairs offers 3 bedrooms and a large bath with his and her sinks. Finished rec room or "man cave" in basement. Character abounds in this beauty with arched doorways, hardwood flooring, and crown moldings. Freshly painted and new carpeting. Roof, furnace, windows, HWH, and appliances all new in 2015. Located in walking distance to parks, schools, restaurants and entertainment!
-
2020-07-23soldstatus $137,500
Show marketing remark (802 chars)
Beautifully maintained all brick colonial in popular Highland Park area! 3 bedrooms, 1.5 bathrooms, 2 car garage. Inviting entryway opens to a spacious living room with fireplace. Private den or playroom offers additional living space off of the living room. Separate dining room off the kitchen. Kitchen overlooks a private oasis of a fenced backyard with water fountain, zen garden area, and potting shed. The upstairs offers 3 bedrooms and a large bath with his and her sinks. Finished rec room or "man cave" in basement. Character abounds in this beauty with arched doorways, hardwood flooring, and crown moldings. Freshly painted and new carpeting. Roof, furnace, windows, HWH, and appliances all new in 2015. Located in walking distance to parks, schools, restaurants and entertainment!
-
2020-06-12status Pending 802-char remark
Show marketing remark (802 chars)
Beautifully maintained all brick colonial in popular Highland Park area! 3 bedrooms, 1.5 bathrooms, 2 car garage. Inviting entryway opens to a spacious living room with fireplace. Private den or playroom offers additional living space off of the living room. Separate dining room off the kitchen. Kitchen overlooks a private oasis of a fenced backyard with water fountain, zen garden area, and potting shed. The upstairs offers 3 bedrooms and a large bath with his and her sinks. Finished rec room or "man cave" in basement. Character abounds in this beauty with arched doorways, hardwood flooring, and crown moldings. Freshly painted and new carpeting. Roof, furnace, windows, HWH, and appliances all new in 2015. Located in walking distance to parks, schools, restaurants and entertainment!
-
2020-06-03$139,900
-
2020-06-01$139,900 New 802-char remark
Show marketing remark (802 chars)
Beautifully maintained all brick colonial in popular Highland Park area! 3 bedrooms, 1.5 bathrooms, 2 car garage. Inviting entryway opens to a spacious living room with fireplace. Private den or playroom offers additional living space off of the living room. Separate dining room off the kitchen. Kitchen overlooks a private oasis of a fenced backyard with water fountain, zen garden area, and potting shed. The upstairs offers 3 bedrooms and a large bath with his and her sinks. Finished rec room or "man cave" in basement. Character abounds in this beauty with arched doorways, hardwood flooring, and crown moldings. Freshly painted and new carpeting. Roof, furnace, windows, HWH, and appliances all new in 2015. Located in walking distance to parks, schools, restaurants and entertainment!
-
1997-12-04soldstatus $94,500
-
1997-12-04soldstatus $94,500
ⓘ Source: listings_history table (triggers on properties + properties_extension) + one-shot
backfill from property_details.listing_events for pre-trigger history.
Tax reassessment forecast IL · Partial reset (capped growth)
- Current annual tax
- $5,405 · $450/mo
- Projected year-2 tax
- $5,405 · $450/mo
- Expected delta
- $0/yr ($0/mo · 0.0%)
ⓘ Screening estimate from a state-policy table — verify with the county assessor before closing.
Climate risk First Street
- Flood 1/10 Low FEMA zone X (unshaded) · 0% chance over 30 yrs
- Wildfire 1/10 Low
- Heat 2/10 Low 7 d/yr ≥101°F today · 15 d/yr by 30 yrs out
- Wind 2/10 Low
- Air quality 2/10 Low 1 unhealthy d/yr today · 2 by 30 yrs out
Nearby sold comps map
Loading sold comps map…
Walkable amenities ~0.75 mi
Loading nearby amenities…
Taxation est. · year 1
- Rental income
- $21,459
- − Mortgage interest
- −$9,517
- − Property taxes
- −$5,405
- − Insurance
- −$850
- − Repairs & maintenance
- −$1,717
- − Management
- −$1,717
- − Depreciation
- −$4,943
- Taxable loss
- −$2,689
- Est. tax savings @ 24.0%
- +$645
- After-tax cash flow
- $651/yr
For passive investors: Depreciation is non-cash, so a rental often shows a tax loss while cash-flowing — sheltering income. Rental losses are passive: they offset passive income freely, and up to $25,000/yr can offset ordinary (W-2) income if you actively participate and your MAGI is under $100k (phasing out to $0 by $150k); unused losses carry forward. On sale, claimed depreciation is recaptured at up to 25%, and gains may owe capital-gains tax (a 1031 exchange can defer both). Figures are a year-1 estimate at your 24.0% rate — not tax advice; consult a CPA.
Schools (NCES district)
- District
- Rockford SD 205
- NCES district ID
- 1734510
- Math proficiency
- 12% ▼ -2.00%
- Reading proficiency
- 16% ▼ -3.00%
- Median HH income
- $42,533
- Composite
- 12.21/100
- National rank
- #9649
- State rank
- #533 of 620 in IL
Livability — Rockford
- Score
- 62/100
- State rank
- #876
- US rank
- #17035
Category grades
Schools grade is shown separately in the Schools card above.
Census & demographics
- Census place
- Rockford, IL
- County
- Winnebago County · 147,297 people
- City population
- 147,297
- Metro
- Rockford, IL
- Population (ZIP)
- 30,765
- Household income
- $78,574
- Rent vs Own
- Severe rent burden
- 981.0
Population outlook (Winnebago County) Hauer SSP2
- Today (2025)
- 271,080 people
- By 2030
- 260,684 · -3.8%
- By 2040
- 238,405 · -12.1%
- By 2050
- 216,129 · -20.3%
- By 2075
- 172,882 · -36.2%
- By 2100
- 135,336 · -50.1%
Race, ethnicity, and origin ACS 2023
- Neighborhood character
- Predominantly White (68%)
- Race & ethnicity
- White 68% Hispanic / Latino 15% Black 9% Two or more races 9% Asian 4% Native American 1%
- Hispanic origin (detail)
- Mexican 11% Puerto Rican 1%
- Common ancestry
- Romanian 6% Portuguese 4% Lithuanian 2%
- Foreign-born
- 10% · Canada, China
- Languages at home
- 83% English-only · Spanish 11% Arabic 1% Other Indo-European 1%
Political lean MEDSL · Winnebago
- 2024 margin
- Toss-up / Even · D 49.5% · R 49.0% · Other 1.5%
- 2008→2024 swing
- -12.2pp toward R · 2008: 12.8pp · 2024: 0.6pp
- All cycles
- 2024: D+0.6 2020: D+2.5 2016: R+1.2 2012: D+5.7 2008: D+12.8
Not yet ingested
- Civics
- —
Market trends
- HPI YoY
- ▼ -62.46%
- Current HPI
- 248.8598
- Rent YoY
- ▲ 5.92%
- Metro
- Rockford, IL
- State GDP YoY
- ▲ 1.59%
- F500 in state
- 60
Industry mix (Fortune 500 HQ in IL)
| Industry | F500 HQs | Revenue |
|---|---|---|
| Insurance | 4 | $201B |
|
||
| Consumer Goods | 4 | $87B |
|
||
| Industrial Machinery | 3 | $64B |
|
||
| Healthcare | 2 | $55B |
|
||
| Retail / Pharmacy | 1 | $148B |
|
||
| Agriculture / Food | 1 | $86B |
|
||
Price history
+79.8% since first listed12 events — show timeline
- 2026-05-22 Pending — NWIAR
- 2026-05-18 Relisted — NWIAR
- 2026-05-13 Pending — NWIAR
- 2026-05-11 Listed $169,900 NWIAR
- 2020-07-24 Sold (Public Records) $137,500 Public Records
- 2020-07-23 Sold (MLS) $137,500 MRED as Distributed by MLS Grid
- 2020-07-23 Sold (MLS) $137,500 NWIAR
- 2020-06-12 Pending — MRED as Distributed by MLS Grid
- 2020-06-03 Listed $139,900 NWIAR
- 2020-06-01 Listed $139,900 MRED as Distributed by MLS Grid
- 1997-12-04 Sold (Public Records) $94,500 Public Records
- 1997-12-04 Sold (Public Records) $94,500 Public Records
Property tax history
+1.5%/yrLatest (2024): $5,405 · +5.0% YoY. Source: county tax records.
Cash-flow waterfall
monthlySold comps — $/sqft
last 12 mo · ≤1 miLoading sold comps…