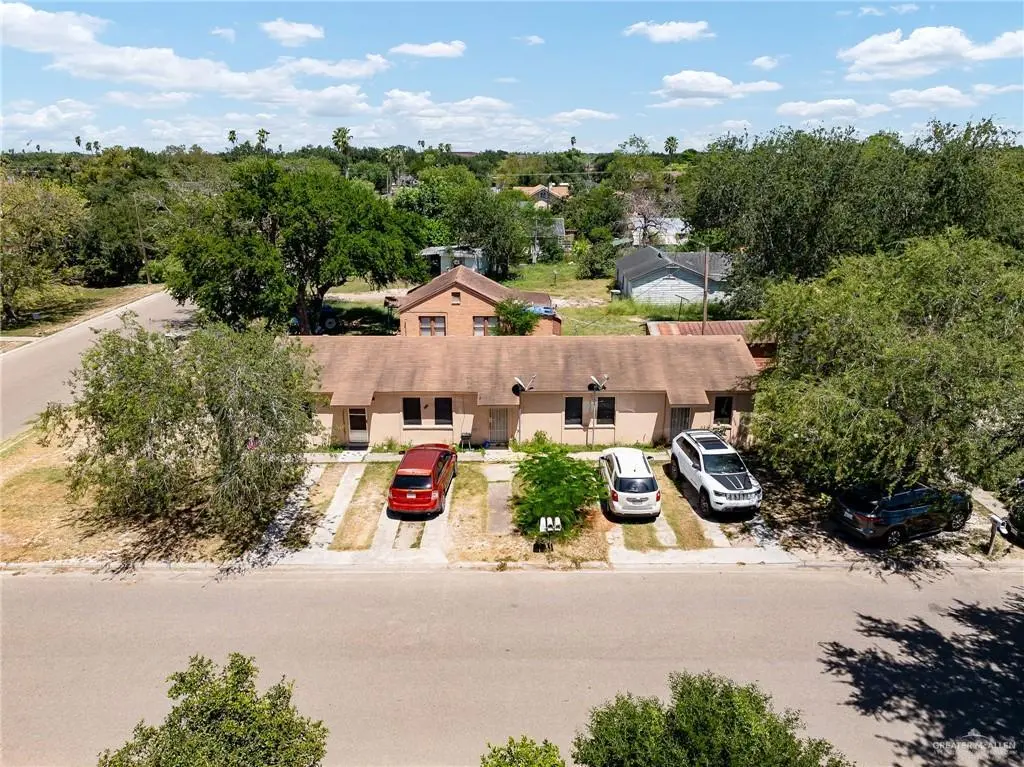
 Triplex
905 S Lincoln Ave · San Juan, TX
Flood risk 1/10 · Minimal
- FEMA flood zone
- —
- Chance of flooding over 30 yrs
- 0.0%
- Est. flood insurance / yr
- —
Fire risk 8/10 · Major
- Est. fire insurance / yr
- $1,222 – $2,270
Heat risk 9/10 · Severe
- Hot days now (above 112°F)
- 7 days/yr
- Hot days in 30 yrs
- 21 days/yr
Wind risk 8/10 · Major
- Chance of severe wind over 30 yrs
- 99.0%
Air-quality risk 3/10 · Minor
- Unhealthy air days now
- 1 days/yr
- Unhealthy air days in 30 yrs
- 4 days/yr
Risk factors via First Street. Map © Google.
Why this score? — see what drove the C grade
The composite is a weighted blend of 9 inputs, each scored 0–100. Each bar is that input's sub-score; the figure is the points it added to the 100-point composite (weight × sub-score).
- Cash flow +24.0/30.0
- 1% rule +7.8/10.0
- DSCR +7.7/10.0
- ARV discount +6.6/15.0
- Livability +3.6/5.0
- Rent growth +2.5/5.0
- Condition / age +2.5/5.0
- Schools +2.0/10.0
- Appreciation +0.0/10.0
$199,000
🖨 Deal sheet 📄 Offer letter ✓ Due diligence
Multi-family units
County records classify this as Multi-Family (2-4 Unit). Listing-text estimate: 3 units. confirmed
Listing remarks MLS
Great investment opportunity in the heart of San Juan, Texas! This income-generating triplex + a bonus house and offers stability and potential, featuring long-term tenants already in place for immediate cash flow. Each unit is well-maintained, making it an ideal choice for seasoned investors or those looking to start their real estate portfolio. Conveniently located near shopping, dining, schools, and easy access to major highways, this property is perfectly positioned to attract and retain tenants. With consistent rental income and a prime location, this is an opportunity you won’t want to miss!
Key facts
- Well maintained
- Prime location
- Conveniently located
Tags
Neighborhood map
What this means for you Summary
Snapshot
- This is a 3 × 2-bed/1-bath units multifamily listed at $199k.
Deal economics
- At list price, monthly cash flow is $389 ($5k/yr) — positive. Per door: $130/mo.
- The deal already cash-flows at list — no discount required.
- Meets the 1% rule at list price ($3k rent vs $199k).
- Recommended offer: $175k (12.0% below list) — sets the bar for market timing.
- Cap rate 8.6% vs local median 3.4% in San Juan — top-decile yield for the area; either an underpriced asset or a hidden risk that comps aren't pricing in. Stress-test before assuming the spread holds.
Location & tenants
- Location reads 71/100 on livability (#294 in TX) — a middle-class / working-renter tenant base. Strengths: cost of living A+, housing A+, health & safety A+; Watch: schools D, amenities F, commute F.
- Pharr-San Juan-Alamo ISD (suburban): math 18% / reading 30% proficiency, ranked #740 of 826 in TX (top 90%) — low school quality limits family demand, transient renter base, plan for 1-2y turnover; 72% free/reduced lunch — lower-income household profile, screen leases tightly.
- Market conditions: 362 active listings in the ZIP; 14 comparable units currently listed for rent nearby; rentals lingering (median 44d on market — plan ~5-8 weeks vacancy on turnover, expect pricing pressure); 71% of comp listings sitting > 30 days — soft ceiling on asking rent; 7,378 units permitted in Hidalgo County in 2024 (641 in 5+ unit buildings).
Forward outlook
- Local home prices are declining (-3.0%/yr); year-one equity from $1k of loan paydown is wiped out by about $6k of value loss. Plan a longer hold.
- Hidalgo County population projected at +28% by 2050 — long-run rental-demand tailwind backs the buy-and-hold thesis.
Negotiation context
- It's been on market 179 days — a 12% lower offer ($175k) is reasonable based on typical stale-listing flexibility.
- 2 sale attempts; this cycle's ask has dropped $50k (20%) from the opening price — seller is motivated, your offer sets the floor, not the list.
Risks & watch-outs
- Watch-outs: property tax is 3.0% of price.
- Climate carrying-cost: severe wind risk, 99% chance of damaging wind over 30y; severe wildfire risk; extreme-heat days projected 7→21/yr by 2055 (HVAC capex compounding) — expect insurance premiums to compound above CPI over the hold.
Questions for the listing agent
- It's been on market 179 days. Have you received any prior offers? Is the seller open to a 12% concession, seller financing, or rate buy-down credit?
- Can we see the unit-by-unit rent roll, current vacancy, and any below-market leases? What's the average tenancy length?
- What capital expenditures (roof, boiler, parking lot, exteriors) have been made in the last 5 years, and what's planned in the next 2?
- Property tax is high relative to price — has the assessment been appealed recently, and will the sale trigger a re-assessment?
- Why hasn't it sold? Are there any deal-killer items the seller is aware of (foundation, flood, title, zoning, code violations)?
- Is there a deadline driving the sale (1031 exchange, divorce, estate, relocation)? That informs how much negotiation room exists.
- Schools are D-rated, which usually means shorter tenancies and higher turnover. Who's the typical renter profile here, and what's been the actual vacancy rate?
- What's the average days-on-market for RENTAL listings here right now (not sales)? A rising rental-DOM trend means longer vacancies and softer asking-rent achievability than the comps imply.
- What's the recent tenant-quality profile in this submarket — average credit score on applications, eviction rate, late-payment / NSF rate, and stable-employment percentage? A property-management company in the area should have these aggregated.
- How much new apartment / multifamily construction is in the pipeline within 1–3 miles? Heavy new supply (>2% of stock underway) typically softens rents 12–24 months out; light construction supports rent growth.
Investment metrics
- 1% rule
- 1.28% ✓
- Cap rate
- 8.64%
- Cash-on-cash
- 8.38%
- DSCR
- 1.37
- GRM
- 6.5
CMA / ARV
- ARV (median comp)
- $195,027
- List price
- $199,000
- Delta
- 2.04%
- Verdict
- FAIR
- Comps
- 2 within 1.0 mi
Projected returns pro-forma
-3.0% appreciation · 3.0% rent growth · sell at horizon
- IRR
- -3.5%
- Equity multiple
- 0.87×
- Total profit
- $-7,279
- Equity at exit
- $29,672
- IRR
- 6.3%
- Equity multiple
- 1.47×
- Total profit
- $26,330
- Equity at exit
- $17,206
Cash invested: $55,720 (down + closing). Projections, not guarantees.
Landlord ↔ Tenant lean methodology
- Overall (STATE)
- 87 Strongly Landlord-Friendly
- State Texas
- 87 Strongly Landlord-Friendly · R+5
- County
- — inherits STATE
- City
- — inherits STATE
ZIP-level market 78589
- Home prices YoY
- -12.1%
- Active inventory
- 362
- Price-to-rent
- 19.6×
Monthly cashflow live
- Estimated rent
- $2,540 high interval (Pro) →
- Mortgage (P&I)
- −$1,044
- Tax from tax record
- −$491 /mo · $5,892/yr
- Insurance
- −$83
- HOA
- −$0
- Vacancy / Maint / Mgmt
- −$533
- Net cashflow
- $389
Break-even live
3-unit breakdown (identical units grouped — click to expand)
| Units | Beds | Baths | Est. rent |
|---|---|---|---|
| 3× units | 2 | 1 | $2,541 |
| #1 | 2 | 1 | $847 |
| #2 | 2 | 1 | $847 |
| #3 | 2 | 1 | $847 |
| Total (3 units) | $2,540 | ||
UW: 25.0% down · 7.5% · 30yr · 1.5% tax · 5.0% vac · 8.0% maint · 8.0% mgmt
Financing live
Cash to close
- Down payment
- $49,750
- Closing costs
- $5,970
- Reserves months
- —
- Total cash needed
- —
Loan-product check · same deal, 3 products live
Conventional
25% down · 7.5% · 30yr
- Down + closing
- —
- Monthly P&I
- —
- Monthly cashflow
- —
- DSCR
- —
- Eligible?
- —
Personal DTI + credit; lowest rate.
DSCR
20% down · 8.5% · 30yr
- Down + closing
- —
- Monthly P&I
- —
- Monthly cashflow
- —
- DSCR
- —
- Eligible?
- —
No personal income docs; deal must DSCR.
Hard money
10% down · 12.0% · 12mo
- Down + closing
- —
- Monthly P&I
- —
- Monthly cashflow
- —
- DSCR
- —
- Eligible?
- —
Short-term bridge; refi at stabilization.
Rent comps 14 comps
| Address | Beds | Baths | Sqft | Rent | $/sqft | DOM | Units | Dist |
|---|---|---|---|---|---|---|---|---|
| 311 W 8th St San Juan, TX | 3.0 | 2.0 | 1839 | $1,390 | $0.76 | 43d | 1 | 0.13mi |
| 1306 Adela Dr San Juan, TX | 3.0 | 2.0 | 1278 | $1,500 | $1.17 | 14d | 1 | 0.82mi |
| 204 E Gomez Dr San Juan, TX | 3.0 | 1.5 | 1464 | $1,650 | $1.13 | 14d | 1 | 1.16mi |
| 405 Rafael Dr Apt 2 San Juan, TX | 3.0 | 2.0 | 1200 | $1,250 | $1.04 | 43d | 1 | 1.17mi |
| 808 E Evans Ave Pharr, TX | 3.0 | 2.0 | 1093 | $1,400 | $1.28 | 43d | 1 | 1.19mi |
| 221 Rafael Dr Unit 1 San Juan, TX | 2.0 | 2.0 | 1200 | $1,150 | $0.96 | 43d | 1 | 1.20mi |
| 1305 James Cir Pharr, TX | 3.0 | 2.0 | 1525 | $1,550 | $1.02 | 23d | 1 | 1.20mi |
| 217 Rafael Dr Unit 4 San Juan, TX | 2.0 | 2.0 | 1078 | $1,100 | $1.02 | 43d | 1 | 1.21mi |
| 2302 San Pascual St San Juan, TX | 3.0 | 2.0 | 1285 | $1,800 | $1.40 | 43d | 1 | 1.27mi |
| 518 E Kelly Ave Pharr, TX | 2.0 | 2.0 | 1482 | $1,300 | $0.88 | 43d | 1 | 1.29mi |
| 1606 Kumquat Ave Pharr, TX | 3.0 | 2.0 | 1476 | $1,398 | $0.95 | 43d | 1 | 1.30mi |
| 1606 S Kumquat St Pharr, TX | 3.0 | 2.0 | 1476 | $1,350 | $0.91 | 23d | 1 | 1.41mi |
| 1806 S Linden St Pharr, TX | 3.0 | 2.0 | 1100 | $995 | $0.90 | 43d | 1 | 1.42mi |
| 1504 E Quail St Pharr, TX | 3.0 | 2.0 | 1100 | $995 | $0.90 | 43d | 1 | 1.47mi |
Listing history 11 events
-
2026-06-07statusdays on market $199,000 Pending 179 DOM
-
2026-06-03days on market $199,000 Active 177 DOM
-
2026-06-02days on market $199,000 Active 176 DOM
-
2026-06-01days on market $199,000 Active 175 DOM
-
2026-05-31days on market $199,000 Active 174 DOM
-
2026-05-31days on market $199,000 Active 173 DOM
-
2026-04-13status Active 610-char remark
Show marketing remark (610 chars)
Great investment opportunity in the heart of San Juan, Texas! This income-generating triplex + a bonus house and offers stability and potential, featuring long-term tenants already in place for immediate cash flow. Each unit is well-maintained, making it an ideal choice for seasoned investors or those looking to start their real estate portfolio. Conveniently located near shopping, dining, schools, and easy access to major highways, this property is perfectly positioned to attract and retain tenants. With consistent rental income and a prime location, this is an opportunity you won’t want to miss!
-
2026-04-13price $199,000 610-char remark
Show marketing remark (610 chars)
Great investment opportunity in the heart of San Juan, Texas! This income-generating triplex + a bonus house and offers stability and potential, featuring long-term tenants already in place for immediate cash flow. Each unit is well-maintained, making it an ideal choice for seasoned investors or those looking to start their real estate portfolio. Conveniently located near shopping, dining, schools, and easy access to major highways, this property is perfectly positioned to attract and retain tenants. With consistent rental income and a prime location, this is an opportunity you won’t want to miss!
-
2025-12-16status Pending 610-char remark
Show marketing remark (610 chars)
Great investment opportunity in the heart of San Juan, Texas! This income-generating triplex + a bonus house and offers stability and potential, featuring long-term tenants already in place for immediate cash flow. Each unit is well-maintained, making it an ideal choice for seasoned investors or those looking to start their real estate portfolio. Conveniently located near shopping, dining, schools, and easy access to major highways, this property is perfectly positioned to attract and retain tenants. With consistent rental income and a prime location, this is an opportunity you won’t want to miss!
-
2025-12-12historical Option 610-char remark
Show marketing remark (610 chars)
Great investment opportunity in the heart of San Juan, Texas! This income-generating triplex + a bonus house and offers stability and potential, featuring long-term tenants already in place for immediate cash flow. Each unit is well-maintained, making it an ideal choice for seasoned investors or those looking to start their real estate portfolio. Conveniently located near shopping, dining, schools, and easy access to major highways, this property is perfectly positioned to attract and retain tenants. With consistent rental income and a prime location, this is an opportunity you won’t want to miss!
-
2025-08-07$249,000 Active 610-char remark
Show marketing remark (610 chars)
Great investment opportunity in the heart of San Juan, Texas! This income-generating triplex + a bonus house and offers stability and potential, featuring long-term tenants already in place for immediate cash flow. Each unit is well-maintained, making it an ideal choice for seasoned investors or those looking to start their real estate portfolio. Conveniently located near shopping, dining, schools, and easy access to major highways, this property is perfectly positioned to attract and retain tenants. With consistent rental income and a prime location, this is an opportunity you won’t want to miss!
ⓘ Source: listings_history table (triggers on properties + properties_extension) + one-shot
backfill from property_details.listing_events for pre-trigger history.
Tax reassessment forecast TX · Resets to sale price
- Current annual tax
- $5,892 · $491/mo
- Projected year-2 tax
- $5,892 · $491/mo
- Expected delta
- $0/yr ($0/mo · 0.0%)
ⓘ Screening estimate from a state-policy table — verify with the county assessor before closing.
Climate risk First Street
- Flood 1/10 Low 0% chance over 30 yrs
- Wildfire 8/10 Severe
- Heat 9/10 Extreme 7 d/yr ≥112°F today · 21 d/yr by 30 yrs out
- Wind 8/10 Severe 99% chance of damaging wind over 30 yrs
- Air quality 3/10 Moderate 1 unhealthy d/yr today · 4 by 30 yrs out
Nearby sold comps map
Loading sold comps map…
Walkable amenities ~0.75 mi
Loading nearby amenities…
Taxation est. · year 1
- Rental income
- $30,480
- − Mortgage interest
- −$11,147
- − Property taxes
- −$5,892
- − Insurance
- −$995
- − Repairs & maintenance
- −$2,438
- − Management
- −$2,438
- − Depreciation
- −$5,789
- Taxable income
- $1,780
- Est. tax owed @ 24.0%
- −$427
- After-tax cash flow
- $4,242/yr
For passive investors: Depreciation is non-cash, so a rental often shows a tax loss while cash-flowing — sheltering income. Rental losses are passive: they offset passive income freely, and up to $25,000/yr can offset ordinary (W-2) income if you actively participate and your MAGI is under $100k (phasing out to $0 by $150k); unused losses carry forward. On sale, claimed depreciation is recaptured at up to 25%, and gains may owe capital-gains tax (a 1031 exchange can defer both). Figures are a year-1 estimate at your 24.0% rate — not tax advice; consult a CPA.
Schools (NCES district)
- District
- Pharr-San Juan-Alamo ISD
- NCES district ID
- 4834860
- Math proficiency
- 18% ▼ -34.00%
- Reading proficiency
- 30% ▼ -11.00%
- Median HH income
- $33,757
- Composite
- 19.63/100
- National rank
- #8744
- State rank
- #740 of 826 in TX
Livability — San Juan
- Score
- 71/100
- State rank
- #294
- US rank
- #6725
Category grades
Schools grade is shown separately in the Schools card above.
Census & demographics
- Census place
- San Juan, TX
- Population (ZIP)
- 39,958
Population outlook (Hidalgo County) Hauer SSP2
- Today (2025)
- 955,232 people
- By 2030
- 1,009,774 · +5.7%
- By 2040
- 1,120,332 · +17.3%
- By 2050
- 1,225,036 · +28.2%
- By 2075
- 1,439,189 · +50.7%
- By 2100
- 1,533,429 · +60.5%
Race, ethnicity, and origin ACS 2023
- Neighborhood character
- Predominantly Hispanic (97%)
- Race & ethnicity
- Hispanic / Latino 97% Two or more races 43% White 3%
- Hispanic origin (detail)
- Mexican 94%
- Foreign-born
- 26% · Canada
- Languages at home
- 18% English-only · Spanish 82%
Political lean MEDSL · Hidalgo
- 2024 margin
- Toss-up / Even · D 48.1% · R 51.0%
- 2008→2024 swing
- -41.6pp toward R · 2008: 38.7pp · 2024: -2.9pp
- All cycles
- 2024: R+2.9 2020: D+17.1 2016: D+40.5 2012: D+41.8 2008: D+38.7
Not yet ingested
- Civics
- —
Market trends
- HPI YoY
- ▼ -32.82%
- Current HPI
- 239.3829
- Rent YoY
- —
- Metro
- —
- State GDP YoY
- ▲ 3.95%
- F500 in state
- 110
Industry mix (Fortune 500 HQ in TX)
| Industry | F500 HQs | Revenue |
|---|---|---|
| Energy | 16 | $1,198B |
|
||
| Technology | 5 | $198B |
|
||
| Engineering / Construction | 4 | $72B |
|
||
| Energy Services | 3 | $60B |
|
||
| Utilities | 3 | $41B |
|
||
| Healthcare | 2 | $330B |
|
||
Price history
-20.1% since first listed5 events — show timeline
- 2026-04-13 Relisted — MCALLENMLS
- 2026-04-13 Price Changed $199,000 MCALLENMLS
- 2025-12-16 Pending — MCALLENMLS
- 2025-12-12 Contingent — MCALLENMLS
- 2025-08-07 Listed $249,000 MCALLENMLS
Property tax history
+10.2%/yrLatest (2025): $5,892 · +38.8% YoY. Source: county tax records.
Cash-flow waterfall
monthlySold comps — $/sqft
last 12 mo · ≤1 miLoading sold comps…