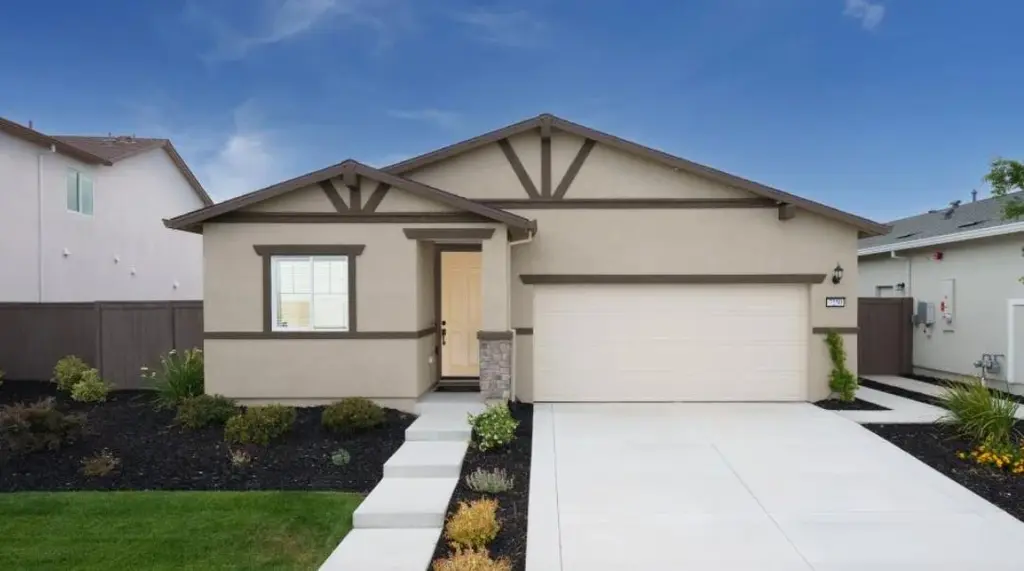
10922 Admiral Cove Way · Stockton, CA
Flood risk No data
- FEMA flood zone
- —
- Chance of flooding over 30 yrs
- —
- Est. flood insurance / yr
- —
Fire risk No data
- Est. fire insurance / yr
- —
Heat risk No data
- Hot days now (above threshold)
- —
- Hot days in 30 yrs
- —
Wind risk No data
- Chance of severe wind over 30 yrs
- —
Air-quality risk No data
- Unhealthy air days now
- —
- Unhealthy air days in 30 yrs
- —
Risk factors via First Street. Map © Google.
Why this score? — see what drove the D grade
The composite is a weighted blend of 9 inputs, each scored 0–100. Each bar is that input's sub-score; the figure is the points it added to the 100-point composite (weight × sub-score).
- ARV discount +14.2/15.0
- Appreciation +10.0/10.0
- Cash flow +4.4/30.0
- Rent growth +3.5/5.0
- Livability +2.9/5.0
- Schools +2.7/10.0
- Condition / age +2.5/5.0
- 1% rule +1.0/10.0
- DSCR +0.0/10.0
$529,530
🖨 Deal sheet 📄 Offer letter ✓ Due diligence
Listing remarks
This single-story home makes fantastic use of available space. An open-concept floorplan seamlessly connects a modern kitchen, dining room and Great Room with convenient access to an outdoor patio. There are four bedrooms in total, including the expansive owner's suite nestled into a private corner at the back of the home.
Key facts
- Modern kitchen
- Outdoor patio
- 5,432 sq ft lot
Tags
Neighborhood map
What this means for you Summary
Snapshot
- This is a 4-bed/2.0-bath single-family listed at $530k.
Deal economics
- At list price, monthly cash flow is $-1k ($-17k/yr) — negative.
- To cash-flow at today's rent, offer at most $327k (38.2% below list).
- To meet the 1% rule (rent ≥ 1% of price), the offer needs to be $319k (39.8% below list).
- Recommended offer: $319k (39.8% below list) — sets the bar for 1% rule.
Location & tenants
- Location reads 57/100 on livability (#734 in CA) — a working-class tenant base; expect higher turnover. Strengths: housing A+, health & safety A, amenities A-; Watch: employment C-, schools D-, crime F.
- Lodi Unified (urban): math 24% / reading 36% proficiency, ranked #325 of 517 in CA (top 63%) — families likely to look elsewhere, expect single-tenant / working-renter base with shorter leases.
- Market conditions: Rents rising fast (+4.2%/yr); 213 active listings in the ZIP; 5 comparable units currently listed for rent nearby; rentals lingering (median 44d on market — plan ~5-8 weeks vacancy on turnover, expect pricing pressure); 80% of comp listings sitting > 30 days — soft ceiling on asking rent; high-income renter base; 3,779 units permitted in San Joaquin County in 2024 (0 in 5+ unit buildings).
- This rent runs 34% of the median local income ($112k/yr) — at the standard rent-burdened threshold; future hikes will face affordability resistance.
Forward outlook
- In year one you build about $57k of equity ($4k loan paydown + $53k appreciation (10.0% local appreciation)).
- San Joaquin County population projected at +17% by 2050 — long-run rental-demand tailwind backs the buy-and-hold thesis.
- By year 2, paydown + projected appreciation supports a ~$91k cash-out refi (75% LTV) — recoverable capital for the next deal without selling this one.
Negotiation context
- It's been on market 60 days — a 3% lower offer ($514k) is reasonable based on typical stale-listing flexibility.
Questions for the listing agent
- What do current leases actually rent for vs. the listed asking? Can we see a recent rent roll and the last 12 months of T-12 income?
- It's been on market 60 days. Have you received any prior offers? Is the seller open to a 40% concession, seller financing, or rate buy-down credit?
- What does the HOA fee cover, when was the last increase, and are there any pending special assessments or reserve-fund shortfalls?
- Is there a deadline driving the sale (1031 exchange, divorce, estate, relocation)? That informs how much negotiation room exists.
- Schools are D-rated, which usually means shorter tenancies and higher turnover. Who's the typical renter profile here, and what's been the actual vacancy rate?
- Crime grade is F in this area — have there been break-ins, vandalism, or insurance claims at this property in the last 3 years? What carrier currently insures it and at what premium?
- The area grade is low — what's the realistic commute time and amenity access for the typical tenant pool here? Any planned neighborhood developments (good or bad) we should know about?
- What's the average days-on-market for RENTAL listings here right now (not sales)? A rising rental-DOM trend means longer vacancies and softer asking-rent achievability than the comps imply.
- What's the recent tenant-quality profile in this submarket — average credit score on applications, eviction rate, late-payment / NSF rate, and stable-employment percentage? A property-management company in the area should have these aggregated.
- How much new for-sale + rental construction is in the pipeline within 1–3 miles? Heavy new supply typically softens prices + rents 12–24 months out; constrained supply supports both.
Investment metrics
- 1% rule
- 0.60% ✗
- Cap rate
- 3.12%
- Cash-on-cash
- -11.32%
- DSCR
- 0.50
- GRM
- 13.8
CMA / ARV
- ARV (median comp)
- $622,576
- List price
- $529,530
- Delta
- -14.95%
- Verdict
- UNDERPRICED
- Comps
- 20 within 1.0 mi
Show comp detail 12 sales within ~0.75 mi
| Address | Dist | Beds/Ba | Sqft | Sold | Price | $/sf | Match |
|---|---|---|---|---|---|---|---|
| 10922 Admiral Cove Way | 0.00mi | 4/2.0 | 1,870 (0%) | 0mo | $505,000 | $270 | 100 |
| 7261 Robins Cove Dr | 0.31mi | 4/2.0 | 1,870 (0%) | 7mo | $525,000 | $281 | 80 |
| 10113 Wayfaring Dr | 0.58mi | 3/2.0 (-1) | 1,826 (-2%) | 1mo | $500,000 | $274 | 64 |
| 7225 Broom Dr | 0.49mi | 3/2.0 (-1) | 1,862 (-0%) | 14mo | $665,000 | $357 | 60 |
| 6707 Oakum Way | 0.63mi | 4/2.5 | 1,969 (+5%) | 4mo | $535,000 | $272 | 57 |
| 6715 Tailwind Ln | 0.55mi | 3/2.0 (-1) | 1,893 (+1%) | 14mo | $585,000 | $309 | 56 |
| 10537 Lake Point Ave | 0.72mi | 4/2.5 | 1,769 (-5%) | 0mo | $499,000 | $282 | 55 |
| 10525 Lake Point Ave | 0.74mi | 4/2.5 | 1,769 (-5%) | 3mo | $493,000 | $279 | 52 |
| 6813 Mount Elbrus Way | 0.74mi | 4/3.0 | 1,875 (+0%) | 13mo | $655,000 | $349 | 50 |
| 7200 Sambucus Way | 0.61mi | 4/3.0 | 2,077 (+11%) | 8mo | $635,000 | $306 | 42 |
| 10107 Downy Birch Dr | 0.57mi | 4/3.0 | 2,077 (+11%) | 14mo | $606,000 | $292 | 39 |
| 6807 Mount Elbrus Way | 0.74mi | 4/2.0 | 1,597 (-15%) | 10mo | $540,000 | $338 | 32 |
Match score weights: distance 35% · size 25% · config 20% · recency 20%. Top-matched comps best support the ARV.
Projected returns pro-forma
10.0% appreciation · 4.16% rent growth · sell at horizon
- IRR
- 16.6%
- Equity multiple
- 2.37×
- Total profit
- $203,261
- Equity at exit
- $477,043
- IRR
- 16.1%
- Equity multiple
- 5.57×
- Total profit
- $677,073
- Equity at exit
- $1,028,760
Cash invested: $148,268 (down + closing). Projections, not guarantees.
Landlord ↔ Tenant lean methodology
- Overall (STATE)
- 18 Strongly Tenant-Friendly
- State California
- 18 Strongly Tenant-Friendly · D+13
- County
- — inherits STATE
- City
- — inherits STATE
ZIP-level market 95219
- Home prices YoY
- 6.6%
- Rents YoY
- 4.2%
- Active inventory
- 213
- Price-to-rent
- 13.8×
Monthly cashflow live
- Estimated rent
- $3,190 high interval (Pro) →
- Mortgage (P&I)
- −$2,777
- Tax est. 1.5%
- −$662 /mo · $7,943/yr
- Insurance
- −$221
- HOA
- −$260
- Vacancy / Maint / Mgmt
- −$670
- Net cashflow
- $-1,399
Break-even live
UW: 25.0% down · 7.5% · 30yr · 1.5% tax · 5.0% vac · 8.0% maint · 8.0% mgmt
Financing live
Cash to close
- Down payment
- $132,382
- Closing costs
- $15,886
- Reserves months
- —
- Total cash needed
- —
Loan-product check · same deal, 3 products live
Conventional
25% down · 7.5% · 30yr
- Down + closing
- —
- Monthly P&I
- —
- Monthly cashflow
- —
- DSCR
- —
- Eligible?
- —
Personal DTI + credit; lowest rate.
DSCR
20% down · 8.5% · 30yr
- Down + closing
- —
- Monthly P&I
- —
- Monthly cashflow
- —
- DSCR
- —
- Eligible?
- —
No personal income docs; deal must DSCR.
Hard money
10% down · 12.0% · 12mo
- Down + closing
- —
- Monthly P&I
- —
- Monthly cashflow
- —
- DSCR
- —
- Eligible?
- —
Short-term bridge; refi at stabilization.
Rent comps 5 comps
| Address | Beds | Baths | Sqft | Rent | $/sqft | DOM | Units | Dist |
|---|---|---|---|---|---|---|---|---|
| 10962 Admiral Cove Way Stockton, CA | 4.0 | 3.0 | 2403 | $3,200 | $1.33 | 14d | 1 | 0.08mi |
| 7017 Overlook Way Stockton, CA | 4.0 | 3.0 | 2403 | $3,095 | $1.29 | 43d | 1 | 0.14mi |
| 6831 Oakum Way Stockton, CA | 4.0 | 3.0 | 2318 | $3,100 | $1.34 | 43d | 1 | 0.45mi |
| 10831 Larboard Ct Stockton, CA | 5.0 | 3.0 | 2160 | $3,950 | $1.83 | 43d | 1 | 0.53mi |
| 10210 Copco Ln Stockton, CA | 4.0 | 2.0 | 2252 | $3,100 | $1.38 | 43d | 1 | 1.42mi |
HOA detail
- Monthly dues
- $260 · $3,120/yr
Nearby sold comps map
Loading sold comps map…
Walkable amenities ~0.75 mi
Loading nearby amenities…
Taxation est. · year 1
- Rental income
- $38,284
- − Mortgage interest
- −$29,662
- − Property taxes
- −$7,943
- − Insurance
- −$2,648
- − Repairs & maintenance
- −$3,063
- − Management
- −$3,063
- − HOA
- −$3,120
- − Depreciation
- −$15,405
- Taxable loss
- −$26,618
- Est. tax savings @ 24.0%
- +$6,388
- After-tax cash flow
- $-10,401/yr
For passive investors: Depreciation is non-cash, so a rental often shows a tax loss while cash-flowing — sheltering income. Rental losses are passive: they offset passive income freely, and up to $25,000/yr can offset ordinary (W-2) income if you actively participate and your MAGI is under $100k (phasing out to $0 by $150k); unused losses carry forward. On sale, claimed depreciation is recaptured at up to 25%, and gains may owe capital-gains tax (a 1031 exchange can defer both). Figures are a year-1 estimate at your 24.0% rate — not tax advice; consult a CPA.
Schools (NCES district)
- District
- Lodi Unified
- NCES district ID
- 0622230
- Math proficiency
- 24% ▼ -8.00%
- Reading proficiency
- 36% ▼ -8.00%
- Median HH income
- $57,165
- Composite
- 26.84/100
- National rank
- #7108
- State rank
- #325 of 517 in CA
Livability — Stockton
- Score
- 57/100
- State rank
- #734
- US rank
- #21638
Category grades
Schools grade is shown separately in the Schools card above.
Census & demographics
- Census place
- Stockton, CA
- County
- San Joaquin County · 729,570 people
- City population
- 332,006
- Metro
- Stockton, CA
- Population (ZIP)
- 31,713
- Household income
- $112,268
- Rent vs Own
- Severe rent burden
- 825.0
Population outlook (San Joaquin County) Hauer SSP2
- Today (2025)
- 796,965 people
- By 2030
- 828,849 · +4.0%
- By 2040
- 885,611 · +11.1%
- By 2050
- 929,798 · +16.7%
- By 2075
- 994,578 · +24.8%
- By 2100
- 971,291 · +21.9%
Race, ethnicity, and origin ACS 2023
- Neighborhood character
- Highly diverse neighborhood (Simpson 0.75)
- Race & ethnicity
- White 33% Hispanic / Latino 30% Asian 21% Two or more races 18% Black 9%
- Hispanic origin (detail)
- Mexican 27%
- Common ancestry
- Slovak 2% Italian 2% Portuguese 1%
- Foreign-born
- 20% · Canada, China, Vietnam
- Languages at home
- 69% English-only · Spanish 14% Other Indo-European 4% Other Asian/Pacific 4%
Political lean MEDSL · San Joaquin
- 2024 margin
- Toss-up / Even · D 48.0% · R 48.9% · Other 3.0%
- 2008→2024 swing
- -11.6pp toward R · 2008: 10.7pp · 2024: -0.9pp
- All cycles
- 2024: R+0.9 2020: D+13.9 2016: D+12.9 2012: D+8.9 2008: D+10.7
Not yet ingested
- Civics
- —
Market trends
- HPI YoY
- ▲ 69.26%
- Current HPI
- 1122.61
- Rent YoY
- ▲ 4.16%
- Metro
- Stockton, CA
- State GDP YoY
- ▲ 3.21%
- F500 in state
- 116
Industry mix (Fortune 500 HQ in CA)
| Industry | F500 HQs | Revenue |
|---|---|---|
| Technology | 27 | $1,492B |
|
||
| Financial Services | 3 | $174B |
|
||
| Retail | 3 | $44B |
|
||
| Insurance | 3 | $26B |
|
||
| Media / Entertainment | 2 | $115B |
|
||
| Pharmaceuticals / Biotech | 2 | $62B |
|
||
Cash-flow waterfall
monthlySold comps — $/sqft
last 12 mo · ≤1 miLoading sold comps…