26455 Paradise Valley Rd #88 · Aguanga, CA
Flood risk 6/10 · Moderate
- FEMA flood zone
- D
- Chance of flooding over 30 yrs
- 0.7%
- Est. flood insurance / yr
- $544 – $1,084
Fire risk 10/10 · Severe
- Est. fire insurance / yr
- $659 – $1,223
Heat risk 5/10 · Moderate
- Hot days now (above 96°F)
- 8 days/yr
- Hot days in 30 yrs
- 23 days/yr
Wind risk 1/10 · Minimal
- Chance of severe wind over 30 yrs
- —
Air-quality risk 6/10 · Moderate
- Unhealthy air days now
- 10 days/yr
- Unhealthy air days in 30 yrs
- 12 days/yr
Risk factors via First Street. Map © Google.
Why this score? — see what drove the B- grade
The composite is a weighted blend of 9 inputs, each scored 0–100. Each bar is that input's sub-score; the figure is the points it added to the 100-point composite (weight × sub-score).
- Cash flow +30.0/30.0
- 1% rule +10.0/10.0
- DSCR +10.0/10.0
- Appreciation +10.0/10.0
- Rent growth +2.5/5.0
- Condition / age +2.5/5.0
- Schools +2.2/10.0
- Livability +1.5/5.0
- ARV discount +0.0/15.0
$75,000
🖨 Deal sheet 📄 Offer letter ✓ Due diligence
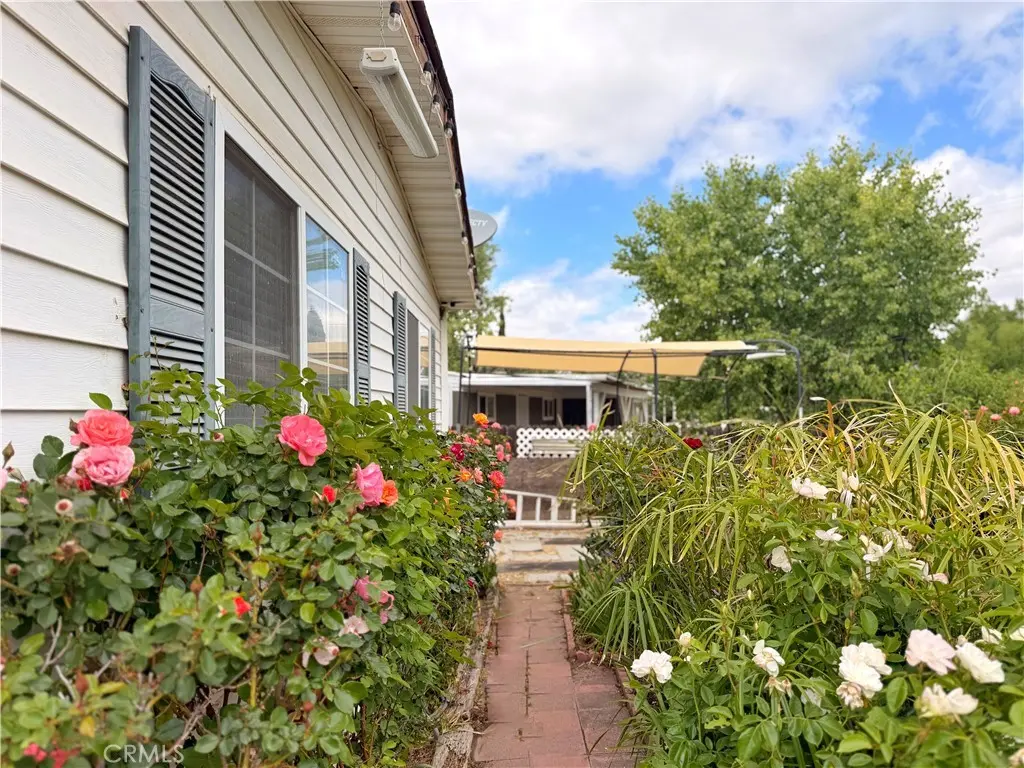
Listing remarks
Time to take it EASY. Just beyond the paddocks and pastures of the world-famous Lovacres thoroughbred racehorse ranch and at the foothills of Palomar Mountain, sits Quiet Oaks, a Mobile Home Community. This is likely the largest lot in the entire park as it spans a large rounded corner, allowing room for tons of gated, fenced and shaded parking, storage, and so much lovely yard, with grass, roses for days, grape vines, and more. The home is 3 bedrooms and two bathrooms, laundry room, dining area open to the kitchen, and a cozy living room with a faux fireplace. On the deck outside you even have a working SPA/jacuzzi which has been well maintained. There is a pergola just asking to be conver
Key facts
- Built 1982
- Listed 50 days
Property features AI
Finance
- Other: Park features and surroundings include horse trails, rural setting, biking, hiking, mountainous terrain, BLM/National Forest access, foothills, riding/stables, preserve/public land, and hunting
- Financial info: Land lease amount $695/month
- HOA & community: Land lease community (Quiet Oaks) with monthly land lease
Exterior
- Parking: Located in Quiet Oaks park
- Utilities: Private water (see remarks); Septic tank
- Home design: Single-story manufactured/mobile home (22' x 56'); Estimated year built; Mobile home remains on site
- Construction: Foundation details: see remarks
- Exterior features: Treed, secluded lot; No pool
Interior
- Bathrooms: 2 full bathrooms
- Heating & cooling: Central cooling; Central furnace heating
- Interior features: One-level floor plan; Entry on main level; Private above-ground spa (see remarks)
- Laundry & utility: Laundry inside in an individual room (see remarks)
Neighborhood map
What this means for you Summary
Snapshot
- This is a 3-bed/2.0-bath manufactured listed at $75k.
Deal economics
- At list price, monthly cash flow is $886 ($11k/yr) — positive.
- The deal already cash-flows at list — no discount required.
- Meets the 1% rule at list price ($2k rent vs $75k).
- Recommended offer: $73k (3.0% below list) — sets the bar for market timing.
- Cap rate 20.5% vs local median 2.1% in Aguanga — top-decile yield for the area; either an underpriced asset or a hidden risk that comps aren't pricing in. Stress-test before assuming the spread holds.
Location & tenants
- Location reads 29/100 on livability (#1,472 in CA) — a limited-amenity area; tenant pool skews transient or value-seeking. Strengths: crime A; Watch: schools D, amenities F, commute F.
- Warner Unified (rural): math 15% / reading 30% proficiency, ranked #1,219 of 1,400 in CA (top 87%) — low school quality limits family demand, transient renter base, plan for 1-2y turnover; 68% free/reduced lunch — lower-income household profile, screen leases tightly.
- Market conditions: 60 active listings in the ZIP; 11,759 units permitted in San Diego County in 2024 (7,244 in 5+ unit buildings).
Forward outlook
- In year one you build about $8k of equity ($519 loan paydown + $8k appreciation (10.0% local appreciation)).
- San Diego County population projected at +20% by 2050 — long-run rental-demand tailwind backs the buy-and-hold thesis.
- At projected returns (10.0% appreciation + 3.0% rent growth), your $21k cash investment doubles in ~2 years — after that, you're playing with house money.
- By year 5, paydown + projected appreciation supports a ~$37k cash-out refi (75% LTV) — recoverable capital for the next deal without selling this one.
Negotiation context
- It's been on market 51 days — a 3% lower offer ($73k) is reasonable based on typical stale-listing flexibility.
Risks & watch-outs
- Climate carrying-cost: major flood risk; severe wildfire risk; extreme-heat days projected 8→23/yr by 2055 (HVAC capex compounding) — expect insurance premiums to compound above CPI over the hold.
Questions for the listing agent
- It's been on market 51 days. Have you received any prior offers? Is the seller open to a 3% concession, seller financing, or rate buy-down credit?
- Is there a deadline driving the sale (1031 exchange, divorce, estate, relocation)? That informs how much negotiation room exists.
- Schools are D-rated, which usually means shorter tenancies and higher turnover. Who's the typical renter profile here, and what's been the actual vacancy rate?
- What's the average days-on-market for RENTAL listings here right now (not sales)? A rising rental-DOM trend means longer vacancies and softer asking-rent achievability than the comps imply.
- What's the recent tenant-quality profile in this submarket — average credit score on applications, eviction rate, late-payment / NSF rate, and stable-employment percentage? A property-management company in the area should have these aggregated.
- How much new for-sale + rental construction is in the pipeline within 1–3 miles? Heavy new supply typically softens prices + rents 12–24 months out; constrained supply supports both.
Investment metrics
- 1% rule
- 2.23% ✓
- Cap rate
- 20.47%
- Cash-on-cash
- 50.63%
- DSCR
- 3.25
- GRM
- 3.7
CMA / ARV
- ARV (median comp)
- $63,989
- List price
- $75,000
- Delta
- 17.21%
- Verdict
- OVERPRICED
- Comps
- 2 within 1.0 mi
Projected returns pro-forma
10.0% appreciation · 3.0% rent growth · sell at horizon
- IRR
- 64.1%
- Equity multiple
- 5.63×
- Total profit
- $97,254
- Equity at exit
- $67,566
- IRR
- 57.7%
- Equity multiple
- 12.52×
- Total profit
- $241,973
- Equity at exit
- $145,709
Cash invested: $21,000 (down + closing). Projections, not guarantees.
Landlord ↔ Tenant lean methodology
- Overall (STATE)
- 18 Strongly Tenant-Friendly
- State California
- 18 Strongly Tenant-Friendly · D+13
- County
- — inherits STATE
- City
- — inherits STATE
ZIP-level market 92086
- Home prices YoY
- 9.4%
- Active inventory
- 60
- Price-to-rent
- 3.7×
Monthly cashflow live
- Estimated rent
- $1,676 medium interval (Pro) →
- Mortgage (P&I)
- −$393
- Tax from tax record
- −$13 /mo · $161/yr
- Insurance
- −$31
- HOA
- −$0
- Vacancy / Maint / Mgmt
- −$352
- Net cashflow
- $886
Break-even live
UW: 25.0% down · 7.5% · 30yr · 1.5% tax · 5.0% vac · 8.0% maint · 8.0% mgmt
Financing live
Cash to close
- Down payment
- $18,750
- Closing costs
- $2,250
- Reserves months
- —
- Total cash needed
- —
Loan-product check · same deal, 3 products live
Conventional
25% down · 7.5% · 30yr
- Down + closing
- —
- Monthly P&I
- —
- Monthly cashflow
- —
- DSCR
- —
- Eligible?
- —
Personal DTI + credit; lowest rate.
DSCR
20% down · 8.5% · 30yr
- Down + closing
- —
- Monthly P&I
- —
- Monthly cashflow
- —
- DSCR
- —
- Eligible?
- —
No personal income docs; deal must DSCR.
Hard money
10% down · 12.0% · 12mo
- Down + closing
- —
- Monthly P&I
- —
- Monthly cashflow
- —
- DSCR
- —
- Eligible?
- —
Short-term bridge; refi at stabilization.
Listing history 18 events
-
2026-06-19days on market $75,000 Active 51 DOM
-
2026-06-18days on market $75,000 Active 50 DOM
-
2026-06-17days on market $75,000 Active 49 DOM
-
2026-06-16days on market $75,000 Active 48 DOM
-
2026-06-15days on market $75,000 Active 47 DOM
-
2026-06-14days on market $75,000 Active 45 DOM
-
2026-06-12days on market $75,000 Active 44 DOM
-
2026-06-09days on market $75,000 Active 41 DOM
-
2026-06-08days on market $75,000 Active 40 DOM
-
2026-06-07days on market $75,000 Active 39 DOM
-
2026-06-07days on market $75,000 Active 38 DOM
-
2026-06-04days on market $75,000 Active 35 DOM
-
2026-06-03price $75,000 Active 34 DOM
-
2026-06-02days on market $85,000 Active 34 DOM
-
2026-06-01days on market $85,000 Active 33 DOM
-
2026-05-31days on market $85,000 Active 32 DOM
-
2026-05-31days on market $85,000 Active 31 DOM
-
2026-04-29$85,000 Active 1254-char remark
ⓘ Source: listings_history table (triggers on properties + properties_extension) + one-shot
backfill from property_details.listing_events for pre-trigger history.
Tax reassessment forecast CA · Resets to sale price
- Current annual tax
- $161 · $13/mo
- Projected year-2 tax
- $570 · $48/mo
- Expected delta
- +$409/yr (+$34/mo · 254.0%)
ⓘ Screening estimate from a state-policy table — verify with the county assessor before closing.
Climate risk First Street
- Flood 6/10 Major FEMA zone D · 70% chance over 30 yrs
- Wildfire 10/10 Extreme
- Heat 5/10 Major 8 d/yr ≥96°F today · 23 d/yr by 30 yrs out
- Wind 1/10 Low
- Air quality 6/10 Major 10 unhealthy d/yr today · 12 by 30 yrs out
Nearby sold comps map
Loading sold comps map…
Walkable amenities ~0.75 mi
Loading nearby amenities…
Taxation est. · year 1
- Rental income
- $20,111
- − Mortgage interest
- −$4,201
- − Property taxes
- −$161
- − Insurance
- −$375
- − Repairs & maintenance
- −$1,609
- − Management
- −$1,609
- − Depreciation
- −$2,182
- Taxable income
- $9,975
- Est. tax owed @ 24.0%
- −$2,394
- After-tax cash flow
- $8,238/yr
For passive investors: Depreciation is non-cash, so a rental often shows a tax loss while cash-flowing — sheltering income. Rental losses are passive: they offset passive income freely, and up to $25,000/yr can offset ordinary (W-2) income if you actively participate and your MAGI is under $100k (phasing out to $0 by $150k); unused losses carry forward. On sale, claimed depreciation is recaptured at up to 25%, and gains may owe capital-gains tax (a 1031 exchange can defer both). Figures are a year-1 estimate at your 24.0% rate — not tax advice; consult a CPA.
Schools (NCES district)
- District
- Warner Unified
- NCES district ID
- 0600042
- Math proficiency
- 15% ▬ 0.00%
- Reading proficiency
- 30% ▲ 10.00%
- Median HH income
- $38,559
- Composite
- 22.01/100
- National rank
- #13538
- State rank
- #1219 of 1400 in CA
Livability — Aguanga
- Score
- 29/100
- State rank
- #1472
- US rank
- #27924
Category grades
Schools grade is shown separately in the Schools card above.
Census & demographics
- Population (ZIP)
- 1,410
Population outlook (San Diego County) Hauer SSP2
- Today (2025)
- 3,678,185 people
- By 2030
- 3,856,546 · +4.8%
- By 2040
- 4,171,407 · +13.4%
- By 2050
- 4,421,607 · +20.2%
- By 2075
- 4,831,599 · +31.4%
- By 2100
- 4,832,502 · +31.4%
Race, ethnicity, and origin ACS 2023
- Neighborhood character
- Diverse neighborhood (Simpson 0.56)
- Race & ethnicity
- White 61% Hispanic / Latino 26% Two or more races 17% Asian 5% Native American 5%
- Hispanic origin (detail)
- Mexican 20%
- Common ancestry
- Iranian 3% Italian 3% Lithuanian 1%
- Foreign-born
- 14% · Canada, South Korea
- Languages at home
- 85% English-only · Spanish 11% Korean 2% Tagalog/Filipino 1%
Political lean MEDSL · San Diego
- 2024 margin
- D (+16.8) · D 56.9% · R 40.1% · Other 2.9%
- 2008→2024 swing
- +6.6pp toward D · 2008: 10.2pp · 2024: 16.8pp
- All cycles
- 2024: D+16.8 2020: D+22.8 2016: D+17.8 2012: D+5.1 2008: D+10.2
Not yet ingested
- Civics
- —
Market trends
- HPI YoY
- ▲ 28.73%
- Current HPI
- 334.0631
- Rent YoY
- —
- Metro
- —
- State GDP YoY
- ▲ 3.21%
- F500 in state
- 116
Industry mix (Fortune 500 HQ in CA)
| Industry | F500 HQs | Revenue |
|---|---|---|
| Technology | 27 | $1,492B |
|
||
| Financial Services | 3 | $174B |
|
||
| Retail | 3 | $44B |
|
||
| Insurance | 3 | $26B |
|
||
| Media / Entertainment | 2 | $115B |
|
||
| Pharmaceuticals / Biotech | 2 | $62B |
|
||
Price history
-11.8% since first listed2 events — show timeline
- 2026-06-02 Price Changed $75,000 CRMLS
- 2026-04-29 Listed $85,000 CRMLS
Property tax history
+1.9%/yrLatest (2013): $161 · +2.6% YoY. Source: county tax records.
Cash-flow waterfall
monthlySold comps — $/sqft
last 12 mo · ≤1 miLoading sold comps…