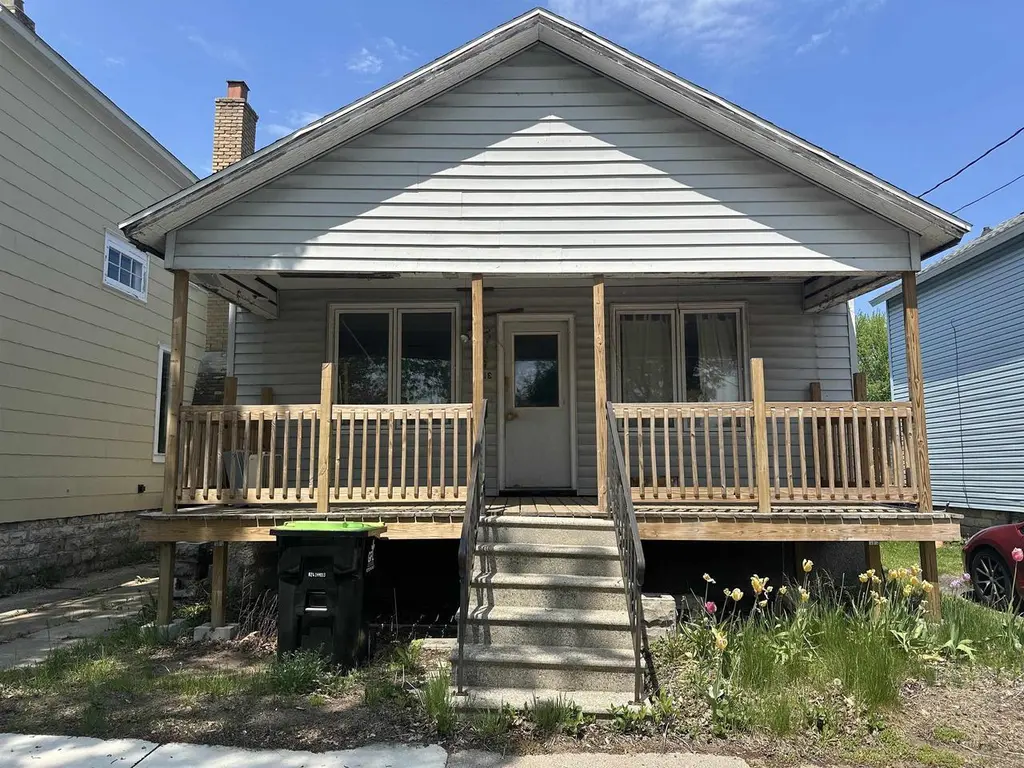
812 12th Ave · Menominee, MI
Flood risk 1/10 · Minimal
- FEMA flood zone
- X (unshaded)
- Chance of flooding over 30 yrs
- 0.0%
- Est. flood insurance / yr
- $473 – $860
Fire risk 1/10 · Minimal
- Est. fire insurance / yr
- $784 – $1,456
Heat risk 1/10 · Minimal
- Hot days now (above 93°F)
- 7 days/yr
- Hot days in 30 yrs
- 13 days/yr
Wind risk 1/10 · Minimal
- Chance of severe wind over 30 yrs
- —
Air-quality risk 2/10 · Minimal
- Unhealthy air days now
- 0 days/yr
- Unhealthy air days in 30 yrs
- 1 days/yr
Risk factors via First Street. Map © Google.
Why this score? — see what drove the B grade
The composite is a weighted blend of 9 inputs, each scored 0–100. Each bar is that input's sub-score; the figure is the points it added to the 100-point composite (weight × sub-score).
- Cash flow +27.3/30.0
- ARV discount +15.0/15.0
- DSCR +9.5/10.0
- 1% rule +7.4/10.0
- Livability +3.6/5.0
- Schools +2.9/10.0
- Rent growth +2.5/5.0
- Condition / age +2.5/5.0
- Appreciation +0.0/10.0
$69,900
🖨 Deal sheet 📄 Offer letter ✓ Due diligence
Listing remarks
A fantastic opportunity for anyone looking to bring a home back to life. This property offers great bones, a newly built front porch, and a newer roof, giving you a solid head start on the big-ticket items. While the interior and exterior are in significant need of repair, the structure provides a strong foundation for renovation, customization, or investment. Inside, you?ll find a layout ready to be reimagined?perfect for someone with vision, creativity, or a desire to build equity. Whether you?re an investor, a contractor, or a homeowner looking for a project, this home offers the chance to transform a distressed property into something truly special. * Room dimensions are approximate *
Key facts
- Strong foundation
- Newer roof
- 3,920 sq ft lot
Tags
Property features AI
Exterior
- Parking: Detached 1-car garage
- Utilities: Municipal water; Municipal sewer
- Home design: Single-family, 1-story home; Estimated living area between 1,001 and 1,250 sq ft (about 1,143 sq ft above grade)
- Construction: Construction completed
- Exterior features: Vinyl exterior; Residential zoning; Lot size about 0.09 acres (< 1/2 acre)
Interior
- Kitchen: Kitchen on the main level, approximately 12 x 12
- Bedrooms: Master bedroom on the main level, approximately 10 x 12
- Bathrooms: 1 full bathroom
- Heating & cooling: Radiant heat powered by natural gas
- Interior features: Full stone basement
Neighborhood map
What this means for you Summary
Snapshot
- This is a 1-bed/1.0-bath single-family listed at $70k.
Deal economics
- At list price, monthly cash flow is $202 ($2k/yr) — positive.
- The deal already cash-flows at list — no discount required.
- Meets the 1% rule at list price ($867 rent vs $70k).
- Recommended offer: $69k (1.5% below list) — sets the bar for market timing.
- Cap rate 9.8% vs local median 4.0% in Menominee — top-decile yield for the area; either an underpriced asset or a hidden risk that comps aren't pricing in. Stress-test before assuming the spread holds.
Location & tenants
- Location reads 71/100 on livability (#282 in MI) — a middle-class / working-renter tenant base. Strengths: cost of living A+, housing A+, health & safety A+; Watch: amenities F, commute F, employment F.
- Menominee Area Public Schools (town): math 26% / reading 42% proficiency, ranked #312 of 540 in MI (top 58%) — families likely to look elsewhere, expect single-tenant / working-renter base with shorter leases.
- Zoned schools: Menominee High School (math 22% / reading 47%, grade F, #372 of 713 statewide, top 56%, 350 students, 42% FRL) — zoned schools at 42% FRL track the district average.
- Market conditions: 64 active listings in the ZIP; 3 comparable units currently listed for rent nearby; rentals lingering (median 44d on market — plan ~5-8 weeks vacancy on turnover, expect pricing pressure); 100% of comp listings sitting > 30 days — soft ceiling on asking rent; 26 units permitted in Menominee County in 2024 (0 in 5+ unit buildings).
Forward outlook
- Local home prices are declining (-3.0%/yr); year-one equity from $483 of loan paydown is wiped out by about $2k of value loss. Plan a longer hold.
- Menominee County population projected at -19% by 2050 — secular population decline; favor cash flow + early exit over multi-decade hold.
- At projected returns (-3.0% appreciation + 3.0% rent growth), your $20k cash investment doubles in ~10 years — after that, you're playing with house money.
Negotiation context
- It's been on market 16 days — a 2% lower offer ($69k) is reasonable based on typical stale-listing flexibility.
Questions for the listing agent
- Built in 1971 — when were the roof, HVAC, electrical panel, plumbing, and water heater last replaced?
- Is there a deadline driving the sale (1031 exchange, divorce, estate, relocation)? That informs how much negotiation room exists.
- What's the average days-on-market for RENTAL listings here right now (not sales)? A rising rental-DOM trend means longer vacancies and softer asking-rent achievability than the comps imply.
- What's the recent tenant-quality profile in this submarket — average credit score on applications, eviction rate, late-payment / NSF rate, and stable-employment percentage? A property-management company in the area should have these aggregated.
- How much new for-sale + rental construction is in the pipeline within 1–3 miles? Heavy new supply typically softens prices + rents 12–24 months out; constrained supply supports both.
Investment metrics
- 1% rule
- 1.24% ✓
- Cap rate
- 9.75%
- Cash-on-cash
- 12.36%
- DSCR
- 1.55
- GRM
- 6.7
CMA / ARV
- ARV (on-the-fly)
- $137,160
- Comps found
- 11
Show comp detail 11 sales within ~0.75 mi
| Address | Dist | Beds/Ba | Sqft | Sold | Price | $/sf | Match |
|---|---|---|---|---|---|---|---|
| 705 11th Ave | 0.13mi | 2/1.0 (+1) | 1,080 (-6%) | 2mo | $132,000 | $122 | 78 |
| 813 12th Ave | 0.04mi | 2/1.0 (+1) | 1,246 (+9%) | 1mo | $149,900 | $120 | 78 |
| 809 13th Ave | 0.03mi | 2/1.0 (+1) | 1,200 (+5%) | 10mo | $105,000 | $88 | 77 |
| 1200 9th St | 0.02mi | 2/1.0 (+1) | 1,056 (-8%) | 10mo | $163,000 | $154 | 73 |
| 1005 8th Ave | 0.31mi | 2/1.0 (+1) | 1,076 (-6%) | 0mo | $129,500 | $120 | 70 |
| 1016 13th Ave | 0.14mi | 2/1.0 (+1) | 1,055 (-8%) | 17mo | $111,000 | $105 | 62 |
| 609 12th Ave | 0.14mi | 2/1.0 (+1) | 1,000 (-12%) | 12mo | $52,500 | $53 | 58 |
| 1901 16th Ave | 0.71mi | 2/1.0 (+1) | 1,222 (+7%) | 0mo | $185,000 | $151 | 50 |
| 1800 16th Ave | 0.66mi | 2/1.5 (+1) | 1,224 (+7%) | 5mo | $185,000 | $151 | 46 |
| 309 4th Pl | 0.68mi | 2/1.5 (+1) | 1,044 (-9%) | 16mo | $164,400 | $157 | 33 |
| 1821 15th St | 0.60mi | 2/1.0 (+1) | 1,011 (-12%) | 21mo | $117,000 | $116 | 31 |
Match score weights: distance 35% · size 25% · config 20% · recency 20%. Top-matched comps best support the ARV.
Projected returns pro-forma
-3.0% appreciation · 3.0% rent growth · sell at horizon
- IRR
- 2.0%
- Equity multiple
- 1.08×
- Total profit
- $1,530
- Equity at exit
- $10,422
- IRR
- 11.6%
- Equity multiple
- 1.92×
- Total profit
- $17,924
- Equity at exit
- $6,044
Cash invested: $19,572 (down + closing). Projections, not guarantees.
Landlord ↔ Tenant lean methodology
- Overall (STATE)
- 62 Landlord-Friendly
- State Michigan
- 62 Landlord-Friendly · EVEN
- County
- — inherits STATE
- City
- — inherits STATE
ZIP-level market 49858
- Home prices YoY
- -31.4%
- Active inventory
- 64
- Price-to-rent
- 6.7×
Monthly cashflow live
- Estimated rent
- $867 medium interval (Pro) →
- Mortgage (P&I)
- −$367
- Tax est. 1.5%
- −$87 /mo · $1,048/yr
- Insurance
- −$29
- HOA
- −$0
- Vacancy / Maint / Mgmt
- −$182
- Net cashflow
- $202
Break-even live
UW: 25.0% down · 7.5% · 30yr · 1.5% tax · 5.0% vac · 8.0% maint · 8.0% mgmt
Financing live
Cash to close
- Down payment
- $17,475
- Closing costs
- $2,097
- Reserves months
- —
- Total cash needed
- —
Loan-product check · same deal, 3 products live
Conventional
25% down · 7.5% · 30yr
- Down + closing
- —
- Monthly P&I
- —
- Monthly cashflow
- —
- DSCR
- —
- Eligible?
- —
Personal DTI + credit; lowest rate.
DSCR
20% down · 8.5% · 30yr
- Down + closing
- —
- Monthly P&I
- —
- Monthly cashflow
- —
- DSCR
- —
- Eligible?
- —
No personal income docs; deal must DSCR.
Hard money
10% down · 12.0% · 12mo
- Down + closing
- —
- Monthly P&I
- —
- Monthly cashflow
- —
- DSCR
- —
- Eligible?
- —
Short-term bridge; refi at stabilization.
Rent comps 3 comps
| Address | Beds | Baths | Sqft | Rent | $/sqft | DOM | Units | Dist |
|---|---|---|---|---|---|---|---|---|
| 1701 Dunlap Ave Marinette, WI | 2.0 | 1.0 | 1175 | $945 | $0.80 | 43d | 1 | 1.16mi |
| 10 Cottage Row Unit 4 Marinette, WI | 2.0 | 1.0 | 700 | $475 | $0.68 | 43d | 1 | 1.23mi |
| 403 Water St Unit 403 1/2 Marinette, WI | 2.0 | 1.0 | 800 | $1,100 | $1.38 | 43d | 1 | 1.27mi |
Listing history 14 events
-
2026-06-19days on market $69,900 Active 16 DOM
-
2026-06-18days on market $69,900 Active 15 DOM
-
2026-06-17days on market $69,900 Active 14 DOM
-
2026-06-16days on market $69,900 Active 13 DOM
-
2026-06-15days on market $69,900 Active 12 DOM
-
2026-06-14days on market $69,900 Active 10 DOM
-
2026-06-12days on market $69,900 Active 9 DOM
-
2026-06-09days on market $69,900 Active 6 DOM
-
2026-06-08days on market $69,900 Active 5 DOM
-
2026-06-07days on market $69,900 Active 4 DOM
-
2026-06-07remarks 699-char remark
-
2026-06-07days on market $69,900 Active 3 DOM
-
2026-06-04remarks 693-char remark
-
2026-06-04$69,900 Active 1 DOM
ⓘ Source: listings_history table (triggers on properties + properties_extension) + one-shot
backfill from property_details.listing_events for pre-trigger history.
Climate risk First Street
- Flood 1/10 Low FEMA zone X (unshaded) · 0% chance over 30 yrs
- Wildfire 1/10 Low
- Heat 1/10 Low 7 d/yr ≥93°F today · 13 d/yr by 30 yrs out
- Wind 1/10 Low
- Air quality 2/10 Low 0 unhealthy d/yr today · 1 by 30 yrs out
Nearby sold comps map
Loading sold comps map…
Walkable amenities ~0.75 mi
Loading nearby amenities…
Taxation est. · year 1
- Rental income
- $10,401
- − Mortgage interest
- −$3,915
- − Property taxes
- −$1,048
- − Insurance
- −$350
- − Repairs & maintenance
- −$832
- − Management
- −$832
- − Depreciation
- −$2,033
- Taxable income
- $1,390
- Est. tax owed @ 24.0%
- −$334
- After-tax cash flow
- $2,086/yr
For passive investors: Depreciation is non-cash, so a rental often shows a tax loss while cash-flowing — sheltering income. Rental losses are passive: they offset passive income freely, and up to $25,000/yr can offset ordinary (W-2) income if you actively participate and your MAGI is under $100k (phasing out to $0 by $150k); unused losses carry forward. On sale, claimed depreciation is recaptured at up to 25%, and gains may owe capital-gains tax (a 1031 exchange can defer both). Figures are a year-1 estimate at your 24.0% rate — not tax advice; consult a CPA.
Schools (NCES district)
- District
- Menominee Area Public Schools
- NCES district ID
- 2623550
- Math proficiency
- 26% ▼ -6.00%
- Reading proficiency
- 42% ▼ -3.00%
- Median HH income
- $41,809
- Composite
- 28.68/100
- National rank
- #6694
- State rank
- #312 of 540 in MI
Livability — Menominee
- Score
- 71/100
- State rank
- #282
- US rank
- #6909
Category grades
Schools grade is shown separately in the Schools card above.
Census & demographics
- Census place
- Menominee, MI
- Population (ZIP)
- 11,870
Population outlook (Menominee County) Hauer SSP2
- Today (2025)
- 22,668 people
- By 2030
- 21,986 · -3.0%
- By 2040
- 20,196 · -10.9%
- By 2050
- 18,335 · -19.1%
- By 2075
- 14,771 · -34.8%
- By 2100
- 10,999 · -51.5%
Race, ethnicity, and origin ACS 2023
- Neighborhood character
- Predominantly White (95%)
- Race & ethnicity
- White 95% Two or more races 4% Hispanic / Latino 2%
- Common ancestry
- Lithuanian 8% Romanian 7% Portuguese 4%
- Foreign-born
- 2% · Canada
- Languages at home
- 99% English-only · French/Haitian/Cajun 1%
Political lean MEDSL · Menominee
- 2024 margin
- Solid R (+33.6) · D 32.6% · R 66.2% · Other 1.2%
- 2008→2024 swing
- -43.8pp toward R · 2008: 10.2pp · 2024: -33.6pp
- All cycles
- 2024: R+33.6 2020: R+30.1 2016: R+29.4 2012: R+2.9 2008: D+10.2
Not yet ingested
- Civics
- —
Market trends
- HPI YoY
- ▼ -94.34%
- Current HPI
- 206.2461
- Rent YoY
- —
- Metro
- —
- State GDP YoY
- ▲ 1.37%
- F500 in state
- 28
Industry mix (Fortune 500 HQ in MI)
| Industry | F500 HQs | Revenue |
|---|---|---|
| Automotive Parts | 3 | $48B |
|
||
| Automotive | 2 | $372B |
|
||
| Chemicals | 1 | $45B |
|
||
| Automotive Retail | 1 | $29B |
|
||
| Healthcare / Medical Devices | 1 | $23B |
|
||
| Automotive Technology | 1 | $20B |
|
||
Price history
1 event — show timeline
- 2026-06-01 Listed $69,900 RANW
Cash-flow waterfall
monthlySold comps — $/sqft
last 12 mo · ≤1 miLoading sold comps…