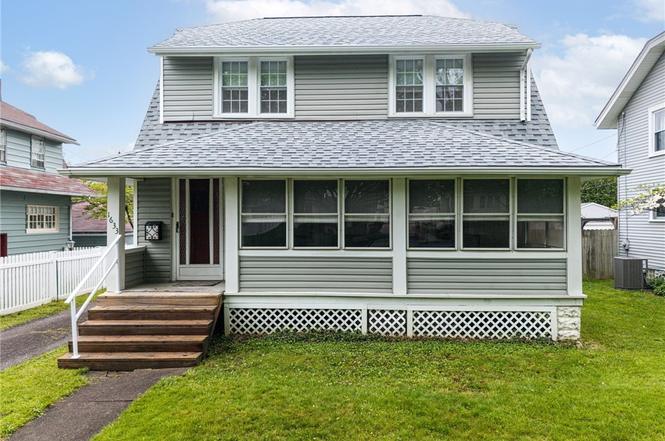
1633 Glenmount Ave · Akron, OH
Flood risk 1/10 · Minimal
- FEMA flood zone
- X (unshaded)
- Chance of flooding over 30 yrs
- 0.0%
- Est. flood insurance / yr
- $473 – $860
Fire risk 1/10 · Minimal
- Est. fire insurance / yr
- $713 – $1,323
Heat risk 3/10 · Minor
- Hot days now (above 96°F)
- 7 days/yr
- Hot days in 30 yrs
- 17 days/yr
Wind risk 1/10 · Minimal
- Chance of severe wind over 30 yrs
- —
Air-quality risk 2/10 · Minimal
- Unhealthy air days now
- 1 days/yr
- Unhealthy air days in 30 yrs
- 2 days/yr
Risk factors via First Street. Map © Google.
Why this score? — see what drove the D+ grade
The composite is a weighted blend of 9 inputs, each scored 0–100. Each bar is that input's sub-score; the figure is the points it added to the 100-point composite (weight × sub-score).
- ARV discount +15.0/15.0
- Cash flow +13.4/30.0
- 1% rule +4.3/10.0
- DSCR +4.0/10.0
- Livability +4.0/5.0
- Rent growth +3.7/5.0
- Condition / age +2.5/5.0
- Schools +2.1/10.0
- Appreciation +0.0/10.0
$139,500
🖨 Deal sheet 📄 Offer letter ✓ Due diligence
Listing remarks
Step into a home with personality, warmth, and the kind of charm today’s cookie-cutter houses wish they had. This beautifully maintained 3-bedroom Colonial offers 1,290 square feet of inviting living space filled with rich original woodwork, gleaming hardwood floors, stained glass accents, and timeless architectural details that immediately make you feel at home. The spacious living and dining rooms bring all the character with gorgeous natural trim, arched openings, and sunlight pouring through every window, creating the perfect mix of cozy and classic. The enclosed front porch adds even more flexible living space and practically begs for morning coffee, late-night chats, or your fav
Key facts
- Original woodwork
- Hardwood floors
- Enclosed front porch
Tags
Property features AI
Exterior
- Parking: Detached garage with 2 spaces
- Utilities: Public water; Public sewer
- Home design: 2 stories; Vinyl siding construction; Asphalt/fiberglass roof
- Construction: Built per public records (year source: Public Records)
- Exterior features: Chain link fencing; Lot approximately 0.1377 acres
Interior
- Kitchen: Includes standard appliances (details not provided)
- Bedrooms: Total rooms: 6
- Bathrooms: 1 full bathroom
- Heating & cooling: Forced air heating; Gas heating; Central air conditioning; Fireplace contributes to heating
- Interior features: Full basement; Gas fireplace (1)
- Laundry & utility: Laundry located in the basement
Neighborhood map
What this means for you Summary
Snapshot
- This is a 3-bed/1.0-bath single-family listed at $140k.
Deal economics
- At list price, monthly cash flow is $2 ($21/yr) — positive.
- The deal already cash-flows at list — no discount required.
- To meet the 1% rule (rent ≥ 1% of price), the offer needs to be $130k (7.0% below list).
- Recommended offer: $130k (7.0% below list) — sets the bar for 1% rule.
Location & tenants
- Location reads 81/100 on livability (#104 in OH, #1,591 nationally) — a professional / high-income tenant draw. Strengths: amenities A+, commute A+, cost of living A+; Watch: crime F, employment F.
- Akron City (urban): math 22% / reading 30% proficiency, ranked #602 of 656 in OH (top 92%) — low school quality limits family demand, transient renter base, plan for 1-2y turnover; 66% free/reduced lunch — lower-income household profile, screen leases tightly.
- Market conditions: Rents rising fast (+4.6%/yr); 83 active listings in the ZIP; 31 comparable units currently listed for rent nearby; rentals lingering (median 44d on market — plan ~5-8 weeks vacancy on turnover, expect pricing pressure); 58% of comp listings sitting > 30 days — soft ceiling on asking rent; 1,114 units permitted in Summit County in 2024 (397 in 5+ unit buildings).
- This rent runs 30% of the median local income ($51k/yr) — at the standard rent-burdened threshold; future hikes will face affordability resistance.
Forward outlook
- Local home prices are declining (-3.0%/yr); year-one equity from $964 of loan paydown is wiped out by about $4k of value loss. Plan a longer hold.
- Summit County population projected to shrink 6% by 2050 — rents likely to lag national; underwrite the cash flow, not the appreciation.
Negotiation context
- It's been on market 32 days — a 3% lower offer ($135k) is reasonable based on typical stale-listing flexibility.
- 2 sale attempts since 34y ago with the ask held roughly flat each time — persistent listings suggest the price (not the market) is what's stuck; bring a comps-based counter.
- Current owner paid $70k; list at $140k implies a 100% gain — meaningful room to come down on a strong offer.
Risks & watch-outs
- Watch-outs: built in 1927 — expect roof / HVAC / electrical / plumbing capex.
Questions for the listing agent
- It's been on market 32 days. Have you received any prior offers? Is the seller open to a 7% concession, seller financing, or rate buy-down credit?
- Built in 1927 — when were the roof, HVAC, electrical panel, plumbing, and water heater last replaced?
- Is there a deadline driving the sale (1031 exchange, divorce, estate, relocation)? That informs how much negotiation room exists.
- Crime grade is F in this area — have there been break-ins, vandalism, or insurance claims at this property in the last 3 years? What carrier currently insures it and at what premium?
- The area grade is low — what's the realistic commute time and amenity access for the typical tenant pool here? Any planned neighborhood developments (good or bad) we should know about?
- What's the average days-on-market for RENTAL listings here right now (not sales)? A rising rental-DOM trend means longer vacancies and softer asking-rent achievability than the comps imply.
- What's the recent tenant-quality profile in this submarket — average credit score on applications, eviction rate, late-payment / NSF rate, and stable-employment percentage? A property-management company in the area should have these aggregated.
- How much new for-sale + rental construction is in the pipeline within 1–3 miles? Heavy new supply typically softens prices + rents 12–24 months out; constrained supply supports both.
Investment metrics
- 1% rule
- 0.93% ✗
- Cap rate
- 6.31%
- Cash-on-cash
- 0.05%
- DSCR
- 1.00
- GRM
- 9.0
CMA / ARV
- ARV (on-the-fly)
- $183,180
- Comps found
- 12
Show comp detail 12 sales within ~0.75 mi
| Address | Dist | Beds/Ba | Sqft | Sold | Price | $/sf | Match |
|---|---|---|---|---|---|---|---|
| 355 E Dresden Ave | 0.30mi | 3/1.0 | 1,290 (0%) | 0mo | $210,000 | $163 | 86 |
| 370 Cypress Ave | 0.25mi | 3/1.0 | 1,373 (+6%) | 1mo | $150,000 | $109 | 76 |
| 1612 Oakwood Ave | 0.33mi | 3/1.0 | 1,176 (-9%) | 3mo | $132,800 | $113 | 68 |
| 1429 Bellows St | 0.53mi | 3/1.0 | 1,198 (-7%) | 3mo | $150,000 | $125 | 61 |
| 1682 Sunset Ave | 0.41mi | 3/2.0 | 1,175 (-9%) | 1mo | $168,000 | $143 | 61 |
| 1842 Thornapple Ave | 0.31mi | 3/1.0 | 1,112 (-14%) | 2mo | $165,000 | $148 | 61 |
| 361 S Firestone Blvd | 0.26mi | 3/2.5 | 1,482 (+15%) | 1mo | $235,000 | $159 | 56 |
| 502 E Woodsdale Ave | 0.53mi | 3/2.0 | 1,184 (-8%) | 2mo | $168,700 | $142 | 56 |
| 485 E Archwood Ave | 0.73mi | 3/1.0 | 1,204 (-7%) | 1mo | $101,000 | $84 | 54 |
| 16 Palmetto Ave | 0.60mi | 3/1.0 | 1,440 (+12%) | 2mo | $79,000 | $55 | 51 |
| 695 Cooper Ave | 0.69mi | 3/1.5 | 1,155 (-10%) | 3mo | $165,500 | $143 | 46 |
| 1281 Neptune Ave | 0.72mi | 3/2.0 | 1,172 (-9%) | 2mo | $120,000 | $102 | 45 |
Match score weights: distance 35% · size 25% · config 20% · recency 20%. Top-matched comps best support the ARV.
Projected returns pro-forma
-3.0% appreciation · 4.62% rent growth · sell at horizon
- IRR
- -14.3%
- Equity multiple
- 0.48×
- Total profit
- $-20,290
- Equity at exit
- $20,800
- IRR
- -2.9%
- Equity multiple
- 0.79×
- Total profit
- $-8,188
- Equity at exit
- $12,061
Cash invested: $39,060 (down + closing). Projections, not guarantees.
Landlord ↔ Tenant lean methodology
- Overall (STATE)
- 73 Landlord-Friendly
- State Ohio
- 73 Landlord-Friendly · R+6
- County
- — inherits STATE
- City
- — inherits STATE
ZIP-level market 44301
- Home prices YoY
- -25.7%
- Rents YoY
- 4.6%
- Active inventory
- 83
- Price-to-rent
- 9.0×
Monthly cashflow live
- Estimated rent
- $1,297 high interval (Pro) →
- Mortgage (P&I)
- −$732
- Tax from tax record
- −$233 /mo · $2,797/yr
- Insurance
- −$58
- HOA
- −$0
- Vacancy / Maint / Mgmt
- −$272
- Net cashflow
- $2
Break-even live
UW: 25.0% down · 7.5% · 30yr · 1.5% tax · 5.0% vac · 8.0% maint · 8.0% mgmt
Financing live
Cash to close
- Down payment
- $34,875
- Closing costs
- $4,185
- Reserves months
- —
- Total cash needed
- —
Loan-product check · same deal, 3 products live
Conventional
25% down · 7.5% · 30yr
- Down + closing
- —
- Monthly P&I
- —
- Monthly cashflow
- —
- DSCR
- —
- Eligible?
- —
Personal DTI + credit; lowest rate.
DSCR
20% down · 8.5% · 30yr
- Down + closing
- —
- Monthly P&I
- —
- Monthly cashflow
- —
- DSCR
- —
- Eligible?
- —
No personal income docs; deal must DSCR.
Hard money
10% down · 12.0% · 12mo
- Down + closing
- —
- Monthly P&I
- —
- Monthly cashflow
- —
- DSCR
- —
- Eligible?
- —
Short-term bridge; refi at stabilization.
Rent comps 31 comps
| Address | Beds | Baths | Sqft | Rent | $/sqft | DOM | Units | Dist |
|---|---|---|---|---|---|---|---|---|
| 373 N Firestone Blvd Akron, OH | 4.0 | 1.5 | 1590 | $1,550 | $0.97 | 43d | 1 | 0.54mi |
| 36 W Wilbeth Rd Akron, OH | 3.0 | 1.0 | 1382 | $1,150 | $0.83 | 14d | 1 | 0.72mi |
| 44 E Brookside Ave Akron, OH | 2.0 | 1.0 | 1762 | $900 | $0.51 | 14d | 1 | 0.73mi |
| 1298 Bellows St Akron, OH | 3.0 | 1.0 | 1300 | $1,250 | $0.96 | 43d | 1 | 0.77mi |
| 78 E Mapledale Ave Akron, OH | 4.0 | 1.5 | 1600 | $1,500 | $0.94 | 14d | 1 | 0.77mi |
| 1313 Coventry St Akron, OH | 2.0 | 1.0 | 913 | $1,250 | $1.37 | 14d | 1 | 0.78mi |
| 147 Brighton Dr Akron, OH | 3.0 | 1.0 | 1040 | $1,350 | $1.30 | 23d | 1 | 0.82mi |
| 67 E Archwood Ave Unit A Akron, OH | 2.0 | 1.0 | 1000 | $850 | $0.85 | 43d | 1 | 0.85mi |
| 67 E Archwood Ave Unit B Akron, OH | 4.0 | 1.0 | 1200 | $1,050 | $0.88 | 43d | 1 | 0.85mi |
| 94 Brighton Dr Akron, OH | 3.0 | 1.0 | 1000 | $1,100 | $1.10 | 43d | 1 | 0.85mi |
| 764 Lindsay Ave Akron, OH | 3.0 | 1.0 | 1000 | $1,295 | $1.29 | 14d | 1 | 0.88mi |
| 1200 Girard St Akron, OH | 3.0 | 2.0 | 1438 | $1,100 | $0.76 | 14d | 1 | 0.92mi |
| 1204 Inman St Akron, OH | 3.0 | 1.0 | 1080 | $1,200 | $1.11 | 23d | 1 | 0.97mi |
| 1368 Moore St Akron, OH | 4.0 | 1.0 | 1575 | $1,300 | $0.83 | 43d | 1 | 0.97mi |
| 1102 Neptune Ave Akron, OH | 3.0 | 1.0 | 1000 | $1,200 | $1.20 | 43d | 1 | 1.01mi |
| 1114 Herberich Ave Akron, OH | 4.0 | 1.0 | 1308 | $1,200 | $0.92 | 43d | 1 | 1.02mi |
| 466 Adkins Ave Akron, OH | 4.0 | 1.5 | 1800 | $1,450 | $0.81 | 43d | 1 | 1.02mi |
| 1070 Super Genius Cir Akron, OH | 2.0–4.0 | 1.0–2.0 | 1145 | $1,174 | $1.03 | 14d | 1 | 1.10mi |
| 1282 Andrus St Akron, OH | 4.0 | 1.0 | 1242 | $1,195 | $0.96 | 43d | 1 | 1.10mi |
| 1085 Herberich Ave Akron, OH | 4.0 | 1.0 | 1350 | $1,400 | $1.04 | 43d | 1 | 1.10mi |
| 1040 Neptune Ave Akron, OH | 4.0 | 1.0 | 1400 | $1,300 | $0.93 | 43d | 1 | 1.13mi |
| 1036 Neptune Ave Akron, OH | 3.0 | 1.0 | 1000 | $1,350 | $1.35 | 43d | 1 | 1.13mi |
| 1028 Kling St Akron, OH | 4.0 | 2.0 | 1500 | $1,450 | $0.97 | 43d | 1 | 1.17mi |
| 1012 Brown St Akron, OH | 4.0 | 2.0 | 1518 | $1,295 | $0.85 | 43d | 1 | 1.21mi |
| 979 Neptune Ave Akron, OH | 3.0 | 1.0 | 1248 | $1,250 | $1.00 | 23d | 1 | 1.24mi |
| 1139 Marcy St Akron, OH | 4.0 | 1.5 | 1300 | $1,300 | $1.00 | 43d | 1 | 1.33mi |
| 629 Morgan Ave Akron, OH | 2.0 | 1.0 | 960 | $1,200 | $1.25 | 43d | 1 | 1.35mi |
| 907 Kling St Akron, OH | 3.0 | 1.0 | 1248 | $1,250 | $1.00 | 14d | 1 | 1.42mi |
| 902 Cole Ave Akron, OH | 3.0 | 1.0 | 984 | $1,050 | $1.07 | 14d | 1 | 1.42mi |
| 1078 Lindsay Ave Akron, OH | 3.0 | 2.0 | 1005 | $1,350 | $1.34 | 43d | 1 | 1.45mi |
| 885 Brown St Akron, OH | 4.0 | 2.0 | 1280 | $1,400 | $1.09 | 23d | 1 | 1.45mi |
Listing history 21 events
-
2026-06-17status $139,500 Pending 32 DOM
-
2026-06-17days on market $139,500 Contingent 32 DOM
-
2026-06-16days on market $139,500 Contingent 31 DOM
-
2026-06-15days on market $139,500 Contingent 30 DOM
-
2026-06-14days on market $139,500 Contingent 28 DOM
-
2026-06-13days on market $139,500 Contingent 27 DOM
-
2026-06-10days on market $139,500 Contingent 25 DOM
-
2026-06-09days on market $139,500 Contingent 24 DOM
-
2026-06-08days on market $139,500 Contingent 23 DOM
-
2026-06-07days on market $139,500 Contingent 22 DOM
-
2026-06-05days on market $139,500 Contingent 19 DOM
-
2026-06-03days on market $139,500 Contingent 18 DOM
-
2026-06-02days on market $139,500 Contingent 17 DOM
-
2026-06-01days on market $139,500 Contingent 16 DOM
-
2026-05-31days on market $139,500 Contingent 15 DOM
-
2026-05-31days on market $139,500 Contingent 14 DOM
-
2026-05-17historical Contingent
-
2026-05-16$139,500 Active
-
1992-09-22soldstatus $69,900
-
1992-06-01$69,900
-
1984-03-20soldstatus $33,000
ⓘ Source: listings_history table (triggers on properties + properties_extension) + one-shot
backfill from property_details.listing_events for pre-trigger history.
Tax reassessment forecast OH · Partial reset (capped growth)
- Current annual tax
- $2,797 · $233/mo
- Projected year-2 tax
- $2,797 · $233/mo
- Expected delta
- $0/yr ($0/mo · 0.0%)
ⓘ Screening estimate from a state-policy table — verify with the county assessor before closing.
Climate risk First Street
- Flood 1/10 Low FEMA zone X (unshaded) · 0% chance over 30 yrs
- Wildfire 1/10 Low
- Heat 3/10 Moderate 7 d/yr ≥96°F today · 17 d/yr by 30 yrs out
- Wind 1/10 Low
- Air quality 2/10 Low 1 unhealthy d/yr today · 2 by 30 yrs out
Nearby sold comps map
Loading sold comps map…
Walkable amenities ~0.75 mi
Loading nearby amenities…
Taxation est. · year 1
- Rental income
- $15,562
- − Mortgage interest
- −$7,814
- − Property taxes
- −$2,797
- − Insurance
- −$698
- − Repairs & maintenance
- −$1,245
- − Management
- −$1,245
- − Depreciation
- −$4,058
- Taxable loss
- −$2,295
- Est. tax savings @ 24.0%
- +$551
- After-tax cash flow
- $572/yr
For passive investors: Depreciation is non-cash, so a rental often shows a tax loss while cash-flowing — sheltering income. Rental losses are passive: they offset passive income freely, and up to $25,000/yr can offset ordinary (W-2) income if you actively participate and your MAGI is under $100k (phasing out to $0 by $150k); unused losses carry forward. On sale, claimed depreciation is recaptured at up to 25%, and gains may owe capital-gains tax (a 1031 exchange can defer both). Figures are a year-1 estimate at your 24.0% rate — not tax advice; consult a CPA.
Schools (NCES district)
- District
- Akron City
- NCES district ID
- 3904348
- Math proficiency
- 22% ▼ -17.00%
- Reading proficiency
- 30% ▼ -12.00%
- Median HH income
- $33,811
- Composite
- 21.31/100
- National rank
- #8383
- State rank
- #602 of 656 in OH
Livability — Akron
- Score
- 81/100
- State rank
- #104
- US rank
- #1591
Category grades
Schools grade is shown separately in the Schools card above.
Census & demographics
- Census place
- Akron, OH
- County
- Summit County · 440,783 people
- City population
- 174,375
- Metro
- Akron, OH
- Population (ZIP)
- 13,668
- Household income
- $51,321
- Rent vs Own
- Severe rent burden
- 446.0
Population outlook (Summit County) Hauer SSP2
- Today (2025)
- 546,583 people
- By 2030
- 544,028 · -0.5%
- By 2040
- 531,363 · -2.8%
- By 2050
- 514,923 · -5.8%
- By 2075
- 481,765 · -11.9%
- By 2100
- 432,265 · -20.9%
Race, ethnicity, and origin ACS 2023
- Neighborhood character
- Diverse neighborhood (Simpson 0.63)
- Race & ethnicity
- White 52% Black 30% Two or more races 11% Hispanic / Latino 5% Asian 2%
- Hispanic origin (detail)
- Mexican 3%
- Common ancestry
- Romanian 4% Lithuanian 2% Serbian 1%
- Foreign-born
- 6% · Canada
- Languages at home
- 92% English-only · Spanish 4% Other Indo-European 1% Other Asian/Pacific 1%
Political lean MEDSL · Summit
- 2024 margin
- Lean D (+7.0) · D 53.0% · R 46.0%
- 2008→2024 swing
- -9.6pp toward R · 2008: 16.6pp · 2024: 7.0pp
- All cycles
- 2024: D+7.0 2020: D+9.6 2016: D+8.2 2012: D+14.8 2008: D+16.6
Not yet ingested
- Civics
- —
Market trends
- HPI YoY
- ▼ -74.09%
- Current HPI
- 213.697
- Rent YoY
- ▲ 4.62%
- Metro
- Akron, OH
- State GDP YoY
- ▲ 1.98%
- F500 in state
- 48
Industry mix (Fortune 500 HQ in OH)
| Industry | F500 HQs | Revenue |
|---|---|---|
| Insurance | 3 | $145B |
|
||
| Industrial Machinery | 3 | $49B |
|
||
| Financial Services | 3 | $24B |
|
||
| Consumer Goods | 2 | $93B |
|
||
| Aerospace / Defense | 2 | $47B |
|
||
| Utilities | 2 | $33B |
|
||
Price history
+322.7% since first listed5 events — show timeline
- 2026-05-17 Contingent — MLSNOW
- 2026-05-16 Listed $139,500 MLSNOW
- 1992-09-22 Sold (Public Records) $69,900 Public Records
- 1992-06-01 Listed $69,900 MLSNOW
- 1984-03-20 Sold (Public Records) $33,000 Public Records
Property tax history
+3.1%/yrLatest (2025): $2,797 · +0.2% YoY. Source: county tax records.
Cash-flow waterfall
monthlySold comps — $/sqft
last 12 mo · ≤1 miLoading sold comps…