None · Orlando, FL
Flood risk 6/10 · Moderate
- FEMA flood zone
- X (shaded)
- Chance of flooding over 30 yrs
- 0.75%
- Est. flood insurance / yr
- $507 – $1,088
Fire risk 3/10 · Minor
- Est. fire insurance / yr
- $947 – $1,759
Heat risk 8/10 · Major
- Hot days now (above 108°F)
- 7 days/yr
- Hot days in 30 yrs
- 22 days/yr
Wind risk 9/10 · Severe
- Chance of severe wind over 30 yrs
- 99.0%
Air-quality risk 1/10 · Minimal
- Unhealthy air days now
- 0 days/yr
- Unhealthy air days in 30 yrs
- 0 days/yr
Risk factors via First Street. Map © Google.
Why this score? — see what drove the C- grade
The composite is a weighted blend of 9 inputs, each scored 0–100. Each bar is that input's sub-score; the figure is the points it added to the 100-point composite (weight × sub-score).
- ARV discount +15.0/15.0
- Cash flow +14.2/30.0
- DSCR +4.3/10.0
- Livability +4.3/5.0
- 1% rule +4.2/10.0
- Schools +4.1/10.0
- Rent growth +2.5/5.0
- Condition / age +2.5/5.0
- Appreciation +0.0/10.0
$224,000
🖨 Deal sheet (PDF) 📄 Offer letter ✓ Due diligence
Listing remarks
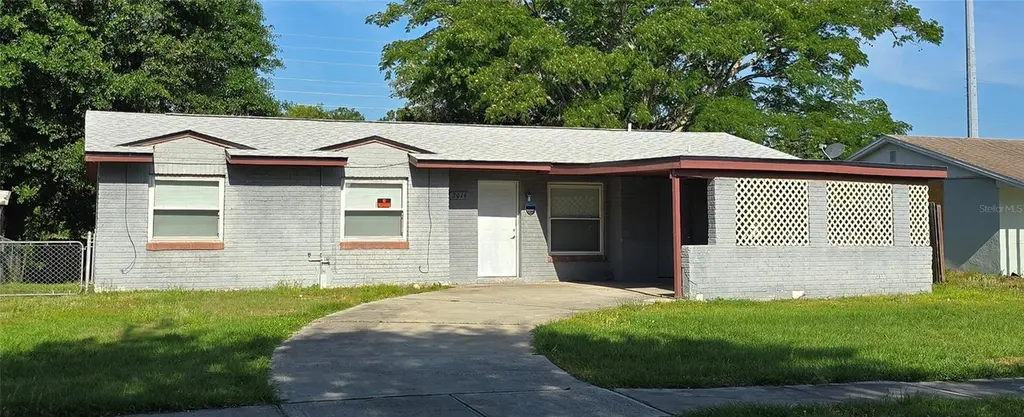
5 bedrooms and ready to move in or rent out * * * new roof in 2024 * * * seller financing available * * * home warranty * * * carport * * * replumbed recently, attic insulated, granite tops. Owner is listing Broker and Realtor * * * All offers to be on FAR/BAR As-Is and within 10K of Listing price to be considered and responded to. Offers to include $3000 escrow deposit and pre-approval or proof of funds. 5 day max inspection period. Please read all attachments for more info.
Key facts
- Carport
- New roof
- 6,673 sq ft lot
Tags
Property features AI
Finance
- Other: Zoning: R-1
- HOA & community: No association indicated
Exterior
- Parking: Covered parking; Driveway; 1-car carport
- Utilities: Public water; Canal/lake irrigation water source; Public sewer (connected); Electricity available and connected; Cable connected
- Home design: Single-family residence; One story; Facing east; Property in city limits, paved access
- Construction: Block and stucco construction; Shingle roof; Slab foundation; Completed property
- Exterior features: Covered patio/porch; Outdoor lighting; Private mailbox; Chain link fence; Trees/landscaped
Interior
- Kitchen: Disposal; Range hood; Refrigerator
- Bedrooms: 5 bedrooms
- Flooring: Ceramic tile
- Bathrooms: 2 full bathrooms
- Heating & cooling: Central heating (electric); Central air conditioning
- Interior features: Ceiling fans; Living room/dining room combo; Solid surface counters; Solid wood cabinets; Thermostat; Blinds
- Laundry & utility: Inside laundry room with washer hookup
Neighborhood map
What this means for you Summary
Snapshot
- This is a 4-bed/2.0-bath single-family listed at $224k.
Deal economics
- At list price, monthly cash flow is $36 ($428/yr) — positive.
- The deal already cash-flows at list — no discount required.
- To meet the 1% rule (rent ≥ 1% of price), the offer needs to be $206k (8.3% below list).
- Recommended offer: $206k (8.3% below list) — sets the bar for 1% rule.
- Cap rate 6.5% vs local median 3.0% in Orlando — top-decile yield for the area; either an underpriced asset or a hidden risk that comps aren't pricing in. Stress-test before assuming the spread holds.
Location & tenants
- Location reads 86/100 on livability (#12 in FL, #360 nationally) — a professional / high-income tenant draw. Strengths: amenities A+, commute A+, housing A+.
- Orange (suburban): math 46% / reading 51% proficiency, ranked #43 of 73 in FL (top 59%) — families likely to look elsewhere, expect single-tenant / working-renter base with shorter leases.
- Zoned schools: Eccleston Elementary (math 22% / reading 28%, grade F, #2,030 of 2,144 statewide, top 95%, 357 students, 87% FRL); Carver Middle (math 29% / reading 27%, grade F, #486 of 571 statewide, top 86%, 721 students, 79% FRL); Oak Ridge High (math 17% / reading 27%, grade F, #544 of 667 statewide, top 82%, 2,477 students, 66% FRL) — zoned schools average 77% FRL vs 56% district-wide (21 pts higher); higher-poverty schools than district average — tighter screening recommended.
- Zoned-school proficiency averages 25% at this address vs 48% district-wide (-24 pts) — the specific schools serving this property underperform the Orange average; the district grade overstates school quality for this exact location.
- Market conditions: Rents flat; 241 active listings in the ZIP; 40 comparable units currently listed for rent nearby; rentals leasing fast (median 12d on market — plan ~1-2 weeks tenant-placement turnaround); 8,053 units permitted in Orange County in 2024 (3,133 in 5+ unit buildings).
- At $2,055/mo this rent would consume 46% of the median local household income ($54k/yr) (locally 2728% of renters already pay >50% of income on rent) — very limited rent-growth headroom before tenants either downsize or default.
Forward outlook
- Local home prices are declining (-3.0%/yr); year-one equity from $2k of loan paydown is wiped out by about $7k of value loss. Plan a longer hold.
- Orange County population projected at +52% by 2050 — long-run rental-demand tailwind backs the buy-and-hold thesis.
Negotiation context
- It's been on market 50 days — a 3% lower offer ($217k) is reasonable based on typical stale-listing flexibility.
- 3 sale attempts with the ask held roughly flat each time — persistent listings suggest the price (not the market) is what's stuck; bring a comps-based counter.
- Current owner paid $63k; list at $224k implies a 256% gain — meaningful room to come down on a strong offer.
Risks & watch-outs
- Climate carrying-cost: major flood risk; severe wind risk, 99% chance of damaging wind over 30y; extreme-heat days projected 7→22/yr by 2055 (HVAC capex compounding) — expect insurance premiums to compound above CPI over the hold.
Questions for the listing agent
- It's been on market 50 days. Have you received any prior offers? Is the seller open to a 8% concession, seller financing, or rate buy-down credit?
- Built in 1970 — when were the roof, HVAC, electrical panel, plumbing, and water heater last replaced?
- Is there a deadline driving the sale (1031 exchange, divorce, estate, relocation)? That informs how much negotiation room exists.
- Schools are B-rated — typically a magnet for longer-tenancy family renters. What's the average tenant stay here, and is there a school-zone premium baked into asking?
- What's the average days-on-market for RENTAL listings here right now (not sales)? A rising rental-DOM trend means longer vacancies and softer asking-rent achievability than the comps imply.
- What's the recent tenant-quality profile in this submarket — average credit score on applications, eviction rate, late-payment / NSF rate, and stable-employment percentage? A property-management company in the area should have these aggregated.
- How much new for-sale + rental construction is in the pipeline within 1–3 miles? Heavy new supply typically softens prices + rents 12–24 months out; constrained supply supports both.
Investment metrics
- 1% rule
- 0.92% ✗
- Cap rate
- 6.48%
- Cash-on-cash
- 0.68%
- DSCR
- 1.03
- GRM
- 9.1
CMA / ARV
- ARV (on-the-fly)
- $279,552
- Comps found
- 9
Show comp detail 9 sales within ~0.75 mi
| Address | Dist | Beds/Ba | Sqft | Sold | Price | $/sf | Match |
|---|---|---|---|---|---|---|---|
| 1834 Willie Mays Pkwy | 0.26mi | 3/2.0 (-1) | 1,235 (-1%) | 10mo | $276,900 | $224 | 73 |
| 4568 Kirkland Blvd | 0.31mi | 4/1.5 | 1,230 (-1%) | 23mo | $275,000 | $224 | 62 |
| 4749 Marbello Blvd | 0.42mi | 4/1.5 | 1,344 (+8%) | 12mo | $270,000 | $201 | 56 |
| 2703 Messina Ave | 0.31mi | 4/2.0 | 1,400 (+12%) | 21mo | $299,000 | $214 | 47 |
| 1229 Lescot Ln | 0.57mi | 4/2.0 | 1,104 (-12%) | 9mo | $259,000 | $235 | 47 |
| 1410 Heber Cir | 0.48mi | 3/2.0 (-1) | 1,092 (-12%) | 24mo | $279,000 | $255 | 32 |
| 5283 Lanette St | 0.68mi | 4/2.0 | 1,400 (+12%) | 22mo | $289,900 | $207 | 30 |
| 4752 Amoy Ct | 0.60mi | 3/1.5 (-1) | 1,104 (-12%) | 20mo | $196,000 | $178 | 30 |
| 1623 Crestlawn Ave | 0.72mi | 3/1.0 (-1) | 1,074 (-14%) | 11mo | $245,000 | $228 | 25 |
Match score weights: distance 35% · size 25% · config 20% · recency 20%. Top-matched comps best support the ARV.
Projected returns pro-forma
-3.0% appreciation · 0.15% rent growth · sell at horizon
- IRR
- -18.5%
- Equity multiple
- 0.37×
- Total profit
- $-39,701
- Equity at exit
- $33,399
- IRR
- -18.1%
- Equity multiple
- 0.14×
- Total profit
- $-53,630
- Equity at exit
- $19,367
Cash invested: $62,720 (down + closing). Projections, not guarantees.
Landlord ↔ Tenant lean methodology
- Overall (STATE)
- 87 Strongly Landlord-Friendly
- State Florida
- 87 Strongly Landlord-Friendly · R+3
- County
- — inherits STATE
- City
- — inherits STATE
ZIP-level market 32811
- Home prices YoY
- -33.8%
- Rents YoY
- 0.1%
- Active inventory
- 241
- Price-to-rent
- 9.1×
Monthly cashflow live
- Estimated rent
- $2,055 high interval (Pro) →
- Mortgage (P&I)
- −$1,175
- Tax from tax record
- −$320 /mo · $3,837/yr
- Insurance
- −$93
- HOA
- −$0
- Vacancy / Maint / Mgmt
- −$432
- Net cashflow
- $36
Break-even live
Sensitivity live
| Price | -10% $162 | -5% $99 | +0% $36 | +5% $-28 | +10% $-91 |
|---|---|---|---|---|---|
| Rent | -10% $-127 | -5% $-46 | +0% $36 | +5% $117 | +10% $198 |
| Rate | -1.0pp $148 | -0.5pp $93 | base $36 | +0.5pp $-22 | +1.0pp $-81 |
UW: 25.0% down · 7.5% · 30yr · 1.5% tax · 5.0% vac · 8.0% maint · 8.0% mgmt
Financing live
Cash to close
- Down payment
- $56,000
- Closing costs
- $6,720
- Reserves months
- —
- Total cash needed
- —
Loan-product check · same deal, 3 products live
Conventional
25% down · 7.5% · 30yr
- Down + closing
- —
- Monthly P&I
- —
- Monthly cashflow
- —
- DSCR
- —
- Eligible?
- —
Personal DTI + credit; lowest rate.
DSCR
20% down · 8.5% · 30yr
- Down + closing
- —
- Monthly P&I
- —
- Monthly cashflow
- —
- DSCR
- —
- Eligible?
- —
No personal income docs; deal must DSCR.
Hard money
10% down · 12.0% · 12mo
- Down + closing
- —
- Monthly P&I
- —
- Monthly cashflow
- —
- DSCR
- —
- Eligible?
- —
Short-term bridge; refi at stabilization.
Rent comps 40 comps
| Address | Beds | Baths | Sqft | Rent | $/sqft | DOM | Units | Dist |
|---|---|---|---|---|---|---|---|---|
| 1920 Willie Mays Pkwy Orlando, FL | 4.0 | 2.0 | 1446 | $2,070 | $1.43 | 22d | 1 | 0.25mi |
| 4655 Cepeda St Orlando, FL | 3.0 | 1.5 | 1266 | $1,695 | $1.34 | 25d | 1 | 0.38mi |
| 4487 Wheatley St Orlando, FL | 4.0 | 2.0 | 1249 | $1,950 | $1.56 | 22d | 1 | 0.43mi |
| 2151 S Ivey Ln Orlando, FL | 3.0 | 1.5 | 1080 | $1,993 | $1.85 | 6d | 1 | 0.50mi |
| 1343 Croyle Dr Orlando, FL | 4.0 | 2.0 | 1273 | $1,900 | $1.49 | 25d | 1 | 0.53mi |
| 5300 Lescot Ln Orlando, FL | 3.0 | 2.0 | 1143 | $1,900 | $1.66 | 25d | 1 | 0.65mi |
| 5132 Elese St Orlando, FL | 3.0 | 2.0 | 960 | $1,800 | $1.88 | 18d | 1 | 0.66mi |
| 1822 Horne Ave Orlando, FL | 3.0 | 1.0 | 1249 | $1,600 | $1.28 | 25d | 1 | 0.70mi |
| 5179 Lanette St Orlando, FL | 4.0 | 1.5 | 1104 | $1,895 | $1.72 | 0d | 1 | 0.75mi |
| 4226 Kelly Miller Ct Orlando, FL | 3.0 | 1.0 | 1126 | $1,950 | $1.73 | 25d | 1 | 0.80mi |
| 4201 Cepeda St Orlando, FL | 4.0 | 2.0 | 1500 | $1,800 | $1.20 | 25d | 1 | 0.80mi |
| 5235 Florida Holly Dr Orlando, FL | 3.0 | 2.0 | 1107 | $2,100 | $1.90 | 25d | 1 | 0.86mi |
| 1025 Clovercrest Rd Orlando, FL | 3.0 | 2.0 | 1050 | $2,100 | $2.00 | 19d | 1 | 0.92mi |
| 1025 Clovercrest Rd Orlando, FL | 3.0 | 2.0 | 1050 | $2,100 | $2.00 | 25d | 1 | 0.92mi |
| 4529 W Gore Ave Orlando, FL | 3.0 | 2.0 | 1439 | $2,549 | $1.77 | 22d | 1 | 0.93mi |
| 4118 Minoso St Orlando, FL | 3.0 | 1.0 | 1213 | $1,820 | $1.50 | 0d | 1 | 0.97mi |
| 1935 S Kirkman Rd Orlando, FL | 1.0–3.0 | 1.0–2.0 | 1020 | $2,150 | $2.11 | 0d | 11 | 0.99mi |
| 4957 Vista Lago Dr Orlando, FL | 4.0 | 2.0 | 1364 | $2,203 | $1.62 | 0d | 1 | 1.01mi |
| 5578 Metrowest Blvd Orlando, FL | 1.0–3.0 | 1.0–2.0 | 1101 | $1,800 | $1.63 | 5d | 2 | 1.04mi |
| 5578 Metrowest Blvd Orlando, FL | 1.0–3.0 | 1.0–2.0 | 1101 | $1,800 | $1.63 | 6d | 3 | 1.04mi |
| 5578 Metrowest Blvd Orlando, FL | 1.0–3.0 | 1.0–2.0 | 1101 | $1,800 | $1.63 | 12d | 2 | 1.04mi |
| 5578 Metrowest Blvd #203 Orlando, FL | 3.0 | 2.0 | 1362 | $1,800 | $1.32 | 9d | 1 | 1.04mi |
| 1401 S Kirkman Rd Orlando, FL | 1.0–3.0 | 1.0–2.0 | 917 | $2,272 | $2.48 | 0d | 32 | 1.05mi |
| 4638 America St Orlando, FL | 5.0 | 1.0 | 1500 | $1,700 | $1.13 | 16d | 1 | 1.06mi |
| 701 S Ivey Ln Orlando, FL | 2.0–3.0 | 1.0 | 871 | $1,329 | $1.53 | 25d | 1 | 1.08mi |
| 1601 S Kirkman Rd Orlando, FL | 1.0–3.0 | 1.0–2.0 | 876 | $1,976 | $2.26 | 0d | 23 | 1.09mi |
| 907 S Kirkman Rd Orlando, FL | 2.0–4.0 | 2.0 | 1131 | $1,871 | $1.65 | 0d | 16 | 1.16mi |
| 3313 S Kirkman Rd Orlando, FL | 3.0 | 2.0 | 1431 | $1,745 | $1.22 | 4d | 2 | 1.18mi |
| 3313 S Kirkman Rd Orlando, FL | 3.0 | 2.0 | 1431 | $1,745 | $1.22 | 5d | 2 | 1.18mi |
| 5036 College Dr Orlando, FL | 3.0 | 1.0 | 1500 | $1,800 | $1.20 | 25d | 1 | 1.20mi |
| 3361 S Kirkman Rd Orlando, FL | 2.0–4.0 | 2.0 | 1411 | $2,450 | $1.74 | 25d | 2 | 1.22mi |
| 3301 S Kirkman Rd Orlando, FL | 1.0–4.0 | 1.0–2.0 | 1288 | $2,534 | $1.97 | 0d | 20 | 1.23mi |
| 5425 Wood Crossing St Orlando, FL | 4.0 | 2.0 | 1300 | $2,200 | $1.69 | 6d | 1 | 1.23mi |
| 3397 S Kirkman Rd #1418 Orlando, FL | 3.0 | 2.0 | 1431 | $1,995 | $1.39 | 25d | 1 | 1.26mi |
| 4995 Mercer St Orlando, FL | 3.0 | 2.0 | 1386 | $2,500 | $1.80 | 4d | 1 | 1.34mi |
| 4822 Cason Cove Dr Orlando, FL | 1.0–3.0 | 1.0–2.0 | 884 | $2,199 | $2.49 | 4d | 9 | 1.35mi |
| 4700 Cason Cove Dr Orlando, FL | 1.0–4.0 | 1.0–2.0 | 1002 | $2,499 | $2.49 | 5d | 12 | 1.35mi |
| 6141 Metrowest Blvd Orlando, FL | 3.0 | 2.0 | 1285 | $1,772 | $1.38 | 9d | 2 | 1.44mi |
| 431 Gilman Cir Orlando, FL | 3.0 | 2.0 | 1146 | $1,626 | $1.42 | 16d | 1 | 1.45mi |
| 4803 Normandy Pl Orlando, FL | 3.0 | 2.0 | 1262 | $1,800 | $1.43 | 5d | 1 | 1.49mi |
Listing history 26 events
-
2026-06-21remarks 504-char remark
-
2026-06-21pricedays on market $224,000 Active 50 DOM
-
2026-06-18days on market $226,000 Active 47 DOM
-
2026-06-17days on market $226,000 Active 46 DOM
-
2026-06-16days on market $226,000 Active 45 DOM
-
2026-06-15days on market $226,000 Active 44 DOM
-
2026-06-13days on market $226,000 Active 42 DOM
-
2026-06-13days on market $226,000 Active 41 DOM
-
2026-06-09pricedays on market $226,000 Active 38 DOM
-
2026-06-08days on market $229,000 Active 37 DOM
-
2026-06-07days on market $229,000 Active 36 DOM
-
2026-06-04days on market $229,000 Active 33 DOM
-
2026-06-03days on market $229,000 Active 32 DOM
-
2026-06-02days on market $229,000 Active 31 DOM
-
2026-06-02days on market $229,000 Active 30 DOM
-
2026-05-31days on market $229,000 Active 29 DOM
-
2026-05-22status Active
-
2026-05-22price $229,000
-
2026-04-30status Pending
-
2026-04-14status Active
-
2026-04-14price $232,000
-
2026-04-08status Pending
-
2026-04-03$230,000 Active
-
2004-12-06soldstatus $63,000
-
2000-01-14soldstatus $55,000
-
1995-05-12soldstatus $30,600
ⓘ Source: listings_history table (triggers on properties + properties_extension) + one-shot
backfill from property_details.listing_events for pre-trigger history.
Tax reassessment forecast FL · Resets to sale price
- Current annual tax
- $3,837 · $320/mo
- Projected year-2 tax
- $3,837 · $320/mo
- Expected delta
- $0/yr ($0/mo · 0.0%)
ⓘ Screening estimate from a state-policy table — verify with the county assessor before closing.
Climate risk First Street
- Flood 6/10 Major FEMA zone X (shaded) · 75% chance over 30 yrs
- Wildfire 3/10 Moderate
- Heat 8/10 Severe 7 d/yr ≥108°F today · 22 d/yr by 30 yrs out
- Wind 9/10 Extreme 99% chance of damaging wind over 30 yrs
- Air quality 1/10 Low 0 unhealthy d/yr today · 0 by 30 yrs out
Nearby sold comps map
Loading sold comps map…
Walkable amenities ~0.75 mi
Loading nearby amenities…
Taxation est. · year 1
- Rental income
- $24,660
- − Mortgage interest
- −$12,547
- − Property taxes
- −$3,837
- − Insurance
- −$1,120
- − Repairs & maintenance
- −$1,973
- − Management
- −$1,973
- − Depreciation
- −$6,516
- Taxable loss
- −$3,307
- Est. tax savings @ 24.0%
- +$794
- After-tax cash flow
- $1,221/yr
For passive investors: Depreciation is non-cash, so a rental often shows a tax loss while cash-flowing — sheltering income. Rental losses are passive: they offset passive income freely, and up to $25,000/yr can offset ordinary (W-2) income if you actively participate and your MAGI is under $100k (phasing out to $0 by $150k); unused losses carry forward. On sale, claimed depreciation is recaptured at up to 25%, and gains may owe capital-gains tax (a 1031 exchange can defer both). Figures are a year-1 estimate at your 24.0% rate — not tax advice; consult a CPA.
Schools (NCES district)
- District
- Orange
- NCES district ID
- 1201440
- Math proficiency
- 46% ▼ -9.00%
- Reading proficiency
- 51% ▼ -2.00%
- Median HH income
- $49,350
- Composite
- 41.47/100
- National rank
- #3461
- State rank
- #43 of 73 in FL
Livability — Orlando
- Score
- 86/100
- State rank
- #12
- US rank
- #360
Category grades
Schools grade is shown separately in the Schools card above.
Census & demographics
- Census place
- Orlando, FL
- County
- Orange County · 1,471,359 people
- City population
- 964,969
- Metro
- Orlando-Kissimmee-Sanford, FL
- Population (ZIP)
- 41,475
- Household income
- $54,082
- Rent vs Own
- Severe rent burden
- 2728.0
Population outlook (Orange County) Hauer SSP2
- Today (2025)
- 1,618,226 people
- By 2030
- 1,787,404 · +10.5%
- By 2040
- 2,125,621 · +31.4%
- By 2050
- 2,454,016 · +51.6%
- By 2075
- 3,173,711 · +96.1%
- By 2100
- 3,607,781 · +122.9%
Race, ethnicity, and origin ACS 2023
- Neighborhood character
- Diverse neighborhood (Simpson 0.66)
- Race & ethnicity
- Black 50% Hispanic / Latino 27% Two or more races 17% White 12% Asian 2%
- Hispanic origin (detail)
- Mexican 2% Puerto Rican 8% Dominican 2%
- Common ancestry
- Hispanic 7% Estonian 4% Russian 1%
- Foreign-born
- 31% · Canada, Jamaica, China
- Languages at home
- 62% English-only · Spanish 21% French/Haitian/Cajun 8% Other Indo-European 6%
Political lean MEDSL · Orange
- 2024 margin
- D (+13.6) · D 56.1% · R 42.5% · Other 1.3%
- 2008→2024 swing
- -5.0pp toward R · 2008: 18.6pp · 2024: 13.6pp
- All cycles
- 2024: D+13.6 2020: D+23.1 2016: D+24.6 2012: D+18.2 2008: D+18.6
Not yet ingested
- Civics
- —
Market trends
- HPI YoY
- ▼ -145.37%
- Current HPI
- 284.9191
- Rent YoY
- ▲ 0.15%
- Metro
- Orlando-Kissimmee-Sanford, FL
- State GDP YoY
- ▲ 3.28%
- F500 in state
- 36
Industry mix (Fortune 500 HQ in FL)
| Industry | F500 HQs | Revenue |
|---|---|---|
| Industrial Technology | 2 | $29B |
|
||
| Insurance | 2 | $17B |
|
||
| Retail | 1 | $60B |
|
||
| Technology Distribution | 1 | $58B |
|
||
| Homebuilding | 1 | $35B |
|
||
| Technology Manufacturing | 1 | $35B |
|
||
Price history
+648.4% since first listed10 events — show timeline
- 2026-05-22 Relisted — Stellar MLS as Distributed by MLS Grid
- 2026-05-22 Price Changed $229,000 Stellar MLS as Distributed by MLS Grid
- 2026-04-30 Pending — Stellar MLS as Distributed by MLS Grid
- 2026-04-14 Relisted — Stellar MLS as Distributed by MLS Grid
- 2026-04-14 Price Changed $232,000 Stellar MLS as Distributed by MLS Grid
- 2026-04-08 Pending — Stellar MLS as Distributed by MLS Grid
- 2026-04-03 Listed $230,000 Stellar MLS as Distributed by MLS Grid
- 2004-12-06 Sold (Public Records) $63,000 Public Records
- 2000-01-14 Sold (Public Records) $55,000 Public Records
- 1995-05-12 Sold (Public Records) $30,600 Public Records
Property tax history
+14.8%/yrLatest (2025): $3,837 · +49.6% YoY. Source: county tax records.
Cash-flow waterfall
monthlySold comps — $/sqft
last 12 mo · ≤1 miLoading sold comps…