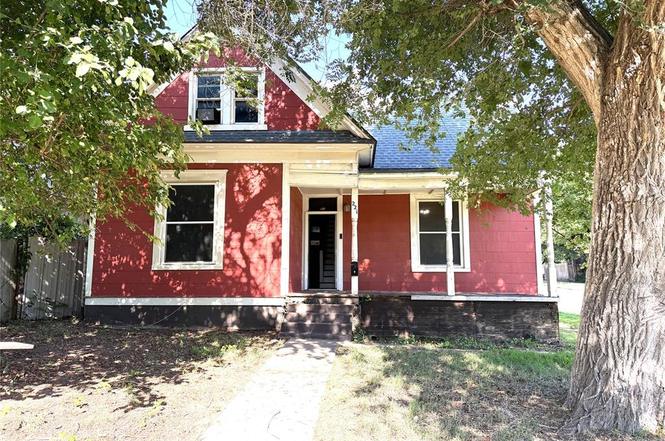
221 N Barker Ave · El Reno, OK
Flood risk 1/10 · Minimal
- FEMA flood zone
- X (unshaded)
- Chance of flooding over 30 yrs
- 0.0%
- Est. flood insurance / yr
- $507 – $1,088
Fire risk 3/10 · Minor
- Est. fire insurance / yr
- $2,463 – $4,575
Heat risk 6/10 · Moderate
- Hot days now (above 107°F)
- 7 days/yr
- Hot days in 30 yrs
- 19 days/yr
Wind risk 2/10 · Minimal
- Chance of severe wind over 30 yrs
- 2.0%
Air-quality risk 2/10 · Minimal
- Unhealthy air days now
- 1 days/yr
- Unhealthy air days in 30 yrs
- 2 days/yr
Risk factors via First Street. Map © Google.
Why this score? — see what drove the B- grade
The composite is a weighted blend of 9 inputs, each scored 0–100. Each bar is that input's sub-score; the figure is the points it added to the 100-point composite (weight × sub-score).
- Cash flow +25.8/30.0
- ARV discount +15.0/15.0
- DSCR +8.6/10.0
- 1% rule +6.1/10.0
- Rent growth +3.5/5.0
- Livability +3.4/5.0
- Condition / age +2.5/5.0
- Schools +1.2/10.0
- Appreciation +0.0/10.0
$134,900
🖨 Deal sheet 📄 Offer letter ✓ Due diligence
Listing remarks MLS
Back on market at no fault of the seller! PRICED BELOW RECENT APPRAISAL! You do not want to miss out on a chance to purchase a home and have instant equity! This cute home offers 4 bedrooms, 3 baths, a large corner lot, and a fun and unique floor plan!
Key facts
- Enclosed carport
- Extra room
- Covered back patio
Tags
Property features AI
Finance
- Other: Located on the southwest corner of Barker and E. Rogers; Located in El Reno Original Town
- Financial info: Sold as-is; Not assumable; Court approval may be required for sale
- HOA & community: No mandatory association dues
Exterior
- Parking: Backyard parking
- Home design: Two levels; Single-family residence; Residential property; Existing property
- Construction: Frame construction; Composition roof; Conventional foundation; Built prior to current listing (existing)
- Exterior features: Porch; Corner lot
Interior
- Bedrooms: 4 bedrooms
- Bathrooms: 3 full bathrooms
- Interior features: One living area; One dining area; No fireplace
Neighborhood map
What this means for you Summary
Snapshot
- This is a 3-bed/1.0-bath single-family listed at $135k.
Deal economics
- At list price, monthly cash flow is $326 ($4k/yr) — positive.
- The deal already cash-flows at list — no discount required.
- Meets the 1% rule at list price ($2k rent vs $135k).
- Cap rate 9.2% vs local median 4.8% in El Reno — top-decile yield for the area; either an underpriced asset or a hidden risk that comps aren't pricing in. Stress-test before assuming the spread holds.
Location & tenants
- Location reads 67/100 on livability (#95 in OK) — a middle-class / working-renter tenant base. Strengths: cost of living A+, housing A+, crime B+; Watch: health & safety C-, amenities F, commute F.
- El Reno (town): math 12% / reading 15% proficiency, ranked #232 of 270 in OK (top 86%) — low school quality limits family demand, transient renter base, plan for 1-2y turnover; 68% free/reduced lunch — lower-income household profile, screen leases tightly.
- Zoned schools: Rose Witcher Es (387 students, 0% FRL); El Reno Hs (math 16% / reading 19%, grade F, #307 of 447 statewide, top 69%, 980 students, 0% FRL) — zoned schools average 0% FRL vs 68% district-wide (68 pts lower); this property's tenant base skews higher-income than the district average.
- Market conditions: Rents rising fast (+4.2%/yr); 280 active listings in the ZIP; 4 comparable units currently listed for rent nearby; rentals leasing fast (median 2d on market — plan ~1-2 weeks tenant-placement turnaround); 260 units permitted in Canadian County in 2024 (0 in 5+ unit buildings).
- This rent runs 30% of the median local income ($60k/yr) — at the standard rent-burdened threshold; future hikes will face affordability resistance.
Forward outlook
- Local home prices are declining (-3.0%/yr); year-one equity from $933 of loan paydown is wiped out by about $4k of value loss. Plan a longer hold.
- Canadian County population projected at +64% by 2050 — long-run rental-demand tailwind backs the buy-and-hold thesis.
- At projected returns (-3.0% appreciation + 4.2% rent growth), your $38k cash investment doubles in ~10 years — after that, you're playing with house money.
Negotiation context
- Only 1 days on market — expect competitive offers; lowballing is unlikely to land.
- 7 sale attempts since 7y ago with the ask held roughly flat each time — persistent listings suggest the price (not the market) is what's stuck; bring a comps-based counter.
Risks & watch-outs
- Watch-outs: built in 1920 — expect roof / HVAC / electrical / plumbing capex.
- Climate carrying-cost: extreme-heat days projected 7→19/yr by 2055 (HVAC capex compounding) — expect insurance premiums to compound above CPI over the hold.
Questions for the listing agent
- Built in 1920 — when were the roof, HVAC, electrical panel, plumbing, and water heater last replaced?
- Is there a deadline driving the sale (1031 exchange, divorce, estate, relocation)? That informs how much negotiation room exists.
- Schools are F-rated, which usually means shorter tenancies and higher turnover. Who's the typical renter profile here, and what's been the actual vacancy rate?
- What's the average days-on-market for RENTAL listings here right now (not sales)? A rising rental-DOM trend means longer vacancies and softer asking-rent achievability than the comps imply.
- What's the recent tenant-quality profile in this submarket — average credit score on applications, eviction rate, late-payment / NSF rate, and stable-employment percentage? A property-management company in the area should have these aggregated.
- How much new for-sale + rental construction is in the pipeline within 1–3 miles? Heavy new supply typically softens prices + rents 12–24 months out; constrained supply supports both.
Investment metrics
- 1% rule
- 1.11% ✓
- Cap rate
- 9.19%
- Cash-on-cash
- 10.36%
- DSCR
- 1.46
- GRM
- 7.5
CMA / ARV
- ARV (on-the-fly)
- $195,994
- Comps found
- 7
Show comp detail 7 sales within ~0.75 mi
| Address | Dist | Beds/Ba | Sqft | Sold | Price | $/sf | Match |
|---|---|---|---|---|---|---|---|
| 202 S Barker Ave | 0.19mi | 3/2.5 | 2,214 (-3%) | 13mo | $229,000 | $103 | 70 |
| 301 S Barker Ave | 0.25mi | 4/2.0 (+1) | 2,254 (-1%) | 18mo | $220,000 | $98 | 62 |
| 312 E Wade St | 0.26mi | 2/2.0 (-1) | 2,004 (-12%) | 7mo | $172,500 | $86 | 53 |
| 620 S Macomb Ave | 0.48mi | 4/2.0 (+1) | 1,982 (-13%) | 3mo | $130,000 | $66 | 44 |
| 111 S Macomb Ave | 0.17mi | 4/2.0 (+1) | 1,940 (-15%) | 20mo | $117,000 | $60 | 41 |
| 610 S Hoff Ave | 0.47mi | 3/1.5 | 1,995 (-12%) | 23mo | $225,000 | $113 | 36 |
| 906 S Barker Ave | 0.64mi | 4/2.0 (+1) | 2,032 (-11%) | 22mo | $165,000 | $81 | 25 |
Match score weights: distance 35% · size 25% · config 20% · recency 20%. Top-matched comps best support the ARV.
Projected returns pro-forma
-3.0% appreciation · 4.19% rent growth · sell at horizon
- IRR
- 0.5%
- Equity multiple
- 1.02×
- Total profit
- $708
- Equity at exit
- $20,114
- IRR
- 11.2%
- Equity multiple
- 1.92×
- Total profit
- $34,921
- Equity at exit
- $11,664
Cash invested: $37,772 (down + closing). Projections, not guarantees.
Landlord ↔ Tenant lean methodology
- Overall (STATE)
- 83 Strongly Landlord-Friendly
- State Oklahoma
- 83 Strongly Landlord-Friendly · R+20
- County
- — inherits STATE
- City
- — inherits STATE
ZIP-level market 73036
- Home prices YoY
- -3.3%
- Rents YoY
- 4.2%
- Active inventory
- 280
- Price-to-rent
- 7.5×
Monthly cashflow live
- Estimated rent
- $1,501 medium interval (Pro) →
- Mortgage (P&I)
- −$707
- Tax from tax record
- −$96 /mo · $1,157/yr
- Insurance
- −$56
- HOA
- −$0
- Vacancy / Maint / Mgmt
- −$315
- Net cashflow
- $326
Break-even live
UW: 25.0% down · 7.5% · 30yr · 1.5% tax · 5.0% vac · 8.0% maint · 8.0% mgmt
Financing live
Cash to close
- Down payment
- $33,725
- Closing costs
- $4,047
- Reserves months
- —
- Total cash needed
- —
Loan-product check · same deal, 3 products live
Conventional
25% down · 7.5% · 30yr
- Down + closing
- —
- Monthly P&I
- —
- Monthly cashflow
- —
- DSCR
- —
- Eligible?
- —
Personal DTI + credit; lowest rate.
DSCR
20% down · 8.5% · 30yr
- Down + closing
- —
- Monthly P&I
- —
- Monthly cashflow
- —
- DSCR
- —
- Eligible?
- —
No personal income docs; deal must DSCR.
Hard money
10% down · 12.0% · 12mo
- Down + closing
- —
- Monthly P&I
- —
- Monthly cashflow
- —
- DSCR
- —
- Eligible?
- —
Short-term bridge; refi at stabilization.
Rent comps 4 comps
| Address | Beds | Baths | Sqft | Rent | $/sqft | DOM | Units | Dist |
|---|---|---|---|---|---|---|---|---|
| 605 W Clarke St El Reno, OK | 3.0 | 2.0 | 1768 | $1,395 | $0.79 | 1d | 1 | 0.46mi |
| 1031 S Ellison Ave El Reno, OK | 3.0 | 2.0 | 1601 | $1,500 | $0.94 | 1d | 1 | 1.05mi |
| 1109 S Ellison Ave El Reno, OK | 2.0 | 2.0 | 1595 | $1,360 | $0.85 | 1d | 1 | 1.13mi |
| 1802 S Dille Ave El Reno, OK | 4.0 | 2.0 | 2712 | $1,595 | $0.59 | 1d | 1 | 1.32mi |
Listing history 2 events
-
2026-06-17remarks 300-char remark
-
2026-06-17$134,900 Active 1 DOM
ⓘ Source: listings_history table (triggers on properties + properties_extension) + one-shot
backfill from property_details.listing_events for pre-trigger history.
Tax reassessment forecast OK · Resets to sale price
- Current annual tax
- $1,157 · $96/mo
- Projected year-2 tax
- $1,214 · $101/mo
- Expected delta
- +$57/yr (+$5/mo · 4.9%)
ⓘ Screening estimate from a state-policy table — verify with the county assessor before closing.
Climate risk First Street
- Flood 1/10 Low FEMA zone X (unshaded) · 0% chance over 30 yrs
- Wildfire 3/10 Moderate
- Heat 6/10 Major 7 d/yr ≥107°F today · 19 d/yr by 30 yrs out
- Wind 2/10 Low 2% chance of damaging wind over 30 yrs
- Air quality 2/10 Low 1 unhealthy d/yr today · 2 by 30 yrs out
Nearby sold comps map
Loading sold comps map…
Walkable amenities ~0.75 mi
Loading nearby amenities…
Taxation est. · year 1
- Rental income
- $18,018
- − Mortgage interest
- −$7,556
- − Property taxes
- −$1,157
- − Insurance
- −$674
- − Repairs & maintenance
- −$1,441
- − Management
- −$1,441
- − Depreciation
- −$3,924
- Taxable income
- $1,823
- Est. tax owed @ 24.0%
- −$437
- After-tax cash flow
- $3,476/yr
For passive investors: Depreciation is non-cash, so a rental often shows a tax loss while cash-flowing — sheltering income. Rental losses are passive: they offset passive income freely, and up to $25,000/yr can offset ordinary (W-2) income if you actively participate and your MAGI is under $100k (phasing out to $0 by $150k); unused losses carry forward. On sale, claimed depreciation is recaptured at up to 25%, and gains may owe capital-gains tax (a 1031 exchange can defer both). Figures are a year-1 estimate at your 24.0% rate — not tax advice; consult a CPA.
Schools (NCES district)
- District
- El Reno
- NCES district ID
- 4010650
- Math proficiency
- 12% ▼ -15.00%
- Reading proficiency
- 15% ▼ -9.00%
- Median HH income
- $44,689
- Composite
- 12.01/100
- National rank
- #9664
- State rank
- #232 of 270 in OK
Livability — El Reno
- Score
- 67/100
- State rank
- #95
- US rank
- #10933
Category grades
Schools grade is shown separately in the Schools card above.
Census & demographics
- Census place
- El Reno, OK
- County
- Canadian County · 154,341 people
- City population
- 21,387
- Metro
- Oklahoma City, OK
- Population (ZIP)
- 21,387
- Household income
- $59,915
- Rent vs Own
- Severe rent burden
- 580.0
Population outlook (Canadian County) Hauer SSP2
- Today (2025)
- 174,062 people
- By 2030
- 195,170 · +12.1%
- By 2040
- 239,293 · +37.5%
- By 2050
- 285,457 · +64.0%
- By 2075
- 403,766 · +132.0%
- By 2100
- 498,766 · +186.5%
Race, ethnicity, and origin ACS 2023
- Neighborhood character
- Predominantly White (65%)
- Race & ethnicity
- White 65% Hispanic / Latino 17% Two or more races 8% Native American 8% Black 6%
- Hispanic origin (detail)
- Mexican 14%
- Common ancestry
- Slovak 2% Serbian 2% Romanian 1%
- Foreign-born
- 5% · Canada
- Languages at home
- 89% English-only · Spanish 10%
Political lean MEDSL · Canadian
- 2024 margin
- Solid R (+40.4) · D 28.8% · R 69.2% · Other 2.0%
- 2008→2024 swing
- +11.9pp toward D · 2008: -52.2pp · 2024: -40.4pp
- All cycles
- 2024: R+40.4 2020: R+43.3 2016: R+51.2 2012: R+54.4 2008: R+52.2
Not yet ingested
- Civics
- —
Market trends
- HPI YoY
- ▼ -11.37%
- Current HPI
- 334.5896
- Rent YoY
- ▲ 4.19%
- Metro
- Oklahoma City, OK
- State GDP YoY
- ▲ 1.55%
- F500 in state
- 6
Industry mix (Fortune 500 HQ in OK)
| Industry | F500 HQs | Revenue |
|---|---|---|
| Energy | 3 | $48B |
|
||
Price history
-69.6% since first listed25 events — show timeline
- 2026-06-17 Listed $134,900 MLSOK
- 2023-01-03 Sold (Public Records) $150,000 Public Records
- 2022-12-23 Sold (MLS) $150,000 MLSOK
- 2022-11-21 Pending — MLSOK
- 2022-10-17 Relisted — MLSOK
- 2022-09-20 Pending — MLSOK
- 2022-09-09 Pending — MLSOK
- 2022-09-07 Listed $159,000 MLSOK
- 2022-09-01 Listing Removed — MLSOK
- 2022-08-30 Price Changed $159,000 MLSOK
- 2022-06-30 Listed $165,000 MLSOK
- 2022-06-10 Listing Removed — MLSOK
- 2022-03-02 Price Changed $165,000 MLSOK
- 2022-01-25 Price Changed $170,000 MLSOK
- 2022-01-12 Listed $180,000 MLSOK
- 2021-07-03 Listing Removed — MLSOK
- 2021-06-07 Listed $139,500 MLSOK
- 2020-01-16 Listing Removed — MLSOK
- 2019-12-14 Price Changed $105,000 MLSOK
- 2019-11-17 Price Changed $110,000 MLSOK
- 2019-11-11 Price Changed $111,000 MLSOK
- 2019-09-10 Price Changed $116,000 MLSOK
- 2019-08-12 Price Changed $119,000 MLSOK
- 2019-07-15 Listed $122,000 MLSOK
- 1986-10-01 Sold (Public Records) $444,000 Public Records
Property tax history
+7.8%/yrLatest (2025): $1,157 · -0.7% YoY. Source: county tax records.
Cash-flow waterfall
monthlySold comps — $/sqft
last 12 mo · ≤1 miLoading sold comps…