 Fourplex
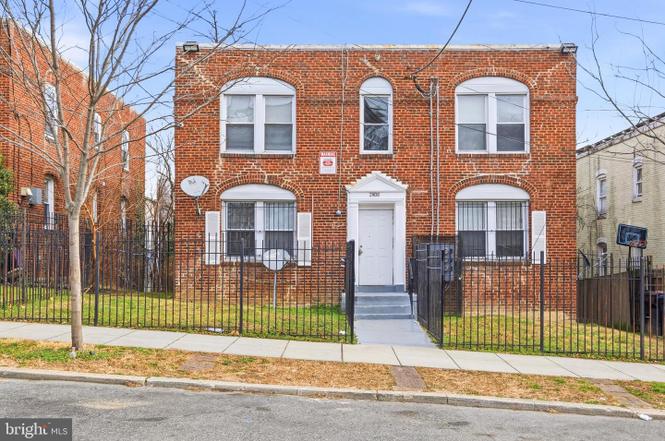
2808 Buena Vista Ter SE · Washington, DC
Flood risk 1/10 · Minimal
- FEMA flood zone
- X (unshaded)
- Chance of flooding over 30 yrs
- 0.0%
- Est. flood insurance / yr
- $473 – $860
Fire risk 1/10 · Minimal
- Est. fire insurance / yr
- $631 – $1,173
Heat risk 7/10 · Major
- Hot days now (above 103°F)
- 7 days/yr
- Hot days in 30 yrs
- 16 days/yr
Wind risk 4/10 · Minor
- Chance of severe wind over 30 yrs
- 20.0%
Air-quality risk 4/10 · Minor
- Unhealthy air days now
- 4 days/yr
- Unhealthy air days in 30 yrs
- 5 days/yr
Risk factors via First Street. Map © Google.
Why this score? — see what drove the D+ grade
The composite is a weighted blend of 9 inputs, each scored 0–100. Each bar is that input's sub-score; the figure is the points it added to the 100-point composite (weight × sub-score).
- Cash flow +22.6/30.0
- DSCR +7.2/10.0
- 1% rule +4.9/10.0
- Livability +3.7/5.0
- Schools +3.6/10.0
- Rent growth +3.5/5.0
- Condition / age +2.5/5.0
- ARV discount +0.0/15.0
- Appreciation +0.0/10.0
$799,000
🖨 Deal sheet 📄 Offer letter ✓ Due diligence
Multi-family units
County records classify this as Multi-Family (2-4 Unit). Listing-text estimate: 4 units. confirmed
Listing remarks MLS
Investor's Special! Wont last!! Cash/ Conv financing only. Fixer upper, need work. SOLD -AS- IS. .. Seller request to use NEXUS TITLE.
Key facts
- Multifamily property
- Convenient access
- Rental income
Tags
Property features AI
Finance
- Other: Total below-grade area 408; Above-grade finished area 2,652; Below-grade finished area 206; Below-grade unfinished area 202; Accessible features noted (other)
- Financial info: Yearly existing leases (where applicable)
Exterior
- Parking: On-street parking
- Utilities: Public water; Public sewer; Natural gas service
- Home design: Multi-unit property with 4 total units; Fee simple ownership
- Construction: Brick construction
- Exterior features: Above grade and below grade structures; No tidal water
Interior
- Kitchen: Disposal; Refrigerator; Stove
- Bedrooms: Four 3-bedroom units (multi-unit property)
- Heating & cooling: Radiant heating; Radiator heat; Natural gas hot water
- Interior features: Open floor plan; Galley kitchen; Basement (other)
- Laundry & utility: Stacked washer/dryer
Neighborhood map
What this means for you Summary
Snapshot
- This is a 4 × 3-bed/1.0-bath units multifamily listed at $799k.
Deal economics
- At list price, monthly cash flow is $1k ($16k/yr) — positive. Per door: $340/mo.
- The deal already cash-flows at list — no discount required.
- To meet the 1% rule (rent ≥ 1% of price), the offer needs to be $789k (1.2% below list).
- Recommended offer: $703k (12.0% below list) — sets the bar for market timing.
- Cap rate 8.3% vs local median 2.5% in Washington — top-decile yield for the area; either an underpriced asset or a hidden risk that comps aren't pricing in. Stress-test before assuming the spread holds.
Location & tenants
- Location reads 73/100 on livability (#1 in DC) — a middle-class / working-renter tenant base. Strengths: amenities A+, commute A+, employment A+; Watch: crime F, cost of living F.
- District Of Columbia Public Schools (urban): math 33% / reading 40% proficiency, ranked #8 of 32 in DC (top 25%) — families likely to look elsewhere, expect single-tenant / working-renter base with shorter leases; 65% free/reduced lunch — lower-income household profile, screen leases tightly.
- Market conditions: Rents rising (+3.9%/yr); 296 active listings in the ZIP; 19 comparable units currently listed for rent nearby; rentals at typical pace (median 24d on market — plan ~3-4 weeks tenant-placement turnaround); 1,737 units permitted in District of Columbia in 2024 (1,506 in 5+ unit buildings).
- At $7,894/mo this rent would consume 175% of the median local household income ($54k/yr) (locally 5148% of renters already pay >50% of income on rent) — very limited rent-growth headroom before tenants either downsize or default.
Forward outlook
- Local home prices are declining (-3.0%/yr); year-one equity from $6k of loan paydown is wiped out by about $24k of value loss. Plan a longer hold.
- District of Columbia County population projected at +50% by 2050 — long-run rental-demand tailwind backs the buy-and-hold thesis.
Negotiation context
- It's been on market 133 days — a 12% lower offer ($703k) is reasonable based on typical stale-listing flexibility.
- 13 sale attempts since 31y ago with the ask held roughly flat each time — persistent listings suggest the price (not the market) is what's stuck; bring a comps-based counter.
- Current owner paid $268k; list at $799k implies a 198% gain — meaningful room to come down on a strong offer.
Risks & watch-outs
- Watch-outs: built in 1943 — expect roof / HVAC / electrical / plumbing capex.
- Climate carrying-cost: extreme-heat days projected 7→16/yr by 2055 (HVAC capex compounding) — expect insurance premiums to compound above CPI over the hold.
Questions for the listing agent
- It's been on market 133 days. Have you received any prior offers? Is the seller open to a 12% concession, seller financing, or rate buy-down credit?
- Can we see the unit-by-unit rent roll, current vacancy, and any below-market leases? What's the average tenancy length?
- What capital expenditures (roof, boiler, parking lot, exteriors) have been made in the last 5 years, and what's planned in the next 2?
- Built in 1943 — when were the roof, HVAC, electrical panel, plumbing, and water heater last replaced?
- Why hasn't it sold? Are there any deal-killer items the seller is aware of (foundation, flood, title, zoning, code violations)?
- Is there a deadline driving the sale (1031 exchange, divorce, estate, relocation)? That informs how much negotiation room exists.
- Crime grade is F in this area — have there been break-ins, vandalism, or insurance claims at this property in the last 3 years? What carrier currently insures it and at what premium?
- The area grade is low — what's the realistic commute time and amenity access for the typical tenant pool here? Any planned neighborhood developments (good or bad) we should know about?
- What's the average days-on-market for RENTAL listings here right now (not sales)? A rising rental-DOM trend means longer vacancies and softer asking-rent achievability than the comps imply.
- What's the recent tenant-quality profile in this submarket — average credit score on applications, eviction rate, late-payment / NSF rate, and stable-employment percentage? A property-management company in the area should have these aggregated.
- How much new apartment / multifamily construction is in the pipeline within 1–3 miles? Heavy new supply (>2% of stock underway) typically softens rents 12–24 months out; light construction supports rent growth.
Investment metrics
- 1% rule
- 0.99% ✗
- Cap rate
- 8.33%
- Cash-on-cash
- 7.29%
- DSCR
- 1.32
- GRM
- 8.4
CMA / ARV
- ARV (on-the-fly)
- $633,828
- Comps found
- 4
Show comp detail 4 sales within ~0.75 mi
| Address | Dist | Beds/Ba | Sqft | Sold | Price | $/sf | Match |
|---|---|---|---|---|---|---|---|
| 2609 29th St SE | 0.21mi | 4/4.0 | 2,520 (-5%) | 5mo | $430,000 | $171 | 78 |
| 2726 Fort Baker Dr SE | 0.65mi | 5/— (+1) | 2,572 (-3%) | 4mo | $623,000 | $242 | 56 |
| 2722 Fort Baker Dr SE | 0.66mi | 5/— (+1) | 2,572 (-3%) | 14mo | $550,000 | $214 | 47 |
| 2719 Fort Baker Dr SE | 0.65mi | 5/3.0 (+1) | 2,804 (+6%) | 19mo | $670,000 | $239 | 35 |
Match score weights: distance 35% · size 25% · config 20% · recency 20%. Top-matched comps best support the ARV.
Projected returns pro-forma
-3.0% appreciation · 3.86% rent growth · sell at horizon
- IRR
- -4.3%
- Equity multiple
- 0.84×
- Total profit
- $-36,346
- Equity at exit
- $119,133
- IRR
- 6.2%
- Equity multiple
- 1.48×
- Total profit
- $107,396
- Equity at exit
- $69,083
Cash invested: $223,720 (down + closing). Projections, not guarantees.
Landlord ↔ Tenant lean methodology
- Overall (CITY)
- 0 Strongly Tenant-Friendly
- State District of Columbia
- 12 Strongly Tenant-Friendly · D+43
- County
- — inherits STATE
- City Washington
- 0 Strongly Tenant-Friendly · D+43
ZIP-level market 20020
- Rents YoY
- 3.9%
- Active inventory
- 296
- Price-to-rent
- 33.7×
Monthly cashflow live
- Estimated rent
- $7,894 high interval (Pro) →
- Mortgage (P&I)
- −$4,190
- Tax from tax record
- −$355 /mo · $4,259/yr
- Insurance
- −$333
- HOA
- −$0
- Vacancy / Maint / Mgmt
- −$1,658
- Net cashflow
- $1,358
Break-even live
4-unit breakdown (identical units grouped — click to expand)
| Units | Beds | Baths | Est. rent |
|---|---|---|---|
| 4× units | 3 | 1 | $7,892 |
| #1 | 3 | 1 | $1,973 |
| #2 | 3 | 1 | $1,973 |
| #3 | 3 | 1 | $1,973 |
| #4 | 3 | 1 | $1,973 |
| Total (4 units) | $7,894 | ||
UW: 25.0% down · 7.5% · 30yr · 1.5% tax · 5.0% vac · 8.0% maint · 8.0% mgmt
Financing live
Cash to close
- Down payment
- $199,750
- Closing costs
- $23,970
- Reserves months
- —
- Total cash needed
- —
Loan-product check · same deal, 3 products live
Conventional
25% down · 7.5% · 30yr
- Down + closing
- —
- Monthly P&I
- —
- Monthly cashflow
- —
- DSCR
- —
- Eligible?
- —
Personal DTI + credit; lowest rate.
DSCR
20% down · 8.5% · 30yr
- Down + closing
- —
- Monthly P&I
- —
- Monthly cashflow
- —
- DSCR
- —
- Eligible?
- —
No personal income docs; deal must DSCR.
Hard money
10% down · 12.0% · 12mo
- Down + closing
- —
- Monthly P&I
- —
- Monthly cashflow
- —
- DSCR
- —
- Eligible?
- —
Short-term bridge; refi at stabilization.
Rent comps 19 comps
| Address | Beds | Baths | Sqft | Rent | $/sqft | DOM | Units | Dist |
|---|---|---|---|---|---|---|---|---|
| 2612 33rd St SE Washington, DC | 3.0 | 3.0 | 1826 | $3,529 | $1.93 | 24d | 1 | 0.45mi |
| 1722 Gainesville St SE Washington, DC | 4.0 | 2.5 | 2000 | $3,490 | $1.75 | 24d | 1 | 0.64mi |
| 3010 V Pl SE Washington, DC | 4.0 | 3.0 | 2232 | $3,500 | $1.57 | 24d | 1 | 0.64mi |
| 2121 32nd Pl SE Unit Main Washington, DC | 3.0 | 3.0 | 3100 | $5,500 | $1.77 | 22d | 1 | 0.67mi |
| 2390 Elvans Rd SE Washington, DC | 3.0 | 2.5 | 2176 | $3,190 | $1.47 | 7d | 1 | 0.92mi |
| 1505 West St SE Unit 1 Washington, DC | 3.0 | 2.5 | 2100 | $3,300 | $1.57 | 2d | 1 | 1.00mi |
| 3422 Pennsylvania Ave SE Washington, DC | 5.0 | 2.5 | 2520 | $5,500 | $2.18 | 20d | 1 | 1.06mi |
| 1919 16th St SE Washington, DC | 3.0 | 1.5 | 1920 | $2,100 | $1.09 | 24d | 1 | 1.07mi |
| 1433 Howard Rd SE Washington, DC | 5.0 | 3.5 | 2000 | $7,500 | $3.75 | 19d | 1 | 1.12mi |
| 2520 Elvans Rd SE Washington, DC | 3.0 | 2.5 | 2760 | $3,800 | $1.38 | 24d | 1 | 1.18mi |
| 1325 Valley Pl SE Washington, DC | 4.0 | 2.0 | 2138 | $6,500 | $3.04 | 24d | 1 | 1.19mi |
| 2320 Minnesota Ave SE Washington, DC | 3.0 | 3.5 | 2052 | $3,150 | $1.54 | 24d | 1 | 1.19mi |
| 1516 18th St SE Washington, DC | 3.0 | 2.0 | 1941 | $3,200 | $1.65 | 24d | 1 | 1.21mi |
| 2530 Elvans Rd SE Unit B Washington, DC | 5.0 | 3.5 | 2760 | $7,500 | $2.72 | 7d | 1 | 1.23mi |
| 1802 14th St SE Washington, DC | 3.0 | 2.0 | 1800 | $2,800 | $1.56 | 24d | 1 | 1.23mi |
| 1205 30th St SE Washington, DC | 3.0 | 1.0 | 3480 | $1,750 | $0.50 | 24d | 1 | 1.34mi |
| 2913 Fairlawn St Temple Hills, MD | 5.0 | 2.0 | 2460 | $3,500 | $1.42 | 2d | 1 | 1.35mi |
| 2928 Nelson Pl SE Unit 1 Washington, DC | 3.0 | 1.0 | 2720 | $2,300 | $0.85 | 24d | 1 | 1.41mi |
| 2322 Shannon Pl SE Washington, DC | 3.0 | 3.5 | 1800 | $2,800 | $1.56 | 24d | 1 | 1.42mi |
Listing history 48 events
-
2026-06-18days on market $799,000 Active 133 DOM
-
2026-06-17days on market $799,000 Active 132 DOM
-
2026-06-16days on market $799,000 Active 131 DOM
-
2026-06-15days on market $799,000 Active 130 DOM
-
2026-06-13days on market $799,000 Active 128 DOM
-
2026-06-09days on market $799,000 Active 124 DOM
-
2026-06-08days on market $799,000 Active 123 DOM
-
2026-06-07days on market $799,000 Active 122 DOM
-
2026-06-04days on market $799,000 Active 119 DOM
-
2026-06-03days on market $799,000 Active 118 DOM
-
2026-06-02days on market $799,000 Active 117 DOM
-
2026-06-01days on market $799,000 Active 116 DOM
-
2026-05-31days on market $799,000 Active 115 DOM
-
2026-02-20status Active
-
2026-02-12historical Active Under Contract
-
2026-01-28$799,000 Active
-
2013-07-15soldstatus $267,900
-
2013-06-27historical 134-char remark
Show marketing remark (134 chars)
Investor's Special! Wont last!! Cash/ Conv financing only. Fixer upper, need work. SOLD -AS- IS. .. Seller request to use NEXUS TITLE.
-
2013-06-26soldstatus $267,900 Sold 134-char remark
Show marketing remark (134 chars)
Investor's Special! Wont last!! Cash/ Conv financing only. Fixer upper, need work. SOLD -AS- IS. .. Seller request to use NEXUS TITLE.
-
2013-06-26soldstatus $267,900 134-char remark
Show marketing remark (134 chars)
Investor's Special! Wont last!! Cash/ Conv financing only. Fixer upper, need work. SOLD -AS- IS. .. Seller request to use NEXUS TITLE.
-
2013-05-31status Contract 134-char remark
Show marketing remark (134 chars)
Investor's Special! Wont last!! Cash/ Conv financing only. Fixer upper, need work. SOLD -AS- IS. .. Seller request to use NEXUS TITLE.
-
2013-05-29historical 134-char remark
Show marketing remark (134 chars)
Investor's Special! Wont last!! Cash/ Conv financing only. Fixer upper, need work. SOLD -AS- IS. .. Seller request to use NEXUS TITLE.
-
2013-05-22$267,900 Active 134-char remark
Show marketing remark (134 chars)
Investor's Special! Wont last!! Cash/ Conv financing only. Fixer upper, need work. SOLD -AS- IS. .. Seller request to use NEXUS TITLE.
-
2013-05-22$267,900 134-char remark
Show marketing remark (134 chars)
Investor's Special! Wont last!! Cash/ Conv financing only. Fixer upper, need work. SOLD -AS- IS. .. Seller request to use NEXUS TITLE.
-
2010-05-11historical Temporarily Off-Market
-
2010-05-11historical
-
2010-05-03price
-
2010-04-07status Active
-
2010-04-01historical
-
2009-10-18price
-
2009-09-15Active
-
2009-09-15$300,000
-
2009-09-09historical
-
2009-09-09historical
-
2009-08-19price
-
2009-07-24status Active
-
2009-07-16historical
-
2009-04-22status
-
2009-04-22historical
-
2009-04-21price
-
2009-04-21status
-
2009-04-16historical
-
2009-01-13
-
2009-01-13$290,000
-
1995-09-07soldstatus $85,000
-
1995-08-31soldstatus $85,000
-
1995-07-17historical
-
1995-06-01$89,900
ⓘ Source: listings_history table (triggers on properties + properties_extension) + one-shot
backfill from property_details.listing_events for pre-trigger history.
Tax reassessment forecast DC · Partial reset (capped growth)
- Current annual tax
- $4,259 · $355/mo
- Projected year-2 tax
- $4,567 · $381/mo
- Expected delta
- +$307/yr (+$26/mo · 7.2%)
ⓘ Screening estimate from a state-policy table — verify with the county assessor before closing.
Climate risk First Street
- Flood 1/10 Low FEMA zone X (unshaded) · 0% chance over 30 yrs
- Wildfire 1/10 Low
- Heat 7/10 Severe 7 d/yr ≥103°F today · 16 d/yr by 30 yrs out
- Wind 4/10 Moderate 20% chance of damaging wind over 30 yrs
- Air quality 4/10 Moderate 4 unhealthy d/yr today · 5 by 30 yrs out
Nearby sold comps map
Loading sold comps map…
Walkable amenities ~0.75 mi
Loading nearby amenities…
Taxation est. · year 1
- Rental income
- $94,728
- − Mortgage interest
- −$44,756
- − Property taxes
- −$4,259
- − Insurance
- −$3,995
- − Repairs & maintenance
- −$7,578
- − Management
- −$7,578
- − Depreciation
- −$23,244
- Taxable income
- $3,317
- Est. tax owed @ 24.0%
- −$796
- After-tax cash flow
- $15,504/yr
For passive investors: Depreciation is non-cash, so a rental often shows a tax loss while cash-flowing — sheltering income. Rental losses are passive: they offset passive income freely, and up to $25,000/yr can offset ordinary (W-2) income if you actively participate and your MAGI is under $100k (phasing out to $0 by $150k); unused losses carry forward. On sale, claimed depreciation is recaptured at up to 25%, and gains may owe capital-gains tax (a 1031 exchange can defer both). Figures are a year-1 estimate at your 24.0% rate — not tax advice; consult a CPA.
Schools (NCES district)
- District
- District Of Columbia Public Schools
- NCES district ID
- 1100030
- Math proficiency
- 33% ▲ 3.00%
- Reading proficiency
- 40% ▲ 5.00%
- Median HH income
- $67,671
- Composite
- 35.84/100
- National rank
- #9606
- State rank
- #8 of 32 in DC
Livability — Washington
- Score
- 73/100
- State rank
- #1
- US rank
- #5327
Category grades
Schools grade is shown separately in the Schools card above.
Census & demographics
- Census place
- Washington, DC
- County
- District of Columbia · 671,873 people
- City population
- 671,873
- Metro
- Washington-Arlington-Alexandria, DC-VA-MD-WV
- Population (ZIP)
- 53,005
- Household income
- $54,032
- Rent vs Own
- Severe rent burden
- 5148.0
Population outlook (District of Columbia County) Hauer SSP2
- Today (2025)
- 821,926 people
- By 2030
- 899,517 · +9.4%
- By 2040
- 1,061,162 · +29.1%
- By 2050
- 1,231,493 · +49.8%
- By 2075
- 1,603,312 · +95.1%
- By 2100
- 1,847,141 · +124.7%
Race, ethnicity, and origin ACS 2023
- Neighborhood character
- Predominantly Black (90%)
- Race & ethnicity
- Black 90% Two or more races 3% Hispanic / Latino 3% White 3%
- Common ancestry
- Lithuanian 1%
- Foreign-born
- 3% · Canada
- Languages at home
- 95% English-only · Spanish 2% French/Haitian/Cajun 1%
Political lean MEDSL · District of Columbia
- 2024 margin
- Solid D (+86.1) · D 91.2% · R 5.1% · Other 3.8%
- 2008→2024 swing
- +0.1pp no change · 2008: 85.9pp · 2024: 86.1pp
- All cycles
- 2024: D+86.1 2020: D+86.8 2016: D+88.7 2012: D+84.2 2008: D+85.9
Not yet ingested
- Civics
- —
Market trends
- HPI YoY
- ▼ -415.44%
- Current HPI
- 306.5068
- Rent YoY
- ▲ 3.86%
- Metro
- Washington-Arlington-Alexandria, DC-VA-MD-WV
- State GDP YoY
- ▲ 1.33%
- F500 in state
- 6
Industry mix (Fortune 500 HQ in DC)
| Industry | F500 HQs | Revenue |
|---|---|---|
| Financial Services | 1 | $153B |
|
||
| Life Sciences / Industrials | 1 | $25B |
|
||
| Industrial Machinery | 1 | $8B |
|
||
Price history
+788.8% since first listed35 events — show timeline
- 2026-02-20 Relisted — BRIGHT MLS
- 2026-02-12 Contingent — BRIGHT MLS
- 2026-01-28 Listed $799,000 BRIGHT MLS
- 2013-07-15 Sold (Public Records) $267,900 Public Records
- 2013-06-27 Delisted — MRIS
- 2013-06-26 Sold (MLS) $267,900 BRIGHT MLS
- 2013-06-26 Sold (MLS) $267,900 MRIS
- 2013-05-31 Pending — MRIS
- 2013-05-29 Listing Removed — BRIGHT MLS
- 2013-05-22 Listed $267,900 MRIS
- 2013-05-22 Listed $267,900 BRIGHT MLS
- 2010-05-11 Delisted — MRIS
- 2010-05-11 Listing Removed — BRIGHT MLS
- 2010-05-03 Price Changed — MRIS
- 2010-04-07 Relisted — MRIS
- 2010-04-01 Delisted — MRIS
- 2009-10-18 Price Changed — MRIS
- 2009-09-15 Listed — MRIS
- 2009-09-15 Listed $300,000 BRIGHT MLS
- 2009-09-09 Delisted — MRIS
- 2009-09-09 Listing Removed — BRIGHT MLS
- 2009-08-19 Price Changed — MRIS
- 2009-07-24 Relisted — MRIS
- 2009-07-16 Delisted — MRIS
- 2009-04-22 Relisted — MRIS
- 2009-04-22 Delisted — MRIS
- 2009-04-21 Relisted — MRIS
- 2009-04-21 Price Changed — MRIS
- 2009-04-16 Delisted — MRIS
- 2009-01-13 Listed — MRIS
- 2009-01-13 Listed $290,000 BRIGHT MLS
- 1995-09-07 Sold (Public Records) $85,000 Public Records
- 1995-08-31 Sold (MLS) $85,000 MRIS
- 1995-07-17 Delisted — MRIS
- 1995-06-01 Listed $89,900 MRIS
Property tax history
+2.4%/yrLatest (2025): $4,259 · +1.9% YoY. Source: county tax records.
Cash-flow waterfall
monthlySold comps — $/sqft
last 12 mo · ≤1 miLoading sold comps…