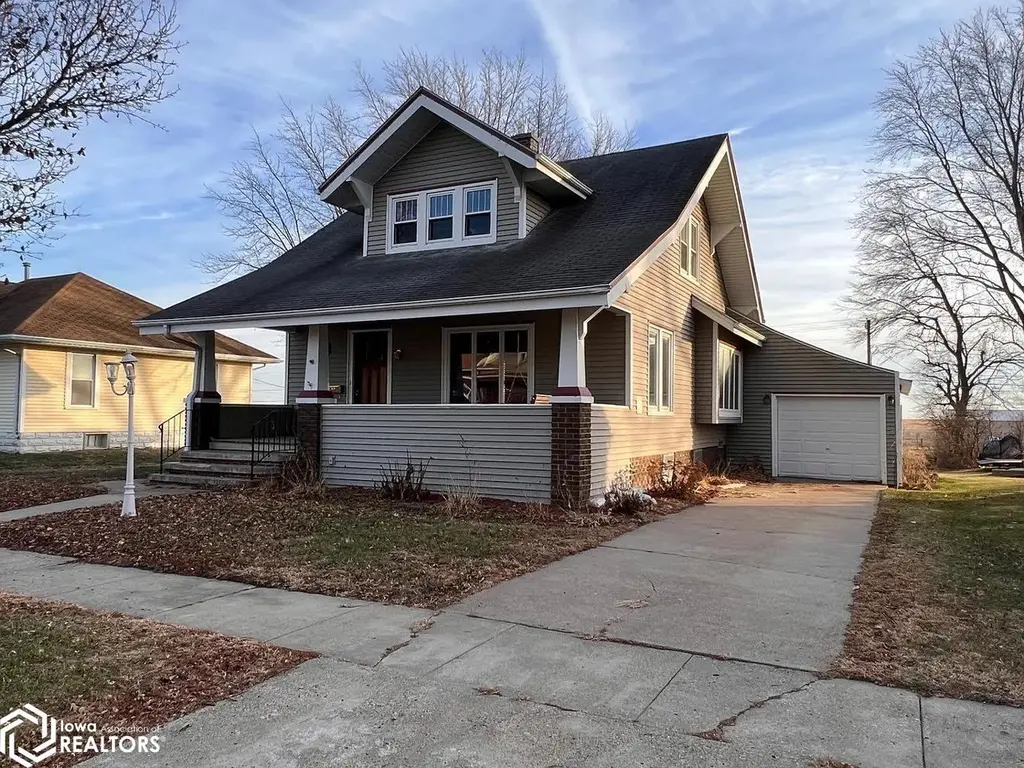
506 E Temple St · Lenox, IA
Flood risk 1/10 · Minimal
- FEMA flood zone
- X (unshaded)
- Chance of flooding over 30 yrs
- 0.0%
- Est. flood insurance / yr
- $473 – $860
Fire risk 2/10 · Minimal
- Est. fire insurance / yr
- $902 – $1,676
Heat risk 3/10 · Minor
- Hot days now (above 103°F)
- 7 days/yr
- Hot days in 30 yrs
- 15 days/yr
Wind risk 2/10 · Minimal
- Chance of severe wind over 30 yrs
- —
Air-quality risk 2/10 · Minimal
- Unhealthy air days now
- 0 days/yr
- Unhealthy air days in 30 yrs
- 1 days/yr
Risk factors via First Street. Map © Google.
Why this score? — see what drove the C- grade
The composite is a weighted blend of 9 inputs, each scored 0–100. Each bar is that input's sub-score; the figure is the points it added to the 100-point composite (weight × sub-score).
- ARV discount +15.0/15.0
- Cash flow +11.8/30.0
- Schools +5.9/10.0
- Appreciation +5.0/10.0
- Livability +4.0/5.0
- Condition / age +3.8/5.0
- DSCR +3.5/10.0
- 1% rule +3.4/10.0
- Rent growth +2.5/5.0
$145,000
🖨 Deal sheet 📄 Offer letter ✓ Due diligence
Listing remarks MLS
This charming four-bedroom, two-bathroom home offers 1,509 square feet of comfortable living space that perfectly blends classic character with modern updates. Step inside to discover beautiful original hardwood floors and woodwork throughout, complemented by a stunning staircase and elegant leaded glass windows that add timeless appeal. The updated kitchen provides a fresh, functional space for daily cooking and entertaining, while the renovated bathrooms offer modern comfort. Four bedrooms provide plenty of flexibility for family life, guests, or a home office setup. Outside, you'll find a covered front porch perfect for morning coffee or evening relaxation, plus a large back deck that's ideal for outdoor gatherings. The single car attached garage adds convenience and storage options. Located just down the street from Lenox City Park, outdoor recreation is practically at your doorstep. The home's classic features, like original hardwood and period details, create warmth and character while thoughtful updates ensure modern comfort. This property offers the perfect opportunity to enjoy small-town living with both charm and functionality in every corner. Give us a call today for additional information or to take a look! Price Reduced!
Key facts
- Covered front porch
- Renovated bathrooms
- Leaded glass windows
Tags
Neighborhood map
What this means for you Summary
Snapshot
- This is a 4-bed/2.0-bath single-family listed at $145k. Condition is rated good.
Deal economics
- At list price, monthly cash flow is $-40 ($-483/yr) — negative.
- To cash-flow at today's rent, offer at most $139k (4.0% below list).
- To meet the 1% rule (rent ≥ 1% of price), the offer needs to be $122k (16.0% below list).
- Recommended offer: $122k (16.0% below list) — sets the bar for 1% rule.
Location & tenants
- Location reads 79/100 on livability (#127 in IA, #2,338 nationally) — a middle-class / working-renter tenant base. Strengths: crime A+, cost of living A+, housing A+; Watch: amenities F, commute F.
- Lenox Community School District (rural): math 72% / reading 68% proficiency, ranked #157 of 289 in IA (top 54%) — strong family-tenant draw, lease renewals of 3-5y typical.
- Market conditions: 4 active listings in the ZIP; 4 units permitted in Taylor County in 2024 (0 in 5+ unit buildings).
Forward outlook
- In year one you build about $5k of equity ($1k loan paydown + $4k appreciation (3.0% local appreciation)).
- At projected returns (3.0% appreciation + 3.0% rent growth), your $41k cash investment doubles in ~7 years — after that, you're playing with house money.
- By year 7, paydown + projected appreciation supports a ~$34k cash-out refi (75% LTV) — recoverable capital for the next deal without selling this one.
Negotiation context
- It's been on market 132 days — a 12% lower offer ($128k) is reasonable based on typical stale-listing flexibility.
Risks & watch-outs
- Watch-outs: built in 1920 — expect roof / HVAC / electrical / plumbing capex.
Questions for the listing agent
- What do current leases actually rent for vs. the listed asking? Can we see a recent rent roll and the last 12 months of T-12 income?
- It's been on market 132 days. Have you received any prior offers? Is the seller open to a 16% concession, seller financing, or rate buy-down credit?
- Built in 1920 — when were the roof, HVAC, electrical panel, plumbing, and water heater last replaced?
- Why hasn't it sold? Are there any deal-killer items the seller is aware of (foundation, flood, title, zoning, code violations)?
- Is there a deadline driving the sale (1031 exchange, divorce, estate, relocation)? That informs how much negotiation room exists.
- Schools are B-rated — typically a magnet for longer-tenancy family renters. What's the average tenant stay here, and is there a school-zone premium baked into asking?
- What's the average days-on-market for RENTAL listings here right now (not sales)? A rising rental-DOM trend means longer vacancies and softer asking-rent achievability than the comps imply.
- What's the recent tenant-quality profile in this submarket — average credit score on applications, eviction rate, late-payment / NSF rate, and stable-employment percentage? A property-management company in the area should have these aggregated.
- How much new for-sale + rental construction is in the pipeline within 1–3 miles? Heavy new supply typically softens prices + rents 12–24 months out; constrained supply supports both.
Investment metrics
- 1% rule
- 0.84% ✗
- Cap rate
- 5.96%
- Cash-on-cash
- -1.19%
- DSCR
- 0.95
- GRM
- 9.9
CMA / ARV
- ARV (median comp)
- $200,824
- List price
- $145,000
- Delta
- -27.80%
- Verdict
- UNDERPRICED
- Comps
- 2 within 1.0 mi
Projected returns pro-forma
3.0% appreciation · 3.0% rent growth · sell at horizon
- IRR
- 6.4%
- Equity multiple
- 1.37×
- Total profit
- $14,924
- Equity at exit
- $65,198
- IRR
- 9.3%
- Equity multiple
- 2.40×
- Total profit
- $56,766
- Equity at exit
- $100,478
Cash invested: $40,600 (down + closing). Projections, not guarantees.
Landlord ↔ Tenant lean methodology
- Overall (STATE)
- 83 Strongly Landlord-Friendly
- State Iowa
- 83 Strongly Landlord-Friendly · R+6
- County
- — inherits STATE
- City
- — inherits STATE
ZIP-level market 50851
- Active inventory
- 4
- Price-to-rent
- 9.9×
Monthly cashflow live
- Estimated rent
- $1,218 medium interval (Pro) →
- Mortgage (P&I)
- −$760
- Tax est. 1.5%
- −$181 /mo · $2,175/yr
- Insurance
- −$60
- HOA
- −$0
- Vacancy / Maint / Mgmt
- −$256
- Net cashflow
- $-40
Break-even live
UW: 25.0% down · 7.5% · 30yr · 1.5% tax · 5.0% vac · 8.0% maint · 8.0% mgmt
Financing live
Cash to close
- Down payment
- $36,250
- Closing costs
- $4,350
- Reserves months
- —
- Total cash needed
- —
Loan-product check · same deal, 3 products live
Conventional
25% down · 7.5% · 30yr
- Down + closing
- —
- Monthly P&I
- —
- Monthly cashflow
- —
- DSCR
- —
- Eligible?
- —
Personal DTI + credit; lowest rate.
DSCR
20% down · 8.5% · 30yr
- Down + closing
- —
- Monthly P&I
- —
- Monthly cashflow
- —
- DSCR
- —
- Eligible?
- —
No personal income docs; deal must DSCR.
Hard money
10% down · 12.0% · 12mo
- Down + closing
- —
- Monthly P&I
- —
- Monthly cashflow
- —
- DSCR
- —
- Eligible?
- —
Short-term bridge; refi at stabilization.
Listing history 17 events
-
2026-06-18days on market $145,000 Active 132 DOM
-
2026-06-17days on market $145,000 Active 131 DOM
-
2026-06-16days on market $145,000 Active 130 DOM
-
2026-06-15days on market $145,000 Active 129 DOM
-
2026-06-13days on market $145,000 Active 127 DOM
-
2026-06-12days on market $145,000 Active 126 DOM
-
2026-06-09days on market $145,000 Active 123 DOM
-
2026-06-08days on market $145,000 Active 122 DOM
-
2026-06-07days on market $145,000 Active 121 DOM
-
2026-06-05days on market $145,000 Active 119 DOM
-
2026-06-04days on market $145,000 Active 117 DOM
-
2026-06-02days on market $145,000 Active 116 DOM
-
2026-06-01days on market $145,000 Active 115 DOM
-
2026-05-31days on market $145,000 Active 114 DOM
-
2026-05-31days on market $145,000 Active 113 DOM
-
2026-03-26price $145,000 1253-char remark
Show marketing remark (1253 chars)
This charming four-bedroom, two-bathroom home offers 1,509 square feet of comfortable living space that perfectly blends classic character with modern updates. Step inside to discover beautiful original hardwood floors and woodwork throughout, complemented by a stunning staircase and elegant leaded glass windows that add timeless appeal. The updated kitchen provides a fresh, functional space for daily cooking and entertaining, while the renovated bathrooms offer modern comfort. Four bedrooms provide plenty of flexibility for family life, guests, or a home office setup. Outside, you'll find a covered front porch perfect for morning coffee or evening relaxation, plus a large back deck that's ideal for outdoor gatherings. The single car attached garage adds convenience and storage options. Located just down the street from Lenox City Park, outdoor recreation is practically at your doorstep. The home's classic features, like original hardwood and period details, create warmth and character while thoughtful updates ensure modern comfort. This property offers the perfect opportunity to enjoy small-town living with both charm and functionality in every corner. Give us a call today for additional information or to take a look! Price Reduced!
-
2026-02-07$149,900 Active 1253-char remark
Show marketing remark (1253 chars)
This charming four-bedroom, two-bathroom home offers 1,509 square feet of comfortable living space that perfectly blends classic character with modern updates. Step inside to discover beautiful original hardwood floors and woodwork throughout, complemented by a stunning staircase and elegant leaded glass windows that add timeless appeal. The updated kitchen provides a fresh, functional space for daily cooking and entertaining, while the renovated bathrooms offer modern comfort. Four bedrooms provide plenty of flexibility for family life, guests, or a home office setup. Outside, you'll find a covered front porch perfect for morning coffee or evening relaxation, plus a large back deck that's ideal for outdoor gatherings. The single car attached garage adds convenience and storage options. Located just down the street from Lenox City Park, outdoor recreation is practically at your doorstep. The home's classic features, like original hardwood and period details, create warmth and character while thoughtful updates ensure modern comfort. This property offers the perfect opportunity to enjoy small-town living with both charm and functionality in every corner. Give us a call today for additional information or to take a look! Price Reduced!
ⓘ Source: listings_history table (triggers on properties + properties_extension) + one-shot
backfill from property_details.listing_events for pre-trigger history.
Climate risk First Street
- Flood 1/10 Low FEMA zone X (unshaded) · 0% chance over 30 yrs
- Wildfire 2/10 Low
- Heat 3/10 Moderate 7 d/yr ≥103°F today · 15 d/yr by 30 yrs out
- Wind 2/10 Low
- Air quality 2/10 Low 0 unhealthy d/yr today · 1 by 30 yrs out
Nearby sold comps map
Loading sold comps map…
Walkable amenities ~0.75 mi
Loading nearby amenities…
Taxation est. · year 1
- Rental income
- $14,610
- − Mortgage interest
- −$8,122
- − Property taxes
- −$2,175
- − Insurance
- −$725
- − Repairs & maintenance
- −$1,169
- − Management
- −$1,169
- − Depreciation
- −$4,218
- Taxable loss
- −$2,968
- Est. tax savings @ 24.0%
- +$712
- After-tax cash flow
- $230/yr
For passive investors: Depreciation is non-cash, so a rental often shows a tax loss while cash-flowing — sheltering income. Rental losses are passive: they offset passive income freely, and up to $25,000/yr can offset ordinary (W-2) income if you actively participate and your MAGI is under $100k (phasing out to $0 by $150k); unused losses carry forward. On sale, claimed depreciation is recaptured at up to 25%, and gains may owe capital-gains tax (a 1031 exchange can defer both). Figures are a year-1 estimate at your 24.0% rate — not tax advice; consult a CPA.
Condition & rehab AI · 12 photos
This charming four-bedroom home offers 1,509 square feet of comfortable living space with original hardwood floors and leaded glass windows. The updated kitchen and bathrooms provide modern comfort, and the covered porch and large back deck add to the home's appeal.
Value-add opportunities
- Resale paint exterior — enhances curb appeal
- Rental clean gutters — improves property maintenance
Renovation cost estimate screening
Value-add ROI direction
- Resale paint exterior — enhances curb appeal ↑
- Rental clean gutters — improves property maintenance ↑
ⓘ Cost ranges are severity-bucket heuristics (US national rule-of-thumb). Get contractor quotes + a written scope before underwriting a rehab budget.
Schools (NCES district)
- District
- Lenox Community School District
- NCES district ID
- 1916620
- Math proficiency
- 72% ▼ -5.00%
- Reading proficiency
- 68% ▼ -2.00%
- Median HH income
- $40,932
- Composite
- 58.52/100
- National rank
- #995
- State rank
- #157 of 289 in IA
Livability — Lenox
- Score
- 79/100
- State rank
- #127
- US rank
- #2338
Category grades
Schools grade is shown separately in the Schools card above.
Census & demographics
- Census place
- Lenox, IA
- Population (ZIP)
- 2,145
Population outlook (Taylor County) Hauer SSP2
- Today (2025)
- 6,143 people
- By 2030
- 6,100 · -0.7%
- By 2040
- 6,080 · -1.0%
- By 2050
- 6,146 · +0.0%
- By 2075
- 6,596 · +7.4%
- By 2100
- 6,954 · +13.2%
Race, ethnicity, and origin ACS 2023
- Neighborhood character
- Predominantly White (78%)
- Race & ethnicity
- White 78% Hispanic / Latino 18% Two or more races 8%
- Hispanic origin (detail)
- Mexican 15%
- Common ancestry
- Slovak 3% Iranian 2% Italian 1%
- Foreign-born
- 8% · Canada
- Languages at home
- 86% English-only · Spanish 14% German/W. Germanic 1%
Political lean MEDSL · Taylor
- 2024 margin
- Solid R (+55.7) · D 21.6% · R 77.4% · Other 1.0%
- 2008→2024 swing
- -47.1pp toward R · 2008: -8.6pp · 2024: -55.7pp
- All cycles
- 2024: R+55.7 2020: R+52.9 2016: R+45.1 2012: R+14.1 2008: R+8.6
Not yet ingested
- Civics
- —
Market trends
- HPI YoY
- —
- Current HPI
- —
- Rent YoY
- —
- Metro
- —
- State GDP YoY
- ▲ 2.48%
- F500 in state
- 4
Industry mix (Fortune 500 HQ in IA)
| Industry | F500 HQs | Revenue |
|---|---|---|
| Financial Services | 1 | $16B |
|
||
| Retail / Convenience | 1 | $15B |
|
||
Price history
-3.3% since first listed2 events — show timeline
- 2026-03-26 Price Changed $145,000 IAR
- 2026-02-07 Listed $149,900 IAR
Cash-flow waterfall
monthlySold comps — $/sqft
last 12 mo · ≤1 miLoading sold comps…