1336 Jones Rd · Abney Crossroads, SC
Flood risk 1/10 · Minimal
- FEMA flood zone
- X (unshaded)
- Chance of flooding over 30 yrs
- 0.0%
- Est. flood insurance / yr
- $507 – $1,088
Fire risk 5/10 · Moderate
- Est. fire insurance / yr
- $783 – $1,453
Heat risk 6/10 · Moderate
- Hot days now (above 106°F)
- 7 days/yr
- Hot days in 30 yrs
- 16 days/yr
Wind risk 6/10 · Moderate
- Chance of severe wind over 30 yrs
- 63.0%
Air-quality risk 2/10 · Minimal
- Unhealthy air days now
- 1 days/yr
- Unhealthy air days in 30 yrs
- 1 days/yr
Risk factors via First Street. Map © Google.
Why this score? — see what drove the B- grade
The composite is a weighted blend of 9 inputs, each scored 0–100. Each bar is that input's sub-score; the figure is the points it added to the 100-point composite (weight × sub-score).
- Cash flow +30.0/30.0
- 1% rule +10.0/10.0
- DSCR +10.0/10.0
- ARV discount +7.5/15.0
- Schools +3.8/10.0
- Rent growth +2.5/5.0
- Livability +2.5/5.0
- Condition / age +2.5/5.0
- Appreciation +0.0/10.0
$79,500
🖨 Deal sheet 📄 Offer letter ✓ Due diligence
Listing remarks
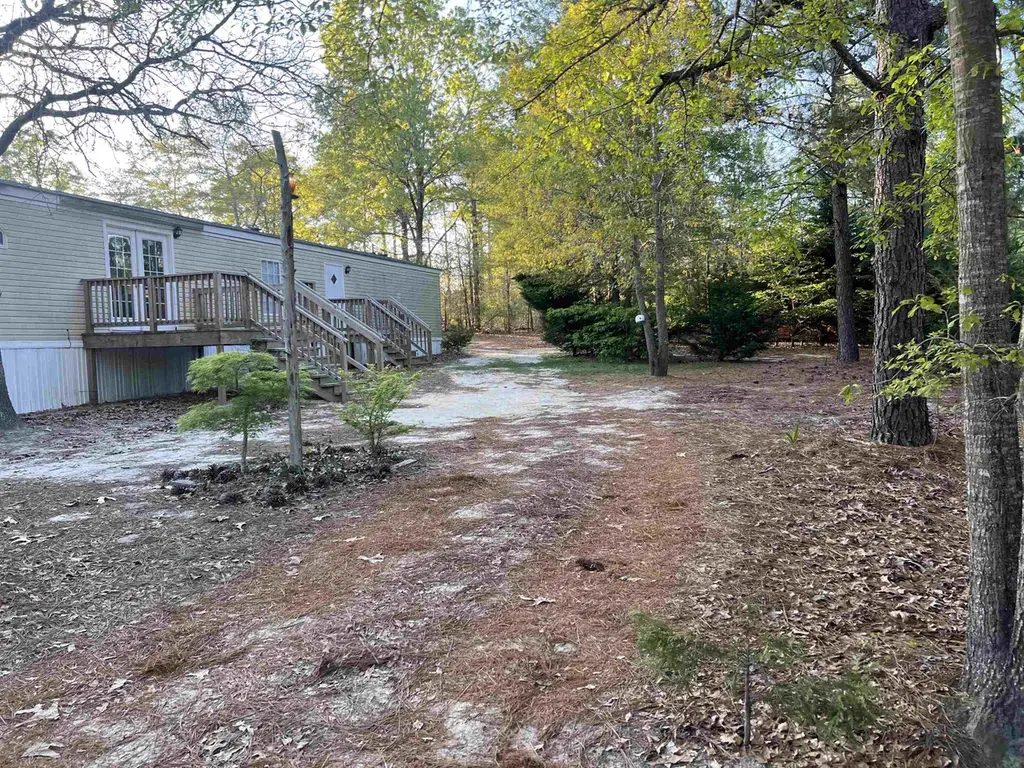
Nestled on approximately 1.37 acres in Lancaster County, this 3 bedroom, 2 bath manufactured home offers space, privacy, and a peaceful country setting in Kershaw, South Carolina. Featuring approximately 1,400 square feet, this home provides a comfortable layout with room to relax, entertain, garden, or enjoy the outdoors. The property offers a covered porch, storage shed, and plenty of open space for those looking for a little breathing room away from the hustle and bustle. Whether you are searching for a primary residence, investment opportunity, or quiet country retreat, 1336 Jones Road is full of potential and ready for its next chapter. Conveniently located near Kershaw with access to
Key facts
- Covered porch
- Open space
- Access to shopping
Tags
Property features AI
Finance
- Other: Zoned SFR
- HOA & community: Monthly association fee
Exterior
- Parking: Driveway parking; Space for about 6 vehicles
- Utilities: Electricity available; Septic available (septic tank)
- Home design: Double-wide mobile home; Resale property; Crawlspace foundation
- Construction: Vinyl siding
- Exterior features: Irregular lot; Lot approximately 1.37 acres (estimated)
Interior
- Kitchen: Pantry
- Flooring: Vinyl flooring
- Bathrooms: 2 full bathrooms
- Interior features: Bathtub; Ceiling fans; Unfurnished
- Laundry & utility: Washer hookup
Neighborhood map
What this means for you Summary
Snapshot
- This is a 3-bed/2.0-bath manufactured listed at $80k.
Deal economics
- At list price, monthly cash flow is $423 ($5k/yr) — positive.
- The deal already cash-flows at list — no discount required.
- Meets the 1% rule at list price ($1k rent vs $80k).
- Recommended offer: $78k (1.5% below list) — sets the bar for market timing.
Location & tenants
- Location reads: area grade B — affects rentability + tenant quality, not the cash-flow math above.
- Kershaw 01 (rural): math 38% / reading 51% proficiency, ranked #25 of 80 in SC (top 31%) — families likely to look elsewhere, expect single-tenant / working-renter base with shorter leases.
- Market conditions: 45 active listings in the ZIP; 491 units permitted in Kershaw County in 2024 (0 in 5+ unit buildings).
Forward outlook
- Local home prices are declining (-3.0%/yr); year-one equity from $550 of loan paydown is wiped out by about $2k of value loss. Plan a longer hold.
- Kershaw County population projected at +8% by 2050 — modest demand growth; plan on rents tracking national, not racing it.
- At projected returns (-3.0% appreciation + 3.0% rent growth), your $22k cash investment doubles in ~6 years — after that, you're playing with house money.
Negotiation context
- It's been on market 28 days — a 2% lower offer ($78k) is reasonable based on typical stale-listing flexibility.
- Current owner paid $8k; list at $80k implies a 894% gain — meaningful room to come down on a strong offer.
Risks & watch-outs
- Climate carrying-cost: major wind risk, 63% chance of damaging wind over 30y; moderate wildfire risk; extreme-heat days projected 7→16/yr by 2055 (HVAC capex compounding) — expect insurance premiums to compound above CPI over the hold.
Questions for the listing agent
- Is there a deadline driving the sale (1031 exchange, divorce, estate, relocation)? That informs how much negotiation room exists.
- What's the average days-on-market for RENTAL listings here right now (not sales)? A rising rental-DOM trend means longer vacancies and softer asking-rent achievability than the comps imply.
- What's the recent tenant-quality profile in this submarket — average credit score on applications, eviction rate, late-payment / NSF rate, and stable-employment percentage? A property-management company in the area should have these aggregated.
- How much new for-sale + rental construction is in the pipeline within 1–3 miles? Heavy new supply typically softens prices + rents 12–24 months out; constrained supply supports both.
Investment metrics
- 1% rule
- 1.51% ✓
- Cap rate
- 12.68%
- Cash-on-cash
- 22.80%
- DSCR
- 2.01
- GRM
- 5.5
CMA / ARV
No comps found within radius.
Projected returns pro-forma
-3.0% appreciation · 3.0% rent growth · sell at horizon
- IRR
- 15.7%
- Equity multiple
- 1.63×
- Total profit
- $14,057
- Equity at exit
- $11,854
- IRR
- 24.4%
- Equity multiple
- 3.11×
- Total profit
- $46,939
- Equity at exit
- $6,874
Cash invested: $22,260 (down + closing). Projections, not guarantees.
Landlord ↔ Tenant lean methodology
- Overall (STATE)
- 90 Strongly Landlord-Friendly
- State South Carolina
- 90 Strongly Landlord-Friendly · R+6
- County
- — inherits STATE
- City
- — inherits STATE
ZIP-level market 29067
- Home prices YoY
- -26.4%
- Active inventory
- 45
- Price-to-rent
- 5.5×
Monthly cashflow live
- Estimated rent
- $1,201 medium interval (Pro) →
- Mortgage (P&I)
- −$417
- Tax from tax record
- −$76 /mo · $906/yr
- Insurance
- −$33
- HOA
- −$0
- Vacancy / Maint / Mgmt
- −$252
- Net cashflow
- $423
Break-even live
UW: 25.0% down · 7.5% · 30yr · 1.5% tax · 5.0% vac · 8.0% maint · 8.0% mgmt
Financing live
Cash to close
- Down payment
- $19,875
- Closing costs
- $2,385
- Reserves months
- —
- Total cash needed
- —
Loan-product check · same deal, 3 products live
Conventional
25% down · 7.5% · 30yr
- Down + closing
- —
- Monthly P&I
- —
- Monthly cashflow
- —
- DSCR
- —
- Eligible?
- —
Personal DTI + credit; lowest rate.
DSCR
20% down · 8.5% · 30yr
- Down + closing
- —
- Monthly P&I
- —
- Monthly cashflow
- —
- DSCR
- —
- Eligible?
- —
No personal income docs; deal must DSCR.
Hard money
10% down · 12.0% · 12mo
- Down + closing
- —
- Monthly P&I
- —
- Monthly cashflow
- —
- DSCR
- —
- Eligible?
- —
Short-term bridge; refi at stabilization.
Listing history 9 events
-
2026-06-07statusdays on market $79,500 Pending 28 DOM
-
2026-06-05days on market $79,500 Active Under Contract 27 DOM
-
2026-06-03days on market $79,500 Active Under Contract 26 DOM
-
2026-06-03days on market $79,500 Active Under Contract 25 DOM
-
2026-06-02days on market $79,500 Active Under Contract 24 DOM
-
2026-05-31days on market $79,500 Active Under Contract 23 DOM
-
2026-05-17historical Active Under Contract
-
2026-05-08$79,500 Active
-
2012-11-13soldstatus $8,000
ⓘ Source: listings_history table (triggers on properties + properties_extension) + one-shot
backfill from property_details.listing_events for pre-trigger history.
Tax reassessment forecast SC · Resets to sale price
- Current annual tax
- $906 · $76/mo
- Projected year-2 tax
- $906 · $76/mo
- Expected delta
- $0/yr ($0/mo · 0.0%)
ⓘ Screening estimate from a state-policy table — verify with the county assessor before closing.
Climate risk First Street
- Flood 1/10 Low FEMA zone X (unshaded) · 0% chance over 30 yrs
- Wildfire 5/10 Major
- Heat 6/10 Major 7 d/yr ≥106°F today · 16 d/yr by 30 yrs out
- Wind 6/10 Major 63% chance of damaging wind over 30 yrs
- Air quality 2/10 Low 1 unhealthy d/yr today · 1 by 30 yrs out
Nearby sold comps map
Loading sold comps map…
Walkable amenities ~0.75 mi
Loading nearby amenities…
Taxation est. · year 1
- Rental income
- $14,407
- − Mortgage interest
- −$4,453
- − Property taxes
- −$906
- − Insurance
- −$398
- − Repairs & maintenance
- −$1,153
- − Management
- −$1,153
- − Depreciation
- −$2,313
- Taxable income
- $4,032
- Est. tax owed @ 24.0%
- −$968
- After-tax cash flow
- $4,107/yr
For passive investors: Depreciation is non-cash, so a rental often shows a tax loss while cash-flowing — sheltering income. Rental losses are passive: they offset passive income freely, and up to $25,000/yr can offset ordinary (W-2) income if you actively participate and your MAGI is under $100k (phasing out to $0 by $150k); unused losses carry forward. On sale, claimed depreciation is recaptured at up to 25%, and gains may owe capital-gains tax (a 1031 exchange can defer both). Figures are a year-1 estimate at your 24.0% rate — not tax advice; consult a CPA.
Schools (NCES district)
- District
- Kershaw 01
- NCES district ID
- 4502550
- Math proficiency
- 38% ▼ -7.00%
- Reading proficiency
- 51% ▲ 6.00%
- Median HH income
- $44,585
- Composite
- 37.66/100
- National rank
- #4371
- State rank
- #25 of 80 in SC
Livability — Abney Crossroads
No livability data for this city. (Only ~50 U.S. cities are tracked.)
Census & demographics
- Population (ZIP)
- 11,498
Population outlook (Kershaw County) Hauer SSP2
- Today (2025)
- 67,683 people
- By 2030
- 69,374 · +2.5%
- By 2040
- 71,936 · +6.3%
- By 2050
- 73,292 · +8.3%
- By 2075
- 75,762 · +11.9%
- By 2100
- 72,620 · +7.3%
Race, ethnicity, and origin ACS 2023
- Neighborhood character
- Predominantly White (69%)
- Race & ethnicity
- White 69% Black 23% Two or more races 7%
- Common ancestry
- Serbian 2% Italian 2% Slovak 1%
- Foreign-born
- 1% · China, Canada
- Languages at home
- 99% English-only · Spanish 1%
Political lean MEDSL · Kershaw
- 2024 margin
- Strong R (+28.2) · D 35.3% · R 63.5% · Other 1.2%
- 2008→2024 swing
- -9.5pp toward R · 2008: -18.7pp · 2024: -28.2pp
- All cycles
- 2024: R+28.2 2020: R+23.1 2016: R+24.8 2012: R+18.6 2008: R+18.7
Not yet ingested
- Civics
- —
Market trends
- HPI YoY
- ▼ -86.89%
- Current HPI
- 242.178
- Rent YoY
- —
- Metro
- —
- State GDP YoY
- ▲ 4.51%
- F500 in state
- 2
Industry mix (Fortune 500 HQ in SC)
| Industry | F500 HQs | Revenue |
|---|---|---|
| Packaging | 1 | $7B |
|
||
Price history
+893.8% since first listed3 events — show timeline
- 2026-05-17 Contingent — CCAR
- 2026-05-08 Listed $79,500 CCAR
- 2012-11-13 Sold (Public Records) $8,000 Public Records
Property tax history
+22.3%/yrLatest (2025): $906 · +6.3% YoY. Source: county tax records.
Cash-flow waterfall
monthlySold comps — $/sqft
last 12 mo · ≤1 miLoading sold comps…