 Multi-family
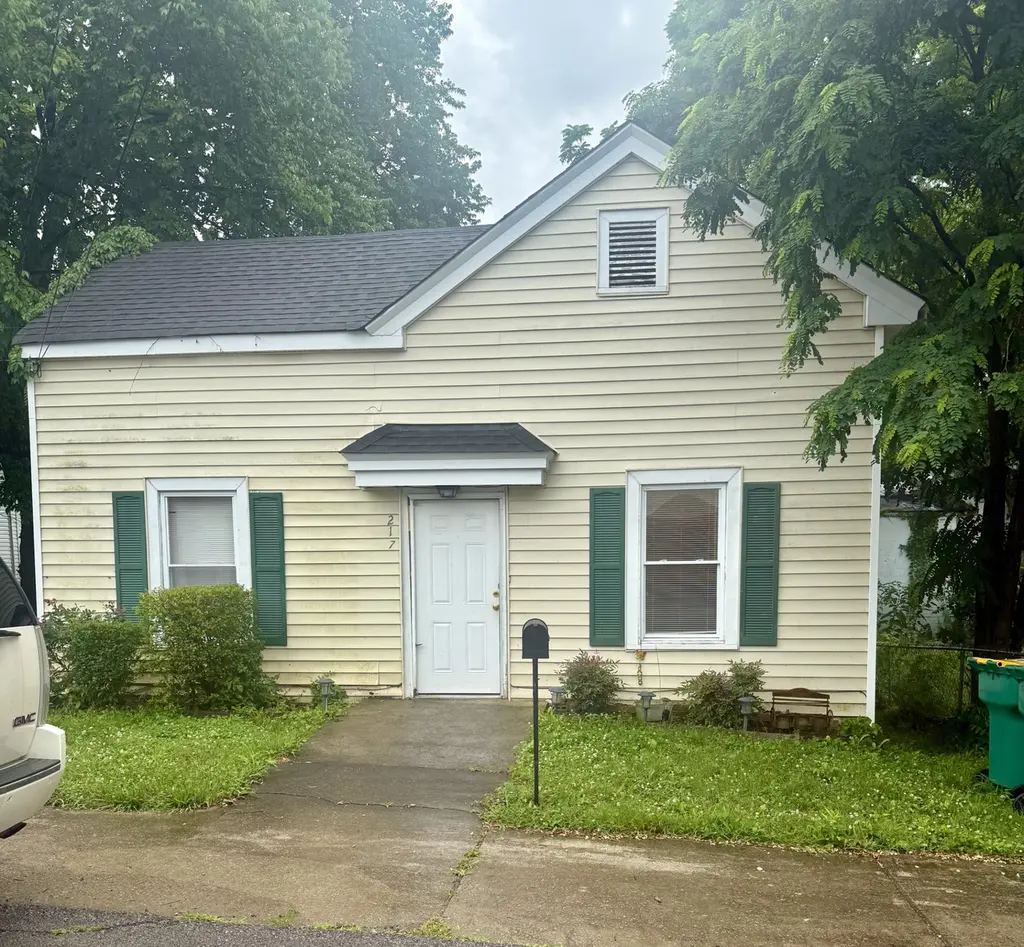
217 Haynes St · Lewisburg, TN
Flood risk 6/10 · Moderate
- FEMA flood zone
- X (unshaded)
- Chance of flooding over 30 yrs
- 0.74%
- Est. flood insurance / yr
- $507 – $1,088
Fire risk 4/10 · Minor
- Est. fire insurance / yr
- $949 – $1,763
Heat risk 6/10 · Moderate
- Hot days now (above 105°F)
- 7 days/yr
- Hot days in 30 yrs
- 22 days/yr
Wind risk 4/10 · Minor
- Chance of severe wind over 30 yrs
- 12.0%
Air-quality risk 2/10 · Minimal
- Unhealthy air days now
- 0 days/yr
- Unhealthy air days in 30 yrs
- 1 days/yr
Risk factors via First Street. Map © Google.
Why this score? — see what drove the B- grade
The composite is a weighted blend of 9 inputs, each scored 0–100. Each bar is that input's sub-score; the figure is the points it added to the 100-point composite (weight × sub-score).
- Cash flow +30.0/30.0
- 1% rule +10.0/10.0
- DSCR +10.0/10.0
- ARV discount +7.5/15.0
- Livability +3.0/5.0
- Schools +2.6/10.0
- Rent growth +2.5/5.0
- Condition / age +2.5/5.0
- Appreciation +0.0/10.0
$139,900
🖨 Deal sheet 📄 Offer letter ✓ Due diligence
Multi-family units
County records classify this as Multi-Family (2-4 Unit). Listing-text estimate: 1 unit. estimate disagrees with records
Listing remarks MLS
Duplex has 2 beds and full bath on each side. Bring your investors! 2 rent producing properties in 1! Each have their own utilities. Need some interior work, but has great potential! newer windows and roof 5 years old. Shed available to purchase but does not stay with house. Property is sold AS-IS
Key facts
- 4,356 sq ft lot
- 2 parking spots
- Built 1935
Property features AI
Exterior
- Parking: 2 total parking spaces (2 open); No covered parking
- Utilities: Public water; Public sewer; Water service available
- Home design: Single-family residence; One story; Residential property
- Construction: Vinyl siding; Crawl space foundation; Existing structure (built previously)
- Exterior features: Lot approximately 0.1 acre (75 x 84)
Interior
- Kitchen: Range
- Bedrooms: 4 bedrooms (all on main level)
- Flooring: Wood flooring; Vinyl flooring
- Bathrooms: 2 full bathrooms
- Heating & cooling: Wall furnace heating; Wall/window air conditioning units
- Interior features: Range (cooktop/oven)
Neighborhood map
What this means for you Summary
Snapshot
- This is a 3-bed/2.0-bath multifamily listed at $140k.
Deal economics
- At list price, monthly cash flow is $1k ($14k/yr) — positive.
- The deal already cash-flows at list — no discount required.
- Meets the 1% rule at list price ($3k rent vs $140k).
- Cap rate 16.2% vs local median 3.6% in Lewisburg — top-decile yield for the area; either an underpriced asset or a hidden risk that comps aren't pricing in. Stress-test before assuming the spread holds.
Location & tenants
- Location reads 59/100 on livability (#284 in TN) — a working-class tenant base; expect higher turnover. Strengths: cost of living A+, housing A+, health & safety A+; Watch: crime F, amenities F, commute F.
- Marshall County (rural): math 31% / reading 29% proficiency, ranked #58 of 139 in TN (top 42%) — families likely to look elsewhere, expect single-tenant / working-renter base with shorter leases.
- Zoned schools: Marshall Elementary (math 27% / reading 27%, grade F, #496 of 952 statewide, top 55%, 388 students, 0% FRL); Marshall Co High School (math 17% / reading 35%, grade F, #117 of 332 statewide, top 37%, 815 students, 0% FRL) — zoned schools average 0% FRL vs 48% district-wide (48 pts lower); this property's tenant base skews higher-income than the district average.
- Market conditions: 274 active listings in the ZIP; 2 comparable units currently listed for rent nearby; 400 units permitted in Marshall County in 2024 (75 in 5+ unit buildings).
Forward outlook
- Local home prices are declining (-3.0%/yr); year-one equity from $967 of loan paydown is wiped out by about $4k of value loss. Plan a longer hold.
- Marshall County population projected at +5% by 2050 — modest demand growth; plan on rents tracking national, not racing it.
- At projected returns (-3.0% appreciation + 3.0% rent growth), your $39k cash investment doubles in ~4 years — after that, you're playing with house money.
Negotiation context
- Only 7 days on market — expect competitive offers; lowballing is unlikely to land.
- 4 sale attempts since 15y ago with the ask held roughly flat each time — persistent listings suggest the price (not the market) is what's stuck; bring a comps-based counter.
- Current owner paid $35k; list at $140k implies a 300% gain — meaningful room to come down on a strong offer.
Risks & watch-outs
- Watch-outs: built in 1935 — expect roof / HVAC / electrical / plumbing capex.
- Climate carrying-cost: major flood risk; extreme-heat days projected 7→22/yr by 2055 (HVAC capex compounding) — expect insurance premiums to compound above CPI over the hold.
Questions for the listing agent
- Built in 1935 — when were the roof, HVAC, electrical panel, plumbing, and water heater last replaced?
- Is there a deadline driving the sale (1031 exchange, divorce, estate, relocation)? That informs how much negotiation room exists.
- Schools are F-rated, which usually means shorter tenancies and higher turnover. Who's the typical renter profile here, and what's been the actual vacancy rate?
- Crime grade is F in this area — have there been break-ins, vandalism, or insurance claims at this property in the last 3 years? What carrier currently insures it and at what premium?
- What's the average days-on-market for RENTAL listings here right now (not sales)? A rising rental-DOM trend means longer vacancies and softer asking-rent achievability than the comps imply.
- What's the recent tenant-quality profile in this submarket — average credit score on applications, eviction rate, late-payment / NSF rate, and stable-employment percentage? A property-management company in the area should have these aggregated.
- How much new apartment / multifamily construction is in the pipeline within 1–3 miles? Heavy new supply (>2% of stock underway) typically softens rents 12–24 months out; light construction supports rent growth.
Investment metrics
- 1% rule
- 1.83% ✓
- Cap rate
- 16.16%
- Cash-on-cash
- 35.24%
- DSCR
- 2.57
- GRM
- 4.5
CMA / ARV
No comps found within radius.
Projected returns pro-forma
-3.0% appreciation · 3.0% rent growth · sell at horizon
- IRR
- 30.8%
- Equity multiple
- 2.29×
- Total profit
- $50,589
- Equity at exit
- $20,860
- IRR
- 38.0%
- Equity multiple
- 4.53×
- Total profit
- $138,338
- Equity at exit
- $12,096
Cash invested: $39,172 (down + closing). Projections, not guarantees.
Landlord ↔ Tenant lean methodology
- Overall (STATE)
- 87 Strongly Landlord-Friendly
- State Tennessee
- 87 Strongly Landlord-Friendly · R+13
- County
- — inherits STATE
- City
- — inherits STATE
ZIP-level market 37091
- Home prices YoY
- -14.6%
- Active inventory
- 274
- Price-to-rent
- 4.5×
Monthly cashflow live
- Estimated rent
- $2,567 medium interval (Pro) →
- Mortgage (P&I)
- −$734
- Tax from tax record
- −$85 /mo · $1,022/yr
- Insurance
- −$58
- HOA
- −$0
- Vacancy / Maint / Mgmt
- −$539
- Net cashflow
- $1,150
Break-even live
UW: 25.0% down · 7.5% · 30yr · 1.5% tax · 5.0% vac · 8.0% maint · 8.0% mgmt
Financing live
Cash to close
- Down payment
- $34,975
- Closing costs
- $4,197
- Reserves months
- —
- Total cash needed
- —
Loan-product check · same deal, 3 products live
Conventional
25% down · 7.5% · 30yr
- Down + closing
- —
- Monthly P&I
- —
- Monthly cashflow
- —
- DSCR
- —
- Eligible?
- —
Personal DTI + credit; lowest rate.
DSCR
20% down · 8.5% · 30yr
- Down + closing
- —
- Monthly P&I
- —
- Monthly cashflow
- —
- DSCR
- —
- Eligible?
- —
No personal income docs; deal must DSCR.
Hard money
10% down · 12.0% · 12mo
- Down + closing
- —
- Monthly P&I
- —
- Monthly cashflow
- —
- DSCR
- —
- Eligible?
- —
Short-term bridge; refi at stabilization.
Rent comps 2 comps
| Address | Beds | Baths | Sqft | Rent | $/sqft | DOM | Units | Dist |
|---|---|---|---|---|---|---|---|---|
| 423 4th Ave N Lewisburg, TN | 2.0 | 1.0 | 1086 | $790 | $0.73 | 23d | 1 | 0.13mi |
| 335 E Hill Ave Lewisburg, TN | 3.0 | 2.0 | 1800 | $5,000 | $2.78 | 43d | 1 | 0.25mi |
Listing history 6 events
-
2026-06-07statusdays on market $139,900 Pending 7 DOM
-
2026-06-03days on market $139,900 Active 5 DOM
-
2026-06-02remarks 409-char remark
-
2026-06-02days on market $139,900 Active 4 DOM
-
2026-06-01days on market $139,900 Active 3 DOM
-
2026-05-31days on market $139,900 Active 2 DOM
ⓘ Source: listings_history table (triggers on properties + properties_extension) + one-shot
backfill from property_details.listing_events for pre-trigger history.
Tax reassessment forecast TN · Resets to sale price
- Current annual tax
- $1,022 · $85/mo
- Projected year-2 tax
- $1,022 · $85/mo
- Expected delta
- $0/yr ($0/mo · 0.0%)
ⓘ Screening estimate from a state-policy table — verify with the county assessor before closing.
Climate risk First Street
- Flood 6/10 Major FEMA zone X (unshaded) · 74% chance over 30 yrs
- Wildfire 4/10 Moderate
- Heat 6/10 Major 7 d/yr ≥105°F today · 22 d/yr by 30 yrs out
- Wind 4/10 Moderate 12% chance of damaging wind over 30 yrs
- Air quality 2/10 Low 0 unhealthy d/yr today · 1 by 30 yrs out
Nearby sold comps map
Loading sold comps map…
Walkable amenities ~0.75 mi
Loading nearby amenities…
Taxation est. · year 1
- Rental income
- $30,799
- − Mortgage interest
- −$7,837
- − Property taxes
- −$1,022
- − Insurance
- −$700
- − Repairs & maintenance
- −$2,464
- − Management
- −$2,464
- − Depreciation
- −$4,070
- Taxable income
- $12,243
- Est. tax owed @ 24.0%
- −$2,938
- After-tax cash flow
- $10,867/yr
For passive investors: Depreciation is non-cash, so a rental often shows a tax loss while cash-flowing — sheltering income. Rental losses are passive: they offset passive income freely, and up to $25,000/yr can offset ordinary (W-2) income if you actively participate and your MAGI is under $100k (phasing out to $0 by $150k); unused losses carry forward. On sale, claimed depreciation is recaptured at up to 25%, and gains may owe capital-gains tax (a 1031 exchange can defer both). Figures are a year-1 estimate at your 24.0% rate — not tax advice; consult a CPA.
Schools (NCES district)
- District
- Marshall County
- NCES district ID
- 4702670
- Math proficiency
- 31% ▼ -9.00%
- Reading proficiency
- 29% ▼ -5.00%
- Median HH income
- $43,058
- Composite
- 25.56/100
- National rank
- #7426
- State rank
- #58 of 139 in TN
Livability — Lewisburg
- Score
- 59/100
- State rank
- #284
- US rank
- #20031
Category grades
Schools grade is shown separately in the Schools card above.
Census & demographics
- Census place
- Lewisburg, TN
- Population (ZIP)
- 23,991
Population outlook (Marshall County) Hauer SSP2
- Today (2025)
- 33,222 people
- By 2030
- 33,867 · +1.9%
- By 2040
- 34,743 · +4.6%
- By 2050
- 34,954 · +5.2%
- By 2075
- 34,652 · +4.3%
- By 2100
- 31,862 · -4.1%
Race, ethnicity, and origin ACS 2023
- Neighborhood character
- Predominantly White (82%)
- Race & ethnicity
- White 82% Hispanic / Latino 8% Black 5% Two or more races 4%
- Hispanic origin (detail)
- Mexican 7%
- Common ancestry
- Serbian 4% Slovak 2% Romanian 1%
- Foreign-born
- 3% · Canada, Jamaica, Vietnam
- Languages at home
- 92% English-only · Spanish 7%
Political lean MEDSL · Marshall
- 2024 margin
- Solid R (+56.6) · D 21.2% · R 77.8%
- 2008→2024 swing
- -17.0pp toward R · 2008: -39.6pp · 2024: -56.6pp
- All cycles
- 2024: R+56.6 2020: R+50.0 2016: R+46.6 2012: R+28.9 2008: R+39.6
Not yet ingested
- Civics
- —
Market trends
- HPI YoY
- ▼ -59.86%
- Current HPI
- 350.5306
- Rent YoY
- —
- Metro
- —
- State GDP YoY
- ▲ 2.78%
- F500 in state
- 22
Industry mix (Fortune 500 HQ in TN)
| Industry | F500 HQs | Revenue |
|---|---|---|
| Healthcare | 3 | $91B |
|
||
| Retail | 3 | $72B |
|
||
| Transportation / Logistics | 1 | $88B |
|
||
| Paper / Packaging | 1 | $19B |
|
||
| Insurance | 1 | $13B |
|
||
| Energy | 1 | $12B |
|
||
Price history
+254.2% since first listed12 events — show timeline
- 2026-05-29 Listed $139,900 REALTRACS as Distributed by MLS Grid
- 2026-05-29 Listed $139,900 REALTRACS as Distributed by MLS Grid
- 2026-05-29 Coming Soon $139,900 REALTRACS as Distributed by MLS Grid
- 2026-05-29 Coming Soon $139,900 REALTRACS as Distributed by MLS Grid
- 2012-09-11 Sold (Public Records) $35,100 Public Records
- 2012-09-11 Sold (MLS) $35,000 REALTRACS as Distributed by MLS Grid
- 2012-09-10 Listing Removed — REALTRACS as Distributed by MLS Grid
- 2012-09-10 Listing Removed — REALTRACS as Distributed by MLS Grid
- 2012-07-09 Listed $36,500 REALTRACS as Distributed by MLS Grid
- 2011-08-10 Listed $36,500 REALTRACS as Distributed by MLS Grid
- 2011-02-17 Sold (Public Records) $28,000 Public Records
- 2001-10-12 Sold (Public Records) $39,500 Public Records
Property tax history
+6.1%/yrLatest (2025): $1,022 · +7.9% YoY. Source: county tax records.
Cash-flow waterfall
monthlySold comps — $/sqft
last 12 mo · ≤1 miLoading sold comps…