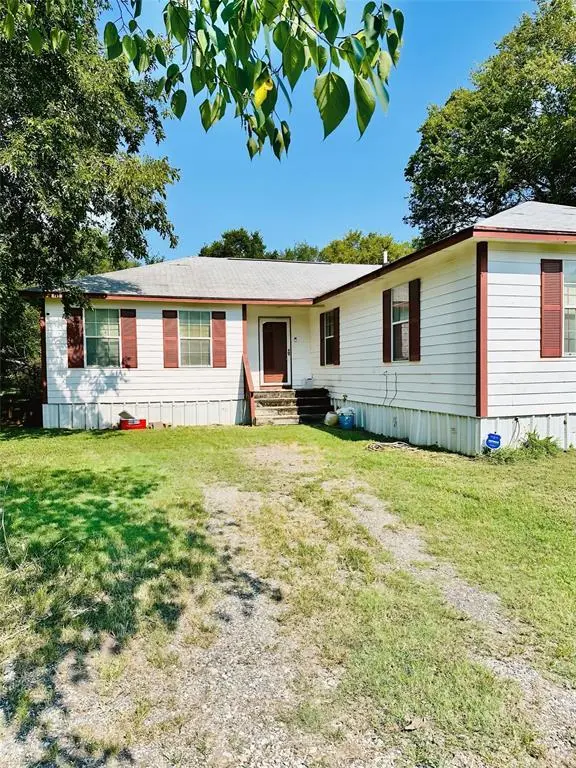
300 SW 3rd St · Hubbard, TX
Flood risk 1/10 · Minimal
- FEMA flood zone
- X (unshaded)
- Chance of flooding over 30 yrs
- 0.0%
- Est. flood insurance / yr
- $507 – $1,088
Fire risk 5/10 · Moderate
- Est. fire insurance / yr
- $1,222 – $2,270
Heat risk 7/10 · Major
- Hot days now (above 109°F)
- 7 days/yr
- Hot days in 30 yrs
- 24 days/yr
Wind risk 6/10 · Moderate
- Chance of severe wind over 30 yrs
- 59.0%
Air-quality risk 2/10 · Minimal
- Unhealthy air days now
- 0 days/yr
- Unhealthy air days in 30 yrs
- 1 days/yr
Risk factors via First Street. Map © Google.
Why this score? — see what drove the B+ grade
The composite is a weighted blend of 9 inputs, each scored 0–100. Each bar is that input's sub-score; the figure is the points it added to the 100-point composite (weight × sub-score).
- Cash flow +28.6/30.0
- 1% rule +10.0/10.0
- DSCR +10.0/10.0
- Appreciation +9.5/10.0
- ARV discount +7.5/15.0
- Livability +3.2/5.0
- Schools +3.0/10.0
- Rent growth +2.5/5.0
- Condition / age +2.5/5.0
$99,000
🖨 Deal sheet 📄 Offer letter ✓ Due diligence
Listing remarks
New Roof just installed May 2026! 4 Bedroom 2 bathroom home on a large corner lot with mature trees. Located in the quiet town of Hubbard, TX, which is just a short drive to Waco or Hillsboro. The home has a large living room, ample sized kitchen with eating area, and a room that was used as a small bar, but could also make a great home office.
Key facts
- Large corner lot
- Large living room
- Ample sized kitchen
Tags
Property features AI
Finance
- Other: Transaction type: For Sale; Possession at closing/funding; Listing agreement: Exclusive right to sell
- Financial info: Listing terms: Cash, Conventional
- HOA & community: No association
Exterior
- Parking: Driveway
- Utilities: City water; City sewer; No municipal utility district
- Home design: Single family residence; Residential property; One story
- Construction: Built in 2004; Fiberglass siding
- Exterior features: Lot less than 0.5 acre; Subdivision: Hubbard Ot
Interior
- Kitchen: Electric range; Refrigerator; Pantry
- Bedrooms: 4 bedrooms (primary bedroom on level 1)
- Bathrooms: 2 full bathrooms
- Heating & cooling: Electric fireplace in living room
- Interior features: Pantry; One living area; One dining area; Room count: 2
- Laundry & utility: Electric water heater
Neighborhood map
What this means for you Summary
Snapshot
- This is a 4-bed/2.0-bath single-family listed at $99k.
Deal economics
- At list price, monthly cash flow is $328 ($4k/yr) — positive.
- The deal already cash-flows at list — no discount required.
- Meets the 1% rule at list price ($2k rent vs $99k).
- Recommended offer: $87k (12.0% below list) — sets the bar for market timing.
Location & tenants
- Location reads 63/100 on livability (#839 in TX) — a middle-class / working-renter tenant base. Strengths: cost of living A+, housing A, crime A-; Watch: amenities F, commute F, employment F.
- Hubbard ISD (rural): math 28% / reading 44% proficiency, ranked #506 of 826 in TX (top 61%) — families likely to look elsewhere, expect single-tenant / working-renter base with shorter leases; 63% free/reduced lunch — lower-income household profile, screen leases tightly.
- Zoned schools: Hubbard El (math 27% / reading 42%, grade F, #1,995 of 4,322 statewide, top 50%, 218 students, 68% FRL).
- Market conditions: 60 active listings in the ZIP; 1 comparable units currently listed for rent nearby; 65 units permitted in Hill County in 2024 (0 in 5+ unit buildings).
Forward outlook
- In year one you build about $10k of equity ($684 loan paydown + $9k appreciation (8.9% local appreciation)).
- Hill County population projected at -12% by 2050 — secular population decline; favor cash flow + early exit over multi-decade hold.
- At projected returns (8.9% appreciation + 3.0% rent growth), your $28k cash investment doubles in ~2 years — after that, you're playing with house money.
- By year 4, paydown + projected appreciation supports a ~$33k cash-out refi (75% LTV) — recoverable capital for the next deal without selling this one.
Negotiation context
- It's been on market 261 days — a 12% lower offer ($87k) is reasonable based on typical stale-listing flexibility.
Risks & watch-outs
- Watch-outs: property tax is 4.1% of price.
- Climate carrying-cost: major wind risk, 59% chance of damaging wind over 30y; moderate wildfire risk; extreme-heat days projected 7→24/yr by 2055 (HVAC capex compounding) — expect insurance premiums to compound above CPI over the hold.
Questions for the listing agent
- It's been on market 261 days. Have you received any prior offers? Is the seller open to a 12% concession, seller financing, or rate buy-down credit?
- Property tax is high relative to price — has the assessment been appealed recently, and will the sale trigger a re-assessment?
- Why hasn't it sold? Are there any deal-killer items the seller is aware of (foundation, flood, title, zoning, code violations)?
- Is there a deadline driving the sale (1031 exchange, divorce, estate, relocation)? That informs how much negotiation room exists.
- Schools are F-rated, which usually means shorter tenancies and higher turnover. Who's the typical renter profile here, and what's been the actual vacancy rate?
- What's the average days-on-market for RENTAL listings here right now (not sales)? A rising rental-DOM trend means longer vacancies and softer asking-rent achievability than the comps imply.
- What's the recent tenant-quality profile in this submarket — average credit score on applications, eviction rate, late-payment / NSF rate, and stable-employment percentage? A property-management company in the area should have these aggregated.
- How much new for-sale + rental construction is in the pipeline within 1–3 miles? Heavy new supply typically softens prices + rents 12–24 months out; constrained supply supports both.
Investment metrics
- 1% rule
- 1.57% ✓
- Cap rate
- 10.27%
- Cash-on-cash
- 14.20%
- DSCR
- 1.63
- GRM
- 5.3
CMA / ARV
No comps found within radius.
Projected returns pro-forma
8.95% appreciation · 3.0% rent growth · sell at horizon
- IRR
- 32.9%
- Equity multiple
- 3.45×
- Total profit
- $67,914
- Equity at exit
- $81,694
- IRR
- 28.9%
- Equity multiple
- 7.58×
- Total profit
- $182,466
- Equity at exit
- $168,767
Cash invested: $27,720 (down + closing). Projections, not guarantees.
Landlord ↔ Tenant lean methodology
- Overall (STATE)
- 87 Strongly Landlord-Friendly
- State Texas
- 87 Strongly Landlord-Friendly · R+5
- County
- — inherits STATE
- City
- — inherits STATE
ZIP-level market 76648
- Home prices YoY
- 4.2%
- Active inventory
- 60
- Price-to-rent
- 5.3×
Monthly cashflow live
- Estimated rent
- $1,550 medium interval (Pro) →
- Mortgage (P&I)
- −$519
- Tax from tax record
- −$336 /mo · $4,034/yr
- Insurance
- −$41
- HOA
- −$0
- Vacancy / Maint / Mgmt
- −$326
- Net cashflow
- $328
Break-even live
UW: 25.0% down · 7.5% · 30yr · 1.5% tax · 5.0% vac · 8.0% maint · 8.0% mgmt
Financing live
Cash to close
- Down payment
- $24,750
- Closing costs
- $2,970
- Reserves months
- —
- Total cash needed
- —
Loan-product check · same deal, 3 products live
Conventional
25% down · 7.5% · 30yr
- Down + closing
- —
- Monthly P&I
- —
- Monthly cashflow
- —
- DSCR
- —
- Eligible?
- —
Personal DTI + credit; lowest rate.
DSCR
20% down · 8.5% · 30yr
- Down + closing
- —
- Monthly P&I
- —
- Monthly cashflow
- —
- DSCR
- —
- Eligible?
- —
No personal income docs; deal must DSCR.
Hard money
10% down · 12.0% · 12mo
- Down + closing
- —
- Monthly P&I
- —
- Monthly cashflow
- —
- DSCR
- —
- Eligible?
- —
Short-term bridge; refi at stabilization.
Rent comps 1 comps
| Address | Beds | Baths | Sqft | Rent | $/sqft | DOM | Units | Dist |
|---|---|---|---|---|---|---|---|---|
| 910 N Magnolia Ave Hubbard, TX | 3.0 | 2.0 | 1432 | $1,550 | $1.08 | 12d | 1 | 0.95mi |
Listing history 16 events
-
2026-06-18days on market $99,000 Active 261 DOM
-
2026-06-17days on market $99,000 Active 260 DOM
-
2026-06-16days on market $99,000 Active 259 DOM
-
2026-06-15days on market $99,000 Active 258 DOM
-
2026-06-13days on market $99,000 Active 256 DOM
-
2026-06-12days on market $99,000 Active 255 DOM
-
2026-06-10days on market $99,000 Active 252 DOM
-
2026-06-09remarks 346-char remark
-
2026-06-09status $99,000 Active 251 DOM
-
2026-05-25status Pending
-
2026-04-30historical Active Option Contract
-
2026-04-22price $99,000
-
2026-02-09price $135,000
-
2025-10-06price $145,000
-
2025-09-16$159,000 Active
-
2006-05-15soldstatus
ⓘ Source: listings_history table (triggers on properties + properties_extension) + one-shot
backfill from property_details.listing_events for pre-trigger history.
Tax reassessment forecast TX · Resets to sale price
- Current annual tax
- $4,034 · $336/mo
- Projected year-2 tax
- $4,034 · $336/mo
- Expected delta
- $0/yr ($0/mo · 0.0%)
ⓘ Screening estimate from a state-policy table — verify with the county assessor before closing.
Climate risk First Street
- Flood 1/10 Low FEMA zone X (unshaded) · 0% chance over 30 yrs
- Wildfire 5/10 Major
- Heat 7/10 Severe 7 d/yr ≥109°F today · 24 d/yr by 30 yrs out
- Wind 6/10 Major 59% chance of damaging wind over 30 yrs
- Air quality 2/10 Low 0 unhealthy d/yr today · 1 by 30 yrs out
Nearby sold comps map
Loading sold comps map…
Walkable amenities ~0.75 mi
Loading nearby amenities…
Taxation est. · year 1
- Rental income
- $18,600
- − Mortgage interest
- −$5,546
- − Property taxes
- −$4,034
- − Insurance
- −$495
- − Repairs & maintenance
- −$1,488
- − Management
- −$1,488
- − Depreciation
- −$2,880
- Taxable income
- $2,670
- Est. tax owed @ 24.0%
- −$641
- After-tax cash flow
- $3,294/yr
For passive investors: Depreciation is non-cash, so a rental often shows a tax loss while cash-flowing — sheltering income. Rental losses are passive: they offset passive income freely, and up to $25,000/yr can offset ordinary (W-2) income if you actively participate and your MAGI is under $100k (phasing out to $0 by $150k); unused losses carry forward. On sale, claimed depreciation is recaptured at up to 25%, and gains may owe capital-gains tax (a 1031 exchange can defer both). Figures are a year-1 estimate at your 24.0% rate — not tax advice; consult a CPA.
Schools (NCES district)
- District
- Hubbard ISD
- NCES district ID
- 4823730
- Math proficiency
- 28% ▼ -5.00%
- Reading proficiency
- 44% ▲ 4.00%
- Median HH income
- $42,664
- Composite
- 30.42/100
- National rank
- #6243
- State rank
- #506 of 826 in TX
Livability — Hubbard
- Score
- 63/100
- State rank
- #839
- US rank
- #15119
Category grades
Schools grade is shown separately in the Schools card above.
Census & demographics
- Census place
- Hubbard, TX
- City population
- 2,922
- Population (ZIP)
- 2,922
Population outlook (Hill County) Hauer SSP2
- Today (2025)
- 34,013 people
- By 2030
- 33,289 · -2.1%
- By 2040
- 31,688 · -6.8%
- By 2050
- 30,100 · -11.5%
- By 2075
- 26,818 · -21.2%
- By 2100
- 22,918 · -32.6%
Race, ethnicity, and origin ACS 2023
- Neighborhood character
- Majority White (65%)
- Race & ethnicity
- White 65% Hispanic / Latino 17% Black 11% Two or more races 4% Asian 3%
- Hispanic origin (detail)
- Mexican 15%
- Common ancestry
- Italian 2% Lithuanian 1% Serbian 1%
- Foreign-born
- 4% · Canada
- Languages at home
- 89% English-only · Spanish 7% Other Indo-European 3% Other Asian/Pacific 1%
Political lean MEDSL · Hill
- 2024 margin
- Solid R (+64.4) · D 17.5% · R 81.8%
- 2008→2024 swing
- -23.0pp toward R · 2008: -41.4pp · 2024: -64.4pp
- All cycles
- 2024: R+64.4 2020: R+60.7 2016: R+58.4 2012: R+53.0 2008: R+41.4
Not yet ingested
- Civics
- —
Market trends
- HPI YoY
- ▲ 8.95%
- Current HPI
- 223.2919
- Rent YoY
- —
- Metro
- —
- State GDP YoY
- ▲ 3.95%
- F500 in state
- 110
Industry mix (Fortune 500 HQ in TX)
| Industry | F500 HQs | Revenue |
|---|---|---|
| Energy | 16 | $1,198B |
|
||
| Technology | 5 | $198B |
|
||
| Engineering / Construction | 4 | $72B |
|
||
| Energy Services | 3 | $60B |
|
||
| Utilities | 3 | $41B |
|
||
| Healthcare | 2 | $330B |
|
||
Price history
-37.7% since first listed7 events — show timeline
- 2026-05-25 Pending — NTREIS
- 2026-04-30 Contingent — NTREIS
- 2026-04-22 Price Changed $99,000 NTREIS
- 2026-02-09 Price Changed $135,000 NTREIS
- 2025-10-06 Price Changed $145,000 NTREIS
- 2025-09-16 Listed $159,000 NTREIS
- 2006-05-15 Sold (Public Records) — Public Records
Property tax history
+4.3%/yrLatest (2025): $4,034 · +9.3% YoY. Source: county tax records.
Cash-flow waterfall
monthlySold comps — $/sqft
last 12 mo · ≤1 miLoading sold comps…