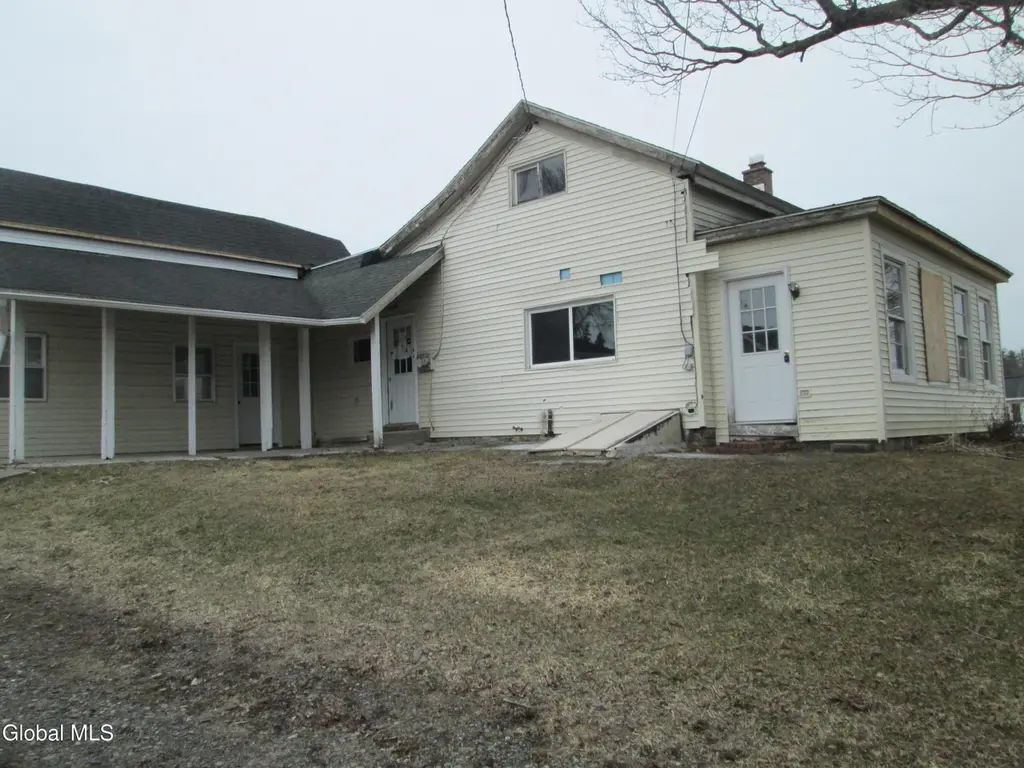
97 N Main St · Mayfield, NY
Flood risk 1/10 · Minimal
- FEMA flood zone
- X
- Chance of flooding over 30 yrs
- 0.0%
- Est. flood insurance / yr
- $473 – $860
Fire risk 4/10 · Minor
- Est. fire insurance / yr
- $691 – $1,283
Heat risk 2/10 · Minimal
- Hot days now (above 93°F)
- 7 days/yr
- Hot days in 30 yrs
- 16 days/yr
Wind risk 2/10 · Minimal
- Chance of severe wind over 30 yrs
- 3.0%
Air-quality risk 1/10 · Minimal
- Unhealthy air days now
- 0 days/yr
- Unhealthy air days in 30 yrs
- 0 days/yr
Risk factors via First Street. Map © Google.
Why this score? — see what drove the B+ grade
The composite is a weighted blend of 9 inputs, each scored 0–100. Each bar is that input's sub-score; the figure is the points it added to the 100-point composite (weight × sub-score).
- Cash flow +30.0/30.0
- 1% rule +10.0/10.0
- DSCR +10.0/10.0
- Appreciation +9.3/10.0
- ARV discount +7.5/15.0
- Schools +4.2/10.0
- Livability +3.3/5.0
- Rent growth +2.5/5.0
- Condition / age +2.5/5.0
$39,900
🖨 Deal sheet 📄 Offer letter ✓ Due diligence
Listing remarks
HOME IN POOR CONDITION WITH EXCESSIVE WATER DAMAGE. SOLD AS IS. . CASH ONLY WITH SHORT SALE CONTINGENCY.
Key facts
- 0.62 acre lot
- Garage
- Built 1890
Neighborhood map
What this means for you Summary
Snapshot
- This is a 3-bed/1.0-bath single-family listed at $40k.
Deal economics
- At list price, monthly cash flow is $725 ($9k/yr) — positive.
- The deal already cash-flows at list — no discount required.
- Meets the 1% rule at list price ($1k rent vs $40k).
Location & tenants
- Location reads 66/100 on livability (#634 in NY) — a middle-class / working-renter tenant base. Strengths: housing A+, health & safety A, cost of living A-; Watch: crime F, amenities F, commute F.
- Mayfield Central School District (town): math 42% / reading 56% proficiency, ranked #400 of 590 in NY (top 68%) — families likely to look elsewhere, expect single-tenant / working-renter base with shorter leases.
- Market conditions: 25 active listings in the ZIP; 112 units permitted in Fulton County in 2024 (50 in 5+ unit buildings).
Forward outlook
- In year one you build about $4k of equity ($276 loan paydown + $3k appreciation (8.6% local appreciation)).
- Fulton County population projected at -23% by 2050 — secular population decline; favor cash flow + early exit over multi-decade hold.
- At projected returns (8.6% appreciation + 3.0% rent growth), your $11k cash investment doubles in ~1 year — after that, you're playing with house money.
- By year 8, paydown + projected appreciation supports a ~$31k cash-out refi (75% LTV) — recoverable capital for the next deal without selling this one.
Negotiation context
- Only 4 days on market — expect competitive offers; lowballing is unlikely to land.
- 8 sale attempts since 4y ago with the ask held roughly flat each time — persistent listings suggest the price (not the market) is what's stuck; bring a comps-based counter.
Risks & watch-outs
- Watch-outs: built in 1890 — expect roof / HVAC / electrical / plumbing capex.
Questions for the listing agent
- Built in 1890 — when were the roof, HVAC, electrical panel, plumbing, and water heater last replaced?
- Is there a deadline driving the sale (1031 exchange, divorce, estate, relocation)? That informs how much negotiation room exists.
- Crime grade is F in this area — have there been break-ins, vandalism, or insurance claims at this property in the last 3 years? What carrier currently insures it and at what premium?
- What's the average days-on-market for RENTAL listings here right now (not sales)? A rising rental-DOM trend means longer vacancies and softer asking-rent achievability than the comps imply.
- What's the recent tenant-quality profile in this submarket — average credit score on applications, eviction rate, late-payment / NSF rate, and stable-employment percentage? A property-management company in the area should have these aggregated.
- How much new for-sale + rental construction is in the pipeline within 1–3 miles? Heavy new supply typically softens prices + rents 12–24 months out; constrained supply supports both.
Investment metrics
- 1% rule
- 3.17% ✓
- Cap rate
- 28.09%
- Cash-on-cash
- 77.85%
- DSCR
- 4.46
- GRM
- 2.6
CMA / ARV
- ARV (on-the-fly)
- $214,830
- Comps found
- 4
Show comp detail 4 sales within ~0.75 mi
| Address | Dist | Beds/Ba | Sqft | Sold | Price | $/sf | Match |
|---|---|---|---|---|---|---|---|
| 24 W Main St | 0.48mi | 3/2.5 | 1,681 (-1%) | 22mo | $175,000 | $104 | 51 |
| 12 2nd Ave | 0.63mi | 3/1.5 | 1,560 (-8%) | 5mo | $234,000 | $150 | 50 |
| 5 1st Ave | 0.59mi | 2/2.0 (-1) | 1,594 (-6%) | 8mo | $125,000 | $78 | 46 |
| 183 Paradise Point Rd | 0.72mi | 4/1.0 (+1) | 1,514 (-11%) | 21mo | $190,900 | $126 | 25 |
Match score weights: distance 35% · size 25% · config 20% · recency 20%. Top-matched comps best support the ARV.
Projected returns pro-forma
8.55% appreciation · 3.0% rent growth · sell at horizon
- IRR
- 86.8%
- Equity multiple
- 6.73×
- Total profit
- $64,032
- Equity at exit
- $31,819
- IRR
- 82.5%
- Equity multiple
- 14.57×
- Total profit
- $151,631
- Equity at exit
- $64,652
Cash invested: $11,172 (down + closing). Projections, not guarantees.
Landlord ↔ Tenant lean methodology
- Overall (STATE)
- 15 Strongly Tenant-Friendly
- State New York
- 15 Strongly Tenant-Friendly · D+10
- County
- — inherits STATE
- City
- — inherits STATE
ZIP-level market 12117
- Home prices YoY
- 2.6%
- Active inventory
- 25
- Price-to-rent
- 2.6×
Monthly cashflow live
- Estimated rent
- $1,266 medium interval (Pro) →
- Mortgage (P&I)
- −$209
- Tax est. 1.5%
- −$50 /mo · $598/yr
- Insurance
- −$17
- HOA
- −$0
- Vacancy / Maint / Mgmt
- −$266
- Net cashflow
- $725
Break-even live
UW: 25.0% down · 7.5% · 30yr · 1.5% tax · 5.0% vac · 8.0% maint · 8.0% mgmt
Financing live
Cash to close
- Down payment
- $9,975
- Closing costs
- $1,197
- Reserves months
- —
- Total cash needed
- —
Loan-product check · same deal, 3 products live
Conventional
25% down · 7.5% · 30yr
- Down + closing
- —
- Monthly P&I
- —
- Monthly cashflow
- —
- DSCR
- —
- Eligible?
- —
Personal DTI + credit; lowest rate.
DSCR
20% down · 8.5% · 30yr
- Down + closing
- —
- Monthly P&I
- —
- Monthly cashflow
- —
- DSCR
- —
- Eligible?
- —
No personal income docs; deal must DSCR.
Hard money
10% down · 12.0% · 12mo
- Down + closing
- —
- Monthly P&I
- —
- Monthly cashflow
- —
- DSCR
- —
- Eligible?
- —
Short-term bridge; refi at stabilization.
Listing history 32 events
-
2026-04-13status Pending
-
2026-04-09$39,900 Active
-
2026-02-14status Pending
-
2026-02-14historical
-
2026-02-09$64,000 Active
-
2025-07-22status Pending
-
2025-07-21historical
-
2025-07-16$34,000 Active
-
2025-01-13status Pending
-
2025-01-10historical
-
2024-12-06$84,900 Active
-
2024-04-08status Pending
-
2024-04-03historical
-
2024-03-26price $84,000
-
2024-02-14price $86,000
-
2024-01-31price $88,000
-
2024-01-19price $90,000
-
2024-01-15price $95,000
-
2024-01-12$100,000 Active
-
2024-01-08price $100,000
-
2023-12-20historical
-
2023-09-22price $112,000
-
2023-09-22status Active
-
2023-09-20historical
-
2023-07-05price $119,000
-
2023-06-20$129,000 Active
-
2023-06-16historical
-
2022-12-27price $135,900
-
2022-08-08price $144,900
-
2022-06-13$149,900 Active
-
2005-05-19soldstatus $75,200
-
2003-08-08soldstatus $25,000
ⓘ Source: listings_history table (triggers on properties + properties_extension) + one-shot
backfill from property_details.listing_events for pre-trigger history.
Climate risk First Street
- Flood 1/10 Low FEMA zone X · 0% chance over 30 yrs
- Wildfire 4/10 Moderate
- Heat 2/10 Low 7 d/yr ≥93°F today · 16 d/yr by 30 yrs out
- Wind 2/10 Low 3% chance of damaging wind over 30 yrs
- Air quality 1/10 Low 0 unhealthy d/yr today · 0 by 30 yrs out
Nearby sold comps map
Loading sold comps map…
Walkable amenities ~0.75 mi
Loading nearby amenities…
Taxation est. · year 1
- Rental income
- $15,198
- − Mortgage interest
- −$2,235
- − Property taxes
- −$598
- − Insurance
- −$200
- − Repairs & maintenance
- −$1,216
- − Management
- −$1,216
- − Depreciation
- −$1,161
- Taxable income
- $8,572
- Est. tax owed @ 24.0%
- −$2,057
- After-tax cash flow
- $6,640/yr
For passive investors: Depreciation is non-cash, so a rental often shows a tax loss while cash-flowing — sheltering income. Rental losses are passive: they offset passive income freely, and up to $25,000/yr can offset ordinary (W-2) income if you actively participate and your MAGI is under $100k (phasing out to $0 by $150k); unused losses carry forward. On sale, claimed depreciation is recaptured at up to 25%, and gains may owe capital-gains tax (a 1031 exchange can defer both). Figures are a year-1 estimate at your 24.0% rate — not tax advice; consult a CPA.
Schools (NCES district)
- District
- Mayfield Central School District
- NCES district ID
- 3618750
- Math proficiency
- 42% ▼ -11.00%
- Reading proficiency
- 56% ▲ 5.00%
- Median HH income
- $51,922
- Composite
- 42.08/100
- National rank
- #3322
- State rank
- #400 of 590 in NY
Livability — Mayfield
- Score
- 66/100
- State rank
- #634
- US rank
- #11697
Category grades
Schools grade is shown separately in the Schools card above.
Census & demographics
- Population (ZIP)
- 2,841
Population outlook (Fulton County) Hauer SSP2
- Today (2025)
- 51,132 people
- By 2030
- 49,114 · -3.9%
- By 2040
- 44,373 · -13.2%
- By 2050
- 39,321 · -23.1%
- By 2075
- 28,503 · -44.3%
- By 2100
- 19,268 · -62.3%
Race, ethnicity, and origin ACS 2023
- Neighborhood character
- Predominantly White (92%)
- Race & ethnicity
- White 92% Two or more races 7%
- Common ancestry
- Iranian 7% Romanian 6% Lithuanian 5%
- Foreign-born
- 1% · Canada
- Languages at home
- 95% English-only · Other Indo-European 3% Spanish 2%
Political lean MEDSL · Fulton
- 2024 margin
- Solid R (+35.9) · D 32.1% · R 67.9%
- 2008→2024 swing
- -26.6pp toward R · 2008: -9.2pp · 2024: -35.9pp
- All cycles
- 2024: R+35.9 2020: R+31.4 2016: R+35.5 2012: R+10.5 2008: R+9.2
Not yet ingested
- Civics
- —
Market trends
- HPI YoY
- ▲ 8.55%
- Current HPI
- 338.4132
- Rent YoY
- —
- Metro
- —
- State GDP YoY
- ▲ 2.60%
- F500 in state
- 92
Industry mix (Fortune 500 HQ in NY)
| Industry | F500 HQs | Revenue |
|---|---|---|
| Financial Services | 10 | $950B |
|
||
| Consumer Goods | 9 | $162B |
|
||
| Insurance | 4 | $225B |
|
||
| Telecommunications | 2 | $144B |
|
||
| Pharmaceuticals | 2 | $112B |
|
||
| Media / Entertainment | 2 | $69B |
|
||
Price history
+59.6% since first listed32 events — show timeline
- 2026-04-13 Pending — Global MLS
- 2026-04-09 Listed $39,900 Global MLS
- 2026-02-14 Pending — Global MLS
- 2026-02-14 Listing Removed — Global MLS
- 2026-02-09 Listed $64,000 Global MLS
- 2025-07-22 Pending — Global MLS
- 2025-07-21 Listing Removed — Global MLS
- 2025-07-16 Listed $34,000 Global MLS
- 2025-01-13 Pending — Global MLS
- 2025-01-10 Listing Removed — Global MLS
- 2024-12-06 Listed $84,900 Global MLS
- 2024-04-08 Pending — Global MLS
- 2024-04-03 Listing Removed — Global MLS
- 2024-03-26 Price Changed $84,000 Global MLS
- 2024-02-14 Price Changed $86,000 Global MLS
- 2024-01-31 Price Changed $88,000 Global MLS
- 2024-01-19 Price Changed $90,000 Global MLS
- 2024-01-15 Price Changed $95,000 Global MLS
- 2024-01-12 Listed $100,000 Global MLS
- 2024-01-08 Price Changed $100,000 Global MLS
- 2023-12-20 Listing Removed — Global MLS
- 2023-09-22 Price Changed $112,000 Global MLS
- 2023-09-22 Relisted — Global MLS
- 2023-09-20 Listing Removed — Global MLS
- 2023-07-05 Price Changed $119,000 Global MLS
- 2023-06-20 Listed $129,000 Global MLS
- 2023-06-16 Listing Removed — Global MLS
- 2022-12-27 Price Changed $135,900 Global MLS
- 2022-08-08 Price Changed $144,900 Global MLS
- 2022-06-13 Listed $149,900 Global MLS
- 2005-05-19 Sold (Public Records) $75,200 Public Records
- 2003-08-08 Sold (Public Records) $25,000 Public Records
Property tax history
+4.1%/yrLatest (2025): $2,934 · +4.8% YoY. Source: county tax records.
Cash-flow waterfall
monthlySold comps — $/sqft
last 12 mo · ≤1 miLoading sold comps…