247 Sycamore St · Somerset, KY
Flood risk 1/10 · Minimal
- FEMA flood zone
- X (unshaded)
- Chance of flooding over 30 yrs
- 0.0%
- Est. flood insurance / yr
- $507 – $1,088
Fire risk 3/10 · Minor
- Est. fire insurance / yr
- $839 – $1,559
Heat risk 4/10 · Minor
- Hot days now (above 102°F)
- 7 days/yr
- Hot days in 30 yrs
- 20 days/yr
Wind risk 2/10 · Minimal
- Chance of severe wind over 30 yrs
- 4.0%
Air-quality risk 1/10 · Minimal
- Unhealthy air days now
- 0 days/yr
- Unhealthy air days in 30 yrs
- 0 days/yr
Risk factors via First Street. Map © Google.
Why this score? — see what drove the D+ grade
The composite is a weighted blend of 9 inputs, each scored 0–100. Each bar is that input's sub-score; the figure is the points it added to the 100-point composite (weight × sub-score).
- Cash flow +15.6/30.0
- ARV discount +14.8/15.0
- DSCR +4.8/10.0
- Livability +3.4/5.0
- Schools +3.2/10.0
- 1% rule +2.9/10.0
- Rent growth +2.5/5.0
- Condition / age +2.5/5.0
- Appreciation +0.0/10.0
$119,900
🖨 Deal sheet (PDF) 📄 Offer letter ✓ Due diligence
Listing remarks
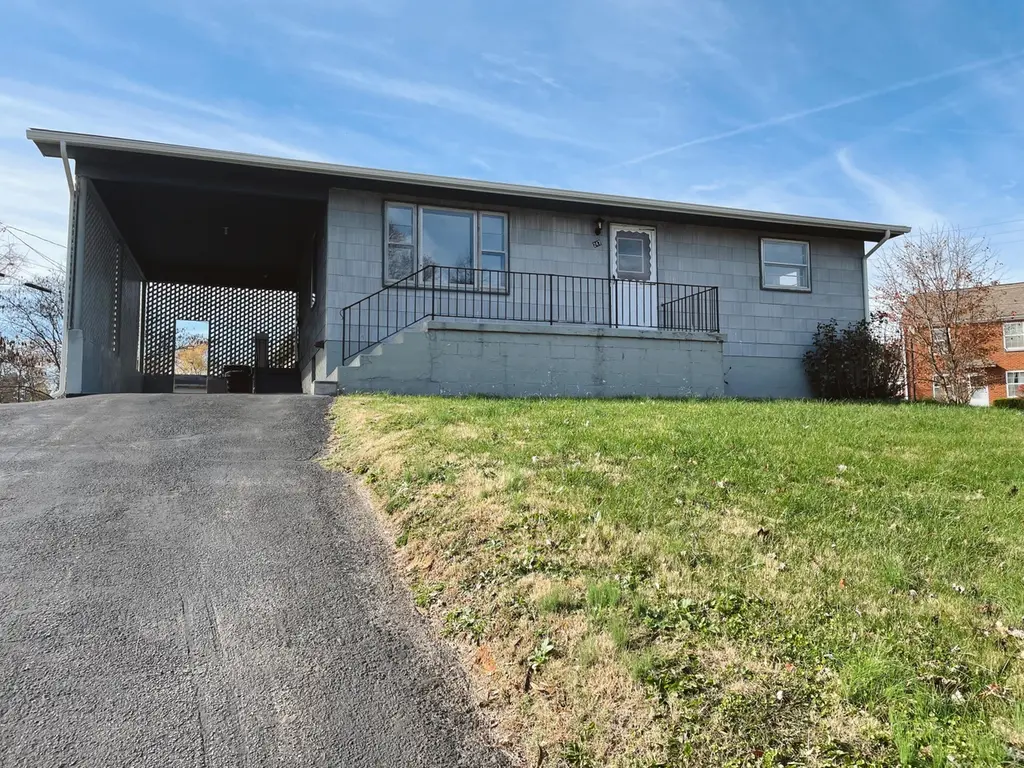
Affordable and charming home conveniently located near downtown Somerset! Situated on a spacious corner lot with mature trees, this property offers both comfort and convenience. Features include 2 bedrooms, an updated full bath, and a kitchen with white cabinetry and white appliances. A carport provides covered parking, while the storage shed offers additional space for lawn equipment and tools. The unfinished basement provides excellent storage and could potentially serve as additional flex space. Enjoy being just minutes from schools, restaurants, shopping, and local entertainment venues. Take advantage of nearby community events, including annual parades, outdoor festivals, and local car
Key facts
- Near schools
- Near dining
- Near shopping
Tags
Property features AI
Exterior
- Parking: Attached carport; Driveway
- Utilities: Public sewer
- Home design: Single-story house
- Construction: Block foundation; Shingle roof; Other construction materials; Built in an earlier year (year built not provided)
- Exterior features: Neighborhood view; Public water
Interior
- Kitchen: Dishwasher; Microwave; Refrigerator; Oven
- Bedrooms: Primary bedroom is on the first floor
- Flooring: Hardwood; Vinyl
- Bathrooms: 1 full bathroom
- Heating & cooling: Baseboard heating; Electric heating; Heat pump; Electric cooling; Heat pump cooling
- Interior features: Primary bedroom on the first floor; Unfinished basement; No fireplace; 2 total rooms
- Laundry & utility: Washer hookup; Electric dryer hookup
Neighborhood map
What this means for you Summary
Snapshot
- This is a 2-bed/1.0-bath single-family listed at $120k.
Deal economics
- At list price, monthly cash flow is $50 ($594/yr) — positive.
- The deal already cash-flows at list — no discount required.
- To meet the 1% rule (rent ≥ 1% of price), the offer needs to be $95k (20.7% below list).
- Recommended offer: $95k (20.7% below list) — sets the bar for 1% rule.
- Cap rate 6.8% vs local median 3.1% in Somerset — top-decile yield for the area; either an underpriced asset or a hidden risk that comps aren't pricing in. Stress-test before assuming the spread holds.
Location & tenants
- Location reads 67/100 on livability (#208 in KY) — a middle-class / working-renter tenant base. Strengths: cost of living A+, health & safety B+, crime B; Watch: amenities F, commute F, employment F.
- Somerset Independent (town): math 36% / reading 44% proficiency, ranked #42 of 165 in KY (top 26%) — families likely to look elsewhere, expect single-tenant / working-renter base with shorter leases.
- Zoned schools: Hopkins Elementary School (math 48% / reading 48%, grade D, #115 of 676 statewide, top 17%, 650 students, 71% FRL); Meece Middle School (math 31% / reading 44%, grade F, #73 of 217 statewide, top 36%, 444 students, 67% FRL); Somerset High School (math 32% / reading 32%, grade F, #97 of 254 statewide, top 46%, 521 students, 54% FRL).
- Market conditions: 192 active listings in the ZIP; 9 comparable units currently listed for rent nearby; rentals lingering (median 46d on market — plan ~5-8 weeks vacancy on turnover, expect pricing pressure); 100% of comp listings sitting > 30 days — soft ceiling on asking rent; 117 units permitted in Pulaski County in 2024 (50 in 5+ unit buildings).
Forward outlook
- Local home prices are declining (-3.0%/yr); year-one equity from $829 of loan paydown is wiped out by about $4k of value loss. Plan a longer hold.
Negotiation context
- Only 4 days on market — expect competitive offers; lowballing is unlikely to land.
- 3 sale attempts with the ask held roughly flat each time — persistent listings suggest the price (not the market) is what's stuck; bring a comps-based counter.
Questions for the listing agent
- Built in 1970 — when were the roof, HVAC, electrical panel, plumbing, and water heater last replaced?
- Is there a deadline driving the sale (1031 exchange, divorce, estate, relocation)? That informs how much negotiation room exists.
- Schools are D-rated, which usually means shorter tenancies and higher turnover. Who's the typical renter profile here, and what's been the actual vacancy rate?
- The area grade is low — what's the realistic commute time and amenity access for the typical tenant pool here? Any planned neighborhood developments (good or bad) we should know about?
- What's the average days-on-market for RENTAL listings here right now (not sales)? A rising rental-DOM trend means longer vacancies and softer asking-rent achievability than the comps imply.
- What's the recent tenant-quality profile in this submarket — average credit score on applications, eviction rate, late-payment / NSF rate, and stable-employment percentage? A property-management company in the area should have these aggregated.
- How much new for-sale + rental construction is in the pipeline within 1–3 miles? Heavy new supply typically softens prices + rents 12–24 months out; constrained supply supports both.
Investment metrics
- 1% rule
- 0.79% ✗
- Cap rate
- 6.79%
- Cash-on-cash
- 1.77%
- DSCR
- 1.08
- GRM
- 10.5
CMA / ARV
- ARV (on-the-fly)
- $143,208
- Comps found
- 9
Show comp detail 9 sales within ~0.75 mi
| Address | Dist | Beds/Ba | Sqft | Sold | Price | $/sf | Match |
|---|---|---|---|---|---|---|---|
| 213 E Limestone St | 0.36mi | 3/1.0 (+1) | 896 (-4%) | 8mo | $185,000 | $206 | 65 |
| 618 N College St | 0.58mi | 2/1.0 | 944 (+1%) | 10mo | $125,000 | $132 | 63 |
| 111 Lair St | 0.42mi | 2/1.5 | 969 (+4%) | 14mo | $103,500 | $107 | 61 |
| 318 Duncan St | 0.61mi | 2/1.0 | 875 (-6%) | 7mo | $152,500 | $174 | 54 |
| 103 W Limestone St | 0.55mi | 2/2.0 | 1,040 (+11%) | 2mo | $159,000 | $153 | 51 |
| 112 Ashurst St | 0.67mi | 2/1.0 | 840 (-10%) | 2mo | $100,000 | $119 | 50 |
| 312 Duncan St | 0.58mi | 3/2.0 (+1) | 984 (+5%) | 10mo | $151,000 | $153 | 47 |
| 304 Hamilton Ave | 0.54mi | 2/1.0 | 808 (-14%) | 11mo | $158,500 | $196 | 43 |
| 616 North College St | 0.58mi | 3/1.0 (+1) | 1,068 (+14%) | 23mo | $138,500 | $130 | 25 |
Match score weights: distance 35% · size 25% · config 20% · recency 20%. Top-matched comps best support the ARV.
Projected returns pro-forma
-3.0% appreciation · 3.0% rent growth · sell at horizon
- IRR
- -13.6%
- Equity multiple
- 0.51×
- Total profit
- $-16,338
- Equity at exit
- $17,877
- IRR
- -4.7%
- Equity multiple
- 0.69×
- Total profit
- $-10,425
- Equity at exit
- $10,367
Cash invested: $33,572 (down + closing). Projections, not guarantees.
Landlord ↔ Tenant lean methodology
- Overall (STATE)
- 83 Strongly Landlord-Friendly
- State Kentucky
- 83 Strongly Landlord-Friendly · R+16
- County
- — inherits STATE
- City
- — inherits STATE
ZIP-level market 42501
- Home prices YoY
- -19.8%
- Active inventory
- 192
- Price-to-rent
- 10.5×
Monthly cashflow live
- Estimated rent
- $950 high interval (Pro) →
- Mortgage (P&I)
- −$629
- Tax from tax record
- −$22 /mo · $270/yr
- Insurance
- −$50
- HOA
- −$0
- Vacancy / Maint / Mgmt
- −$200
- Net cashflow
- $50
Break-even live
Sensitivity live
| Price | -10% $117 | -5% $83 | +0% $50 | +5% $16 | +10% $-18 |
|---|---|---|---|---|---|
| Rent | -10% $-26 | -5% $12 | +0% $50 | +5% $87 | +10% $125 |
| Rate | -1.0pp $110 | -0.5pp $80 | base $50 | +0.5pp $18 | +1.0pp $-13 |
UW: 25.0% down · 7.5% · 30yr · 1.5% tax · 5.0% vac · 8.0% maint · 8.0% mgmt
Financing live
Cash to close
- Down payment
- $29,975
- Closing costs
- $3,597
- Reserves months
- —
- Total cash needed
- —
Loan-product check · same deal, 3 products live
Conventional
25% down · 7.5% · 30yr
- Down + closing
- —
- Monthly P&I
- —
- Monthly cashflow
- —
- DSCR
- —
- Eligible?
- —
Personal DTI + credit; lowest rate.
DSCR
20% down · 8.5% · 30yr
- Down + closing
- —
- Monthly P&I
- —
- Monthly cashflow
- —
- DSCR
- —
- Eligible?
- —
No personal income docs; deal must DSCR.
Hard money
10% down · 12.0% · 12mo
- Down + closing
- —
- Monthly P&I
- —
- Monthly cashflow
- —
- DSCR
- —
- Eligible?
- —
Short-term bridge; refi at stabilization.
Rent comps 9 comps
| Address | Beds | Baths | Sqft | Rent | $/sqft | DOM | Units | Dist |
|---|---|---|---|---|---|---|---|---|
| 46 Sandalwood Way Somerset, KY | 2.0 | 1.0 | 800 | $900 | $1.12 | 45d | 1 | 0.64mi |
| 71 Driftwood Cir Apt 2 Somerset, KY | 2.0 | 1.0 | 921 | $900 | $0.98 | 45d | 1 | 0.68mi |
| 50 Faith Ct Somerset, KY | 2.0–3.0 | 1.5–2.5 | 1225 | $1,025 | $0.84 | 45d | 1 | 0.69mi |
| 19 Driftwood Cir Unit 2 Somerset, KY | 2.0 | 1.0 | 986 | $900 | $0.91 | 45d | 1 | 0.69mi |
| 50 Driftwood Cir Apt 2 Somerset, KY | 2.0 | 1.0 | 921 | $900 | $0.98 | 45d | 1 | 0.70mi |
| 33 Driftwood Cir Apt 1 Somerset, KY | 2.0 | 1.0 | 986 | $900 | $0.91 | 45d | 1 | 0.70mi |
| 709 W Columbia St Somerset, KY | 2.0 | 1.0 | 1000 | $1,000 | $1.00 | 45d | 1 | 1.02mi |
| 115 Beecher St Unit A Somerset, KY | 2.0 | 1.0 | 1000 | $1,200 | $1.20 | 45d | 1 | 1.27mi |
| 67 Margaret Rose Ln Somerset, KY | 2.0 | 2.0 | 1000 | $1,000 | $1.00 | 45d | 1 | 1.36mi |
Listing history 16 events
-
2026-06-01status $119,900 Pending 4 DOM
-
2026-06-01days on market $119,900 Active 4 DOM
-
2026-05-31days on market $119,900 Active 3 DOM
-
2026-05-31days on market $119,900 Active 2 DOM
-
2026-05-28$119,900 Active
-
2025-09-04historical Contingent
-
2025-09-02historical
-
2025-08-13price $109,900
-
2025-07-30status Active
-
2025-06-30historical Contingent
-
2025-06-03price $119,900
-
2025-05-12price $124,900
-
2025-05-01$129,900 Active
-
2021-12-21soldstatus $110,000
-
2021-09-29soldstatus $90,000
-
2013-03-01soldstatus $55,000
ⓘ Source: listings_history table (triggers on properties + properties_extension) + one-shot
backfill from property_details.listing_events for pre-trigger history.
Tax reassessment forecast KY · Resets to sale price
- Current annual tax
- $270 · $22/mo
- Projected year-2 tax
- $1,031 · $86/mo
- Expected delta
- +$762/yr (+$63/mo · 282.6%)
ⓘ Screening estimate from a state-policy table — verify with the county assessor before closing.
Climate risk First Street
- Flood 1/10 Low FEMA zone X (unshaded) · 0% chance over 30 yrs
- Wildfire 3/10 Moderate
- Heat 4/10 Moderate 7 d/yr ≥102°F today · 20 d/yr by 30 yrs out
- Wind 2/10 Low 4% chance of damaging wind over 30 yrs
- Air quality 1/10 Low 0 unhealthy d/yr today · 0 by 30 yrs out
Nearby sold comps map
Loading sold comps map…
Walkable amenities ~0.75 mi
Loading nearby amenities…
Taxation est. · year 1
- Rental income
- $11,403
- − Mortgage interest
- −$6,716
- − Property taxes
- −$270
- − Insurance
- −$600
- − Repairs & maintenance
- −$912
- − Management
- −$912
- − Depreciation
- −$3,488
- Taxable loss
- −$1,495
- Est. tax savings @ 24.0%
- +$359
- After-tax cash flow
- $953/yr
For passive investors: Depreciation is non-cash, so a rental often shows a tax loss while cash-flowing — sheltering income. Rental losses are passive: they offset passive income freely, and up to $25,000/yr can offset ordinary (W-2) income if you actively participate and your MAGI is under $100k (phasing out to $0 by $150k); unused losses carry forward. On sale, claimed depreciation is recaptured at up to 25%, and gains may owe capital-gains tax (a 1031 exchange can defer both). Figures are a year-1 estimate at your 24.0% rate — not tax advice; consult a CPA.
Schools (NCES district)
- District
- Somerset Independent
- NCES district ID
- 2105430
- Math proficiency
- 36% ▼ -17.00%
- Reading proficiency
- 44% ▼ -18.00%
- Median HH income
- $28,554
- Composite
- 32.42/100
- National rank
- #5727
- State rank
- #42 of 165 in KY
Livability — Somerset
- Score
- 67/100
- State rank
- #208
- US rank
- #10207
Category grades
Schools grade is shown separately in the Schools card above.
Census & demographics
- Census place
- Somerset, KY
- Population (ZIP)
- 17,441
Population outlook (Pulaski County) Hauer SSP2
- Today (2025)
- 65,414 people
- By 2030
- 65,828 · +0.6%
- By 2040
- 65,972 · +0.9%
- By 2050
- 65,108 · -0.5%
- By 2075
- 61,647 · -5.8%
- By 2100
- 53,613 · -18.0%
Race, ethnicity, and origin ACS 2023
- Neighborhood character
- Predominantly White (91%)
- Race & ethnicity
- White 91% Two or more races 3% Hispanic / Latino 3% Black 2%
- Common ancestry
- Slovak 3% Serbian 2% Italian 2%
- Foreign-born
- 1%
Political lean MEDSL · Pulaski
- 2024 margin
- Solid R (+65.2) · D 16.9% · R 82.1% · Other 1.0%
- 2008→2024 swing
- -9.9pp toward R · 2008: -55.4pp · 2024: -65.2pp
- All cycles
- 2024: R+65.2 2020: R+62.7 2016: R+66.7 2012: R+60.5 2008: R+55.4
Not yet ingested
- Civics
- —
Market trends
- HPI YoY
- ▼ -70.04%
- Current HPI
- 284.0445
- Rent YoY
- —
- Metro
- —
- State GDP YoY
- ▲ 1.81%
- F500 in state
- 4
Industry mix (Fortune 500 HQ in KY)
| Industry | F500 HQs | Revenue |
|---|---|---|
| Healthcare | 1 | $118B |
|
||
| Food / Beverage | 1 | $7B |
|
||
Price history
+118.0% since first listed12 events — show timeline
- 2026-05-28 Listed $119,900 ImagineMLS
- 2025-09-04 Contingent — ImagineMLS
- 2025-09-02 Listing Removed — ImagineMLS
- 2025-08-13 Price Changed $109,900 ImagineMLS
- 2025-07-30 Relisted — ImagineMLS
- 2025-06-30 Contingent — ImagineMLS
- 2025-06-03 Price Changed $119,900 ImagineMLS
- 2025-05-12 Price Changed $124,900 ImagineMLS
- 2025-05-01 Listed $129,900 ImagineMLS
- 2021-12-21 Sold (Public Records) $110,000 Public Records
- 2021-09-29 Sold (Public Records) $90,000 Public Records
- 2013-03-01 Sold (Public Records) $55,000 Public Records
Property tax history
-7.1%/yrLatest (2025): $270 · -2.7% YoY. Source: county tax records.
Cash-flow waterfall
monthlySold comps — $/sqft
last 12 mo · ≤1 miLoading sold comps…