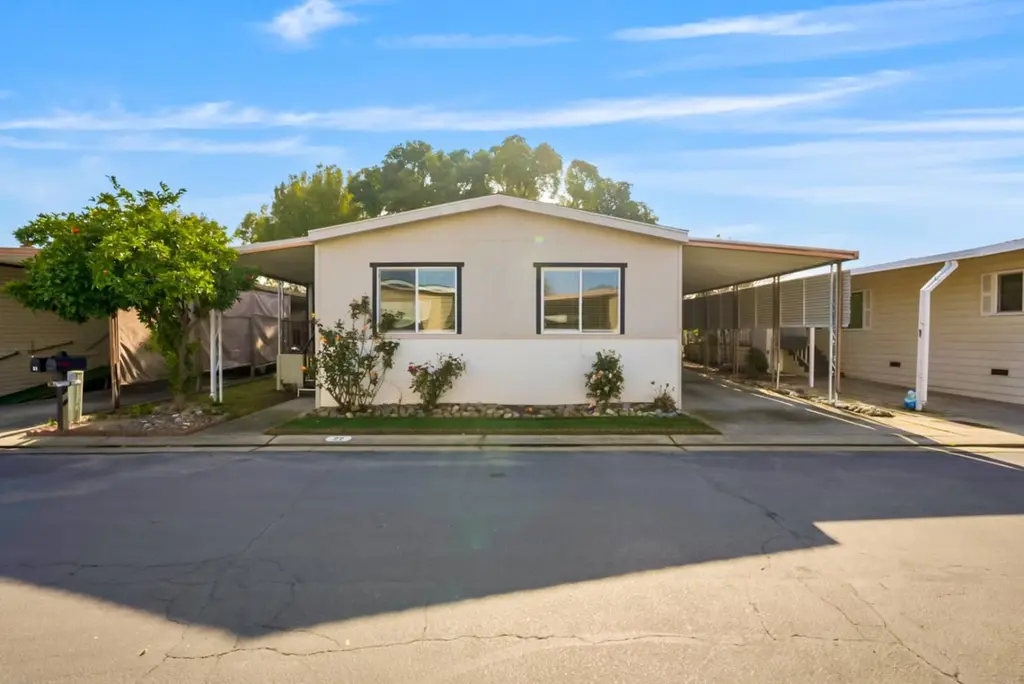
1200 S Carpenter Rd #22 · Modesto, CA
Flood risk 1/10 · Minimal
- FEMA flood zone
- X (unshaded)
- Chance of flooding over 30 yrs
- 0.0%
- Est. flood insurance / yr
- $507 – $1,088
Fire risk 6/10 · Moderate
- Est. fire insurance / yr
- $659 – $1,223
Heat risk 6/10 · Moderate
- Hot days now (above 102°F)
- 7 days/yr
- Hot days in 30 yrs
- 15 days/yr
Wind risk 1/10 · Minimal
- Chance of severe wind over 30 yrs
- —
Air-quality risk 10/10 · Severe
- Unhealthy air days now
- 33 days/yr
- Unhealthy air days in 30 yrs
- 38 days/yr
Risk factors via First Street. Map © Google.
Why this score? — see what drove the C+ grade
The composite is a weighted blend of 9 inputs, each scored 0–100. Each bar is that input's sub-score; the figure is the points it added to the 100-point composite (weight × sub-score).
- Cash flow +30.0/30.0
- 1% rule +10.0/10.0
- DSCR +10.0/10.0
- Condition / age +4.0/5.0
- Livability +3.2/5.0
- Rent growth +2.5/5.0
- Schools +1.7/10.0
- ARV discount +0.2/15.0
- Appreciation +0.0/10.0
$89,900
🖨 Deal sheet 📄 Offer letter ✓ Due diligence
Listing remarks
Welcome to 1200 S. Carpenter Rd, Space #22, a beautifully maintained 2-bedroom, 2-bath mobile home located in a desirable gated community with a pool. Perfect for downsizing or for mom and dad, this home offers comfortable living in a quiet, well-kept setting. Prime central location just minutes from Highway 99, the mall, Costco, pharmacies, car wash, dining, and moreeverything is truly a stone's throw away.
Key facts
- Gated community
- Central location
- Pool
Tags
Property features AI
Finance
- HOA & community: Not part of an association; Located in a senior community; Land lease required ($900 monthly)
Exterior
- Parking: No garage
- Utilities: Public water; Public sewer
- Home design: Manufactured home (double wide) located in a park; Built in 1981; Skirted with wood
- Construction: Shingle roof; Modiline make
- Exterior features: Landscaped front
Interior
- Kitchen: Dishwasher; Electric cooktop
- Bedrooms: 2 bedrooms
- Flooring: Vinyl flooring
- Bathrooms: 2 full bathrooms with tub and separate shower stall(s)
- Heating & cooling: Central heating; Central air conditioning
- Interior features: Stone and laminate countertops; Kitchen open to family/dining area; Living room with unspecified additional feature
- Laundry & utility: Indoor laundry area with 220V outlet
Neighborhood map
What this means for you Summary
Snapshot
- This is a 2-bed/2.0-bath manufactured listed at $90k. Condition is rated good.
Deal economics
- At list price, monthly cash flow is $477 ($6k/yr) — positive.
- The deal already cash-flows at list — no discount required.
- Meets the 1% rule at list price ($1k rent vs $90k).
- Recommended offer: $89k (1.5% below list) — sets the bar for market timing.
- Cap rate 12.7% vs local median 3.2% in Modesto — top-decile yield for the area; either an underpriced asset or a hidden risk that comps aren't pricing in. Stress-test before assuming the spread holds.
Location & tenants
- Location reads 63/100 on livability (#451 in CA) — a middle-class / working-renter tenant base. Strengths: housing A+; Watch: amenities C-, schools D+, health & safety D+.
- Modesto City Elementary (urban): math 15% / reading 26% proficiency, ranked #462 of 517 in CA (top 89%) — low school quality limits family demand, transient renter base, plan for 1-2y turnover; 77% free/reduced lunch — lower-income household profile, screen leases tightly.
- Market conditions: 109 active listings in the ZIP; 2 comparable units currently listed for rent nearby; 923 units permitted in Stanislaus County in 2024 (63 in 5+ unit buildings).
Forward outlook
- Local home prices are declining (-3.0%/yr); year-one equity from $622 of loan paydown is wiped out by about $3k of value loss. Plan a longer hold.
- Stanislaus County population projected at +14% by 2050 — modest demand growth; plan on rents tracking national, not racing it.
- At projected returns (-3.0% appreciation + 3.0% rent growth), your $25k cash investment doubles in ~6 years — after that, you're playing with house money.
Negotiation context
- It's been on market 23 days — a 2% lower offer ($89k) is reasonable based on typical stale-listing flexibility.
Risks & watch-outs
- Climate carrying-cost: major wildfire risk; extreme-heat days projected 7→15/yr by 2055 (HVAC capex compounding) — expect insurance premiums to compound above CPI over the hold.
Questions for the listing agent
- Is there a deadline driving the sale (1031 exchange, divorce, estate, relocation)? That informs how much negotiation room exists.
- Schools are D-rated, which usually means shorter tenancies and higher turnover. Who's the typical renter profile here, and what's been the actual vacancy rate?
- Crime grade is F in this area — have there been break-ins, vandalism, or insurance claims at this property in the last 3 years? What carrier currently insures it and at what premium?
- What's the average days-on-market for RENTAL listings here right now (not sales)? A rising rental-DOM trend means longer vacancies and softer asking-rent achievability than the comps imply.
- What's the recent tenant-quality profile in this submarket — average credit score on applications, eviction rate, late-payment / NSF rate, and stable-employment percentage? A property-management company in the area should have these aggregated.
- How much new for-sale + rental construction is in the pipeline within 1–3 miles? Heavy new supply typically softens prices + rents 12–24 months out; constrained supply supports both.
Investment metrics
- 1% rule
- 1.55% ✓
- Cap rate
- 12.67%
- Cash-on-cash
- 22.76%
- DSCR
- 2.01
- GRM
- 5.4
CMA / ARV
- ARV (on-the-fly)
- $77,376
- Comps found
- 7
Show comp detail 7 sales within ~0.75 mi
| Address | Dist | Beds/Ba | Sqft | Sold | Price | $/sf | Match |
|---|---|---|---|---|---|---|---|
| 1200 S Carpenter Rd #144 | 0.13mi | 2/2.0 | 1,344 (+8%) | 1mo | $83,000 | $62 | 80 |
| 1200 S Carpenter Rd #66 | 0.20mi | 2/2.0 | 1,248 (0%) | 15mo | $85,000 | $68 | 79 |
| 1200 S Carpenter Rd #74 | 0.13mi | 3/2.0 (+1) | 1,248 (0%) | 15mo | $55,000 | $44 | 76 |
| 1200 S Carpenter Rd #72 | 0.00mi | 2/2.0 | 1,344 (+8%) | 16mo | $89,800 | $67 | 74 |
| 1200 S Carpenter Rd #133 | 0.00mi | 3/2.0 (+1) | 1,344 (+8%) | 11mo | $90,000 | $67 | 73 |
| 1200 S Carpenter Rd #40 | 0.12mi | 2/2.0 | 1,344 (+8%) | 18mo | $50,000 | $37 | 67 |
| 1200 Carpenter Rd | 0.06mi | 2/2.0 | 1,080 (-14%) | 17mo | $35,000 | $32 | 61 |
Match score weights: distance 35% · size 25% · config 20% · recency 20%. Top-matched comps best support the ARV.
Projected returns pro-forma
-3.0% appreciation · 3.0% rent growth · sell at horizon
- IRR
- 15.7%
- Equity multiple
- 1.63×
- Total profit
- $15,861
- Equity at exit
- $13,404
- IRR
- 24.3%
- Equity multiple
- 3.11×
- Total profit
- $53,051
- Equity at exit
- $7,773
Cash invested: $25,172 (down + closing). Projections, not guarantees.
Landlord ↔ Tenant lean methodology
- Overall (STATE)
- 18 Strongly Tenant-Friendly
- State California
- 18 Strongly Tenant-Friendly · D+13
- County
- — inherits STATE
- City
- — inherits STATE
ZIP-level market 95351
- Active inventory
- 109
- Price-to-rent
- 5.4×
Monthly cashflow live
- Estimated rent
- $1,391 medium interval (Pro) →
- Mortgage (P&I)
- −$471
- Tax est. 1.5%
- −$112 /mo · $1,348/yr
- Insurance
- −$37
- HOA
- −$0
- Vacancy / Maint / Mgmt
- −$292
- Net cashflow
- $477
Break-even live
UW: 25.0% down · 7.5% · 30yr · 1.5% tax · 5.0% vac · 8.0% maint · 8.0% mgmt
Financing live
Cash to close
- Down payment
- $22,475
- Closing costs
- $2,697
- Reserves months
- —
- Total cash needed
- —
Loan-product check · same deal, 3 products live
Conventional
25% down · 7.5% · 30yr
- Down + closing
- —
- Monthly P&I
- —
- Monthly cashflow
- —
- DSCR
- —
- Eligible?
- —
Personal DTI + credit; lowest rate.
DSCR
20% down · 8.5% · 30yr
- Down + closing
- —
- Monthly P&I
- —
- Monthly cashflow
- —
- DSCR
- —
- Eligible?
- —
No personal income docs; deal must DSCR.
Hard money
10% down · 12.0% · 12mo
- Down + closing
- —
- Monthly P&I
- —
- Monthly cashflow
- —
- DSCR
- —
- Eligible?
- —
Short-term bridge; refi at stabilization.
Rent comps 2 comps
| Address | Beds | Baths | Sqft | Rent | $/sqft | DOM | Units | Dist |
|---|---|---|---|---|---|---|---|---|
| 814 2nd St Unit 2 Modesto, CA | 2.0 | 1.0 | 700 | $1,350 | $1.93 | 21d | 1 | 1.26mi |
| 909 4th St Unit a Modesto, CA | 1.0 | 1.0 | 758 | $900 | $1.19 | 21d | 1 | 1.35mi |
Listing history 16 events
-
2026-06-18days on market $89,900 Active 23 DOM
-
2026-06-17days on market $89,900 Active 22 DOM
-
2026-06-16days on market $89,900 Active 21 DOM
-
2026-06-15days on market $89,900 Active 20 DOM
-
2026-06-14days on market $89,900 Active 18 DOM
-
2026-06-13days on market $89,900 Active 17 DOM
-
2026-06-10days on market $89,900 Active 15 DOM
-
2026-06-09days on market $89,900 Active 14 DOM
-
2026-06-08days on market $89,900 Active 13 DOM
-
2026-06-07days on market $89,900 Active 12 DOM
-
2026-06-05days on market $89,900 Active 9 DOM
-
2026-06-03days on market $89,900 Active 8 DOM
-
2026-06-02days on market $89,900 Active 7 DOM
-
2026-06-01days on market $89,900 Active 6 DOM
-
2026-05-31days on market $89,900 Active 5 DOM
-
2026-05-30days on market $89,900 Active 4 DOM
ⓘ Source: listings_history table (triggers on properties + properties_extension) + one-shot
backfill from property_details.listing_events for pre-trigger history.
Climate risk First Street
- Flood 1/10 Low FEMA zone X (unshaded) · 0% chance over 30 yrs
- Wildfire 6/10 Major
- Heat 6/10 Major 7 d/yr ≥102°F today · 15 d/yr by 30 yrs out
- Wind 1/10 Low
- Air quality 10/10 Extreme 33 unhealthy d/yr today · 38 by 30 yrs out
Nearby sold comps map
Loading sold comps map…
Walkable amenities ~0.75 mi
Loading nearby amenities…
Taxation est. · year 1
- Rental income
- $16,689
- − Mortgage interest
- −$5,036
- − Property taxes
- −$1,348
- − Insurance
- −$450
- − Repairs & maintenance
- −$1,335
- − Management
- −$1,335
- − Depreciation
- −$2,615
- Taxable income
- $4,570
- Est. tax owed @ 24.0%
- −$1,097
- After-tax cash flow
- $4,632/yr
For passive investors: Depreciation is non-cash, so a rental often shows a tax loss while cash-flowing — sheltering income. Rental losses are passive: they offset passive income freely, and up to $25,000/yr can offset ordinary (W-2) income if you actively participate and your MAGI is under $100k (phasing out to $0 by $150k); unused losses carry forward. On sale, claimed depreciation is recaptured at up to 25%, and gains may owe capital-gains tax (a 1031 exchange can defer both). Figures are a year-1 estimate at your 24.0% rate — not tax advice; consult a CPA.
Condition & rehab AI · 12 photos
This well-maintained mobile home in a desirable gated community offers a good investment opportunity with minimal repairs and potential for value enhancement through cosmetic updates.
Value-add opportunities
- Resale Paint exterior siding — Fresh paint can enhance curb appeal and home value.
- Both Replace ceiling fans with modern fixtures — Modern fans can improve aesthetics and energy efficiency.
- Both Install smart home devices — Smart home devices can increase convenience and property value.
- Both Add outdoor lighting — Outdoor lighting can enhance safety and curb appeal.
- Resale Upgrade kitchen appliances — Upgraded appliances can attract more buyers and increase value.
- Both Install a smart thermostat — A smart thermostat can improve energy efficiency and comfort, increasing property value.
- Both Add a small garden or planter box — A small garden can enhance curb appeal and add value to the property.
Renovation cost estimate screening
Value-add ROI direction
- Resale Paint exterior siding — Fresh paint can enhance curb appeal and home value. ↑
- Both Replace ceiling fans with modern fixtures — Modern fans can improve aesthetics and energy efficiency. ↑
- Both Install smart home devices — Smart home devices can increase convenience and property value. ↑
- Both Add outdoor lighting — Outdoor lighting can enhance safety and curb appeal. ↑
- Resale Upgrade kitchen appliances — Upgraded appliances can attract more buyers and increase value. ↑
- Both Install a smart thermostat — A smart thermostat can improve energy efficiency and comfort, increasing property value. ↑
- Both Add a small garden or planter box — A small garden can enhance curb appeal and add value to the property. ↑
ⓘ Cost ranges are severity-bucket heuristics (US national rule-of-thumb). Get contractor quotes + a written scope before underwriting a rehab budget.
Schools (NCES district)
- District
- Modesto City Elementary
- NCES district ID
- 0625130
- Math proficiency
- 15% ▼ -7.00%
- Reading proficiency
- 26% ▼ -5.00%
- Median HH income
- $39,725
- Composite
- 17.31/100
- National rank
- #9083
- State rank
- #462 of 517 in CA
Livability — Modesto
- Score
- 63/100
- State rank
- #451
- US rank
- #15229
Category grades
Schools grade is shown separately in the Schools card above.
Census & demographics
- Census place
- Modesto, CA
- County
- Stanislaus County · 445,786 people
- City population
- 225,261
- Metro
- Modesto, CA
- Population (ZIP)
- 48,498
- Household income
- $58,275
- Rent vs Own
- Severe rent burden
- 1964.0
Population outlook (Stanislaus County) Hauer SSP2
- Today (2025)
- 579,493 people
- By 2030
- 598,000 · +3.2%
- By 2040
- 630,930 · +8.9%
- By 2050
- 658,300 · +13.6%
- By 2075
- 712,363 · +22.9%
- By 2100
- 719,805 · +24.2%
Race, ethnicity, and origin ACS 2023
- Neighborhood character
- Predominantly Hispanic (76%)
- Race & ethnicity
- Hispanic / Latino 76% Two or more races 40% White 13% Asian 5% Black 3% Native American 2%
- Hispanic origin (detail)
- Mexican 72%
- Common ancestry
- Russian 1% Lithuanian 1% Slovak 1%
- Foreign-born
- 30% · Canada
- Languages at home
- 34% English-only · Spanish 62% Other Asian/Pacific 2% Other Indo-European 1%
Political lean MEDSL · Stanislaus
- 2024 margin
- R (+11.0) · D 43.2% · R 54.2% · Other 2.6%
- 2008→2024 swing
- -12.7pp toward R · 2008: 1.7pp · 2024: -11.0pp
- All cycles
- 2024: R+11.0 2020: D+0.8 2016: D+0.6 2012: D+0.7 2008: D+1.7
Not yet ingested
- Civics
- —
Market trends
- HPI YoY
- ▼ -405.77%
- Current HPI
- 360.246
- Rent YoY
- —
- Metro
- Modesto, CA
- State GDP YoY
- ▲ 3.21%
- F500 in state
- 116
Industry mix (Fortune 500 HQ in CA)
| Industry | F500 HQs | Revenue |
|---|---|---|
| Technology | 27 | $1,492B |
|
||
| Financial Services | 3 | $174B |
|
||
| Retail | 3 | $44B |
|
||
| Insurance | 3 | $26B |
|
||
| Media / Entertainment | 2 | $115B |
|
||
| Pharmaceuticals / Biotech | 2 | $62B |
|
||
Cash-flow waterfall
monthlySold comps — $/sqft
last 12 mo · ≤1 miLoading sold comps…