7561 NW 16th St #2305 · Plantation, FL
Flood risk 1/10 · Minimal
- FEMA flood zone
- X (shaded)
- Chance of flooding over 30 yrs
- 0.0%
- Est. flood insurance / yr
- $507 – $1,088
Fire risk 1/10 · Minimal
- Est. fire insurance / yr
- $947 – $1,759
Heat risk 10/10 · Severe
- Hot days now (above 105°F)
- 7 days/yr
- Hot days in 30 yrs
- 26 days/yr
Wind risk 10/10 · Severe
- Chance of severe wind over 30 yrs
- 99.0%
Air-quality risk 2/10 · Minimal
- Unhealthy air days now
- 2 days/yr
- Unhealthy air days in 30 yrs
- 2 days/yr
Risk factors via First Street. Map © Google.
Why this score? — see what drove the C- grade
The composite is a weighted blend of 9 inputs, each scored 0–100. Each bar is that input's sub-score; the figure is the points it added to the 100-point composite (weight × sub-score).
- Cash flow +18.6/30.0
- 1% rule +7.6/10.0
- ARV discount +7.5/15.0
- DSCR +5.8/10.0
- Schools +4.1/10.0
- Livability +4.1/5.0
- Rent growth +2.6/5.0
- Condition / age +2.5/5.0
- Appreciation +0.0/10.0
$170,000
🖨 Deal sheet 📄 Offer letter ✓ Due diligence
Listing remarks
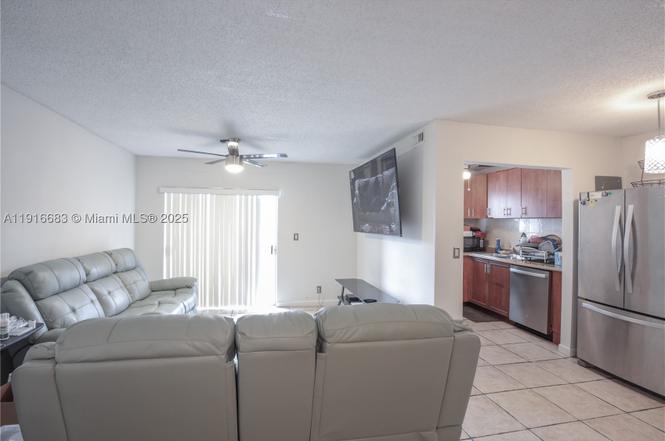
Welcome to your slice of paradise in Plantation, Florida! Nestled in the heart of this vibrant community, this two bedroom, one and a half bathroom condo offers a welcoming ambiance, perfect for entertaining guests or simply unwinding after a long day. Enjoy the private screened balconies, where you can savor your morning coffee or enjoy serene views of the surrounding landscape. When it's time to cool off and relax, look no further than the community pool and take a refreshing dip or lounge poolside while soaking up the warm Florida weather. Conveniently located in Plantation, you'll have easy access to a myriad of dining, shopping, and entertainment options. Schedule your private tour tod
Key facts
- Community pool
- $521 HOA
- Parking
Tags
Property features AI
Finance
- Other: Association pool
- Financial info: Pets: No (no pet restrictions indicated)
- HOA & community: Monthly association fee; Association amenities: elevator(s), pool; Association fee covers: amenities, common areas, trash, water
Exterior
- Parking: Assigned parking (one space)
- Utilities: Water included in association fee
- Home design: 4-story building; Entry on level 3; Attached property
- Construction: Block construction; Resale property
- Exterior features: Balcony; Screened porch/balcony; Association pool
Interior
- Kitchen: Electric range; Microwave; Dishwasher; Refrigerator
- Flooring: Carpet; Tile; Vinyl
- Bathrooms: 1 full bathroom; 1 half bathroom
- Heating & cooling: Central heating; Central air conditioning
- Interior features: Unfurnished; Balcony; Screened balcony; Has view
- Laundry & utility: Washer; Dryer
Neighborhood map
What this means for you Summary
Snapshot
- This is a 2-bed/2.0-bath condo listed at $170k.
Deal economics
- At list price, monthly cash flow is $165 ($2k/yr) — positive.
- The deal already cash-flows at list — no discount required.
- Meets the 1% rule at list price ($2k rent vs $170k).
- Recommended offer: $150k (12.0% below list) — sets the bar for market timing.
- Cap rate 7.5% vs local median 3.4% in Plantation — top-decile yield for the area; either an underpriced asset or a hidden risk that comps aren't pricing in. Stress-test before assuming the spread holds.
Location & tenants
- Location reads 82/100 on livability (#70 in FL, #1,174 nationally) — a professional / high-income tenant draw. Strengths: commute A+, housing A+, health & safety A+; Watch: amenities C-, cost of living D-.
- Broward (suburban): math 42% / reading 53% proficiency, ranked #46 of 73 in FL (top 63%) — families likely to look elsewhere, expect single-tenant / working-renter base with shorter leases.
- Market conditions: Rents flat; 656 active listings in the ZIP; 40 comparable units currently listed for rent nearby; rentals at typical pace (median 17d on market — plan ~3-4 weeks tenant-placement turnaround); 2,111 units permitted in Broward County in 2024 (1,265 in 5+ unit buildings).
- At $2,150/mo this rent would consume 56% of the median local household income ($46k/yr) (locally 5692% of renters already pay >50% of income on rent) — very limited rent-growth headroom before tenants either downsize or default.
Forward outlook
- Local home prices are declining (-3.0%/yr); year-one equity from $1k of loan paydown is wiped out by about $5k of value loss. Plan a longer hold.
- Broward County population projected at +34% by 2050 — long-run rental-demand tailwind backs the buy-and-hold thesis.
Negotiation context
- It's been on market 212 days — a 12% lower offer ($150k) is reasonable based on typical stale-listing flexibility.
- 7 sale attempts since 2y ago with the ask held roughly flat each time — persistent listings suggest the price (not the market) is what's stuck; bring a comps-based counter.
- Current owner paid $39k; list at $170k implies a 336% gain — meaningful room to come down on a strong offer.
Risks & watch-outs
- Watch-outs: HOA is 24% of rent.
- Climate carrying-cost: severe wind risk, 99% chance of damaging wind over 30y; extreme-heat days projected 7→26/yr by 2055 (HVAC capex compounding) — expect insurance premiums to compound above CPI over the hold.
Questions for the listing agent
- It's been on market 212 days. Have you received any prior offers? Is the seller open to a 12% concession, seller financing, or rate buy-down credit?
- Built in 1976 — when were the roof, HVAC, electrical panel, plumbing, and water heater last replaced?
- What does the HOA fee cover, when was the last increase, and are there any pending special assessments or reserve-fund shortfalls?
- Any open or pending special assessments — roof, HVAC, plumbing, elevator, façade? What's the per-unit balance and payoff schedule, and is the seller paying it off at close or rolling it to the buyer?
- Why hasn't it sold? Are there any deal-killer items the seller is aware of (foundation, flood, title, zoning, code violations)?
- Is there a deadline driving the sale (1031 exchange, divorce, estate, relocation)? That informs how much negotiation room exists.
- Schools are B-rated — typically a magnet for longer-tenancy family renters. What's the average tenant stay here, and is there a school-zone premium baked into asking?
- What's the average days-on-market for RENTAL listings here right now (not sales)? A rising rental-DOM trend means longer vacancies and softer asking-rent achievability than the comps imply.
- What's the recent tenant-quality profile in this submarket — average credit score on applications, eviction rate, late-payment / NSF rate, and stable-employment percentage? A property-management company in the area should have these aggregated.
- How much new apartment / multifamily construction is in the pipeline within 1–3 miles? Heavy new supply (>2% of stock underway) typically softens rents 12–24 months out; light construction supports rent growth.
Investment metrics
- 1% rule
- 1.26% ✓
- Cap rate
- 7.46%
- Cash-on-cash
- 4.16%
- DSCR
- 1.18
- GRM
- 6.6
CMA / ARV
No comps found within radius.
Projected returns pro-forma
-3.0% appreciation · 0.26% rent growth · sell at horizon
- IRR
- -13.6%
- Equity multiple
- 0.53×
- Total profit
- $-22,565
- Equity at exit
- $25,348
- IRR
- -11.4%
- Equity multiple
- 0.42×
- Total profit
- $-27,515
- Equity at exit
- $14,698
Cash invested: $47,600 (down + closing). Projections, not guarantees.
Landlord ↔ Tenant lean methodology
- Overall (STATE)
- 87 Strongly Landlord-Friendly
- State Florida
- 87 Strongly Landlord-Friendly · R+3
- County
- — inherits STATE
- City
- — inherits STATE
ZIP-level market 33313
- Rents YoY
- 0.3%
- Active inventory
- 656
- Price-to-rent
- 6.6×
Monthly cashflow live
- Estimated rent
- $2,150 high interval (Pro) →
- Mortgage (P&I)
- −$891
- Tax from tax record
- −$51 /mo · $607/yr
- Insurance
- −$71
- HOA
- −$521
- Vacancy / Maint / Mgmt
- −$452
- Net cashflow
- $165
Break-even live
UW: 25.0% down · 7.5% · 30yr · 1.5% tax · 5.0% vac · 8.0% maint · 8.0% mgmt
Financing live
Cash to close
- Down payment
- $42,500
- Closing costs
- $5,100
- Reserves months
- —
- Total cash needed
- —
Loan-product check · same deal, 3 products live
Conventional
25% down · 7.5% · 30yr
- Down + closing
- —
- Monthly P&I
- —
- Monthly cashflow
- —
- DSCR
- —
- Eligible?
- —
Personal DTI + credit; lowest rate.
DSCR
20% down · 8.5% · 30yr
- Down + closing
- —
- Monthly P&I
- —
- Monthly cashflow
- —
- DSCR
- —
- Eligible?
- —
No personal income docs; deal must DSCR.
Hard money
10% down · 12.0% · 12mo
- Down + closing
- —
- Monthly P&I
- —
- Monthly cashflow
- —
- DSCR
- —
- Eligible?
- —
Short-term bridge; refi at stabilization.
Rent comps 40 comps
| Address | Beds | Baths | Sqft | Rent | $/sqft | DOM | Units | Dist |
|---|---|---|---|---|---|---|---|---|
| 7561 NW 16th St Plantation, FL | 2.0 | 2.0 | 1080 | $1,875 | $1.74 | 22d | 3 | 0.05mi |
| 7561 NW 16th St Plantation, FL | 2.0 | 2.0 | 1080 | $1,950 | $1.81 | 2d | 2 | 0.05mi |
| 7561 NW 16th St Plantation, FL | 2.0 | 2.0 | 1080 | $1,950 | $1.81 | 7d | 2 | 0.05mi |
| 7401 NW 16th St #407 Plantation, FL | 2.0 | 2.0 | 970 | $2,100 | $2.16 | 14d | 1 | 0.20mi |
| 1751 NW 75th Ave #211 Plantation, FL | 1.0 | 2.0 | 943 | $1,700 | $1.80 | 24d | 1 | 0.21mi |
| 1752 NW 72nd Ave #83 Plantation, FL | 2.0 | 2.0 | 1175 | $2,300 | $1.96 | 22d | 1 | 0.36mi |
| 1752 NW 72nd Ave #83 Plantation, FL | 2.0 | 2.0 | 1175 | $2,300 | $1.96 | 7d | 1 | 0.36mi |
| 1711 N University Dr Plantation, FL | 1.0–3.0 | 1.0–2.0 | 986 | $2,751 | $2.79 | 1d | 41 | 0.47mi |
| 7001 NW 16th St Plantation, FL | 1.0–2.0 | 1.0–2.0 | 1015 | $2,355 | $2.32 | 3d | 17 | 0.48mi |
| 7021 NW 15th St Unit B Plantation, FL | 2.0 | 1.0 | 765 | $2,450 | $3.20 | 16d | 1 | 0.49mi |
| 7620 NW 21st St Sunrise, FL | 3.0 | 2.0 | 1082 | $2,750 | $2.54 | 14d | 1 | 0.51mi |
| 8101 NW 14th St Plantation, FL | 1.0–2.0 | 1.5–2.0 | 1123 | $2,619 | $2.33 | 1d | 11 | 0.53mi |
| 1661 NW 81st Way #1661 Plantation, FL | 2.0 | 2.0 | 1034 | $2,500 | $2.42 | 24d | 1 | 0.58mi |
| 1661 NW 81st Way #1661 Plantation, FL | 2.0 | 2.0 | 1034 | $2,400 | $2.32 | 2d | 1 | 0.58mi |
| 1659 NW 81st Way Unit 1659 Plantation, FL | 2.0 | 2.0 | 1034 | $2,400 | $2.32 | 24d | 1 | 0.58mi |
| 1619 NW 81st Way Unit 1619 Plantation, FL | 1.0 | 1.0 | 832 | $1,925 | $2.31 | 7d | 1 | 0.58mi |
| 1171 Lakepointe Lndg Plantation, FL | 2.0 | 1.0–2.0 | 837 | $2,889 | $3.45 | 2d | 21 | 0.60mi |
| 1031 NW 79th Ave #1031 Plantation, FL | 2.0 | 2.0 | 1062 | $2,400 | $2.26 | 18d | 1 | 0.65mi |
| 7510 NW 23rd St Sunrise, FL | 3.0 | 2.0 | 1432 | $3,150 | $2.20 | 7d | 1 | 0.65mi |
| 7620 S Aragon Blvd Sunrise, FL | 3.0 | 2.0 | 1452 | $3,250 | $2.24 | 24d | 1 | 0.67mi |
| 6901 W Sunrise Blvd Plantation, FL | 1.0–3.0 | 1.0–2.0 | 1037 | $2,502 | $2.41 | 2d | 42 | 0.67mi |
| 7461 NW 23rd St Sunrise, FL | 2.0 | 1.0 | 1181 | $2,926 | $2.48 | 22d | 1 | 0.70mi |
| 7461 NW 23rd St Sunrise, FL | 2.0 | 1.0 | 896 | $2,550 | $2.85 | 13d | 1 | 0.70mi |
| 6815 NW 14th St Unit 6815 Plantation, FL | 1.0 | 1.0 | 1470 | $1,350 | $0.92 | 13d | 1 | 0.71mi |
| 8423 NW 12th St Unit C67 Plantation, FL | 1.0 | 2.0 | 1046 | $2,050 | $1.96 | 7d | 1 | 0.72mi |
| 8080 NW 10th Ct Plantation, FL | 2.0 | 2.0 | 1111 | $2,300 | $2.07 | 24d | 1 | 0.73mi |
| 8080 NW 10th Ct Plantation, FL | 1.0 | 1.0 | 862 | $1,875 | $2.18 | 20d | 1 | 0.73mi |
| 962 NW 79th Ter Plantation, FL | 2.0 | 2.0 | 1432 | $2,997 | $2.09 | 24d | 1 | 0.74mi |
| 8536 NW 12th Ct Plantation, FL | 2.0 | 2.0 | 1138 | $2,625 | $2.31 | 16d | 1 | 0.78mi |
| 6821-6825 NW 11th Pl Unit 6825 Plantation, FL | 3.0 | 2.0 | 1481 | $2,900 | $1.96 | 11d | 1 | 0.78mi |
| 1140 NW 85th Ave Unit A16 Plantation, FL | 2.0 | 1.5 | 1065 | $1,950 | $1.83 | 24d | 1 | 0.79mi |
| 2330 NW 72nd Ave Sunrise, FL | 1.0–2.0 | 1.0 | 742 | $1,900 | $2.56 | 24d | 1 | 0.85mi |
| 8310 NW 24th Pl Sunrise, FL | 2.0 | 1.0 | 900 | $2,400 | $2.67 | 18d | 1 | 0.85mi |
| 7885 NW 7th Ct #406 Plantation, FL | 3.0 | 2.5 | 1340 | $2,800 | $2.09 | 10d | 1 | 0.87mi |
| 2400 E Aragon Blvd #2 Sunrise, FL | 2.0 | 2.0 | 1452 | $2,700 | $1.86 | 24d | 1 | 0.88mi |
| 7903 NW 7th Ct Unit 7903 Plantation, FL | 3.0 | 2.5 | 1340 | $2,800 | $2.09 | 22d | 1 | 0.90mi |
| 6620 NW 21st Ct Sunrise, FL | 1.0 | 1.0 | 1431 | $1,350 | $0.94 | 17d | 1 | 0.98mi |
| 1611 NW 63rd Ave Unit 2 Sunrise, FL | 1.0 | 1.0 | 750 | $1,350 | $1.80 | 24d | 1 | 1.01mi |
| 2534 NW 73rd Ave Sunrise, FL | 1.0 | 1.0 | 950 | $1,750 | $1.84 | 24d | 1 | 1.06mi |
| 8000 Cleary Blvd Plantation, FL | 2.0–3.0 | 2.0–3.0 | 1357 | $2,548 | $1.88 | 1d | 21 | 1.06mi |
HOA detail condo
- Monthly dues
- $521 · $6,252/yr
- Likely covers
- pool
- Assessments
- None detected in remarks — confirm with the listing agent.
Listing history 31 events
-
2026-06-18days on market $170,000 Active 212 DOM
-
2026-06-17days on market $170,000 Active 211 DOM
-
2026-06-16days on market $170,000 Active 210 DOM
-
2026-06-15days on market $170,000 Active 209 DOM
-
2026-06-13days on market $170,000 Active 207 DOM
-
2026-06-09days on market $170,000 Active 203 DOM
-
2026-06-07days on market $170,000 Active 201 DOM
-
2026-06-04days on market $170,000 Active 198 DOM
-
2026-06-03days on market $170,000 Active 197 DOM
-
2026-06-02days on market $170,000 Active 196 DOM
-
2026-06-01days on market $170,000 Active 195 DOM
-
2026-05-31days on market $170,000 Active 194 DOM
-
2025-11-18$170,000 Active
-
2025-11-18historical
-
2025-07-09status Active
-
2025-07-07historical
-
2025-01-11price $170,000
-
2025-01-11status Active
-
2025-01-04historical Active Under Contract
-
2024-12-24status Active
-
2024-12-20historical Active Under Contract
-
2024-11-09price $175,000
-
2024-09-24price $180,000
-
2024-08-25status Active
-
2024-07-27historical Active Under Contract
-
2024-07-19price $185,000
-
2024-07-16price $180,000
-
2024-05-29status Active
-
2024-05-24historical Active Under Contract
-
2024-03-11$185,000 Active
-
1996-05-15soldstatus $39,000
ⓘ Source: listings_history table (triggers on properties + properties_extension) + one-shot
backfill from property_details.listing_events for pre-trigger history.
Tax reassessment forecast FL · Resets to sale price
- Current annual tax
- $607 · $51/mo
- Projected year-2 tax
- $1,411 · $118/mo
- Expected delta
- +$804/yr (+$67/mo · 132.4%)
ⓘ Screening estimate from a state-policy table — verify with the county assessor before closing.
Climate risk First Street
- Flood 1/10 Low FEMA zone X (shaded) · 0% chance over 30 yrs
- Wildfire 1/10 Low
- Heat 10/10 Extreme 7 d/yr ≥105°F today · 26 d/yr by 30 yrs out
- Wind 10/10 Extreme 99% chance of damaging wind over 30 yrs
- Air quality 2/10 Low 2 unhealthy d/yr today · 2 by 30 yrs out
Nearby sold comps map
Loading sold comps map…
Walkable amenities ~0.75 mi
Loading nearby amenities…
Taxation est. · year 1
- Rental income
- $25,804
- − Mortgage interest
- −$9,523
- − Property taxes
- −$607
- − Insurance
- −$850
- − Repairs & maintenance
- −$2,064
- − Management
- −$2,064
- − HOA
- −$6,252
- − Depreciation
- −$4,945
- Taxable loss
- −$502
- Est. tax savings @ 24.0%
- +$120
- After-tax cash flow
- $2,099/yr
For passive investors: Depreciation is non-cash, so a rental often shows a tax loss while cash-flowing — sheltering income. Rental losses are passive: they offset passive income freely, and up to $25,000/yr can offset ordinary (W-2) income if you actively participate and your MAGI is under $100k (phasing out to $0 by $150k); unused losses carry forward. On sale, claimed depreciation is recaptured at up to 25%, and gains may owe capital-gains tax (a 1031 exchange can defer both). Figures are a year-1 estimate at your 24.0% rate — not tax advice; consult a CPA.
Schools (NCES district)
- District
- Broward
- NCES district ID
- 1200180
- Math proficiency
- 42% ▼ -18.00%
- Reading proficiency
- 53% ▼ -5.00%
- Median HH income
- $52,139
- Composite
- 40.88/100
- National rank
- #3621
- State rank
- #46 of 73 in FL
Livability — Plantation
- Score
- 82/100
- State rank
- #70
- US rank
- #1174
Category grades
Schools grade is shown separately in the Schools card above.
Census & demographics
- Census place
- Plantation, FL
- County
- Broward County · 1,963,430 people
- City population
- 111,690
- Metro
- Miami-Fort Lauderdale-Pompano Beach, FL
- Population (ZIP)
- 62,807
- Household income
- $46,305
- Rent vs Own
- Severe rent burden
- 5692.0
Population outlook (Broward County) Hauer SSP2
- Today (2025)
- 2,207,033 people
- By 2030
- 2,360,704 · +7.0%
- By 2040
- 2,661,208 · +20.6%
- By 2050
- 2,946,698 · +33.5%
- By 2075
- 3,602,273 · +63.2%
- By 2100
- 3,970,984 · +79.9%
Race, ethnicity, and origin ACS 2023
- Neighborhood character
- Predominantly Black (77%)
- Race & ethnicity
- Black 77% Hispanic / Latino 12% Two or more races 8% White 7% Asian 2%
- Hispanic origin (detail)
- Puerto Rican 2% Cuban 3% Dominican 1%
- Common ancestry
- Hispanic 20%
- Foreign-born
- 39% · Canada, Jamaica, Dominican Republic
- Languages at home
- 66% English-only · French/Haitian/Cajun 22% Spanish 10%
Political lean MEDSL · Broward
- 2024 margin
- D (+17.0) · D 58.0% · R 41.0%
- 2008→2024 swing
- -17.8pp toward R · 2008: 34.7pp · 2024: 17.0pp
- All cycles
- 2024: D+17.0 2020: D+29.8 2016: D+35.0 2012: D+34.9 2008: D+34.7
Not yet ingested
- Civics
- —
Market trends
- HPI YoY
- ▼ -338.15%
- Current HPI
- 288.9345
- Rent YoY
- ▲ 0.26%
- Metro
- Miami-Fort Lauderdale-Pompano Beach, FL
- State GDP YoY
- ▲ 3.28%
- F500 in state
- 36
Industry mix (Fortune 500 HQ in FL)
| Industry | F500 HQs | Revenue |
|---|---|---|
| Industrial Technology | 2 | $29B |
|
||
| Insurance | 2 | $17B |
|
||
| Retail | 1 | $60B |
|
||
| Technology Distribution | 1 | $58B |
|
||
| Homebuilding | 1 | $35B |
|
||
| Technology Manufacturing | 1 | $35B |
|
||
Price history
+335.9% since first listed19 events — show timeline
- 2025-11-18 Listing Removed — MARMLS
- 2025-11-18 Listed $170,000 MARMLS
- 2025-07-09 Relisted — MARMLS
- 2025-07-07 Listing Removed — MARMLS
- 2025-01-11 Price Changed $170,000 MARMLS
- 2025-01-11 Relisted — MARMLS
- 2025-01-04 Contingent — MARMLS
- 2024-12-24 Relisted — MARMLS
- 2024-12-20 Contingent — MARMLS
- 2024-11-09 Price Changed $175,000 MARMLS
- 2024-09-24 Price Changed $180,000 MARMLS
- 2024-08-25 Relisted — MARMLS
- 2024-07-27 Contingent — MARMLS
- 2024-07-19 Price Changed $185,000 MARMLS
- 2024-07-16 Price Changed $180,000 MARMLS
- 2024-05-29 Relisted — MARMLS
- 2024-05-24 Contingent — MARMLS
- 2024-03-11 Listed $185,000 MARMLS
- 1996-05-15 Sold (Public Records) $39,000 Public Records
Property tax history
+27.6%/yrLatest (2025): $607 · +1.8% YoY. Source: county tax records.
Cash-flow waterfall
monthlySold comps — $/sqft
last 12 mo · ≤1 miLoading sold comps…