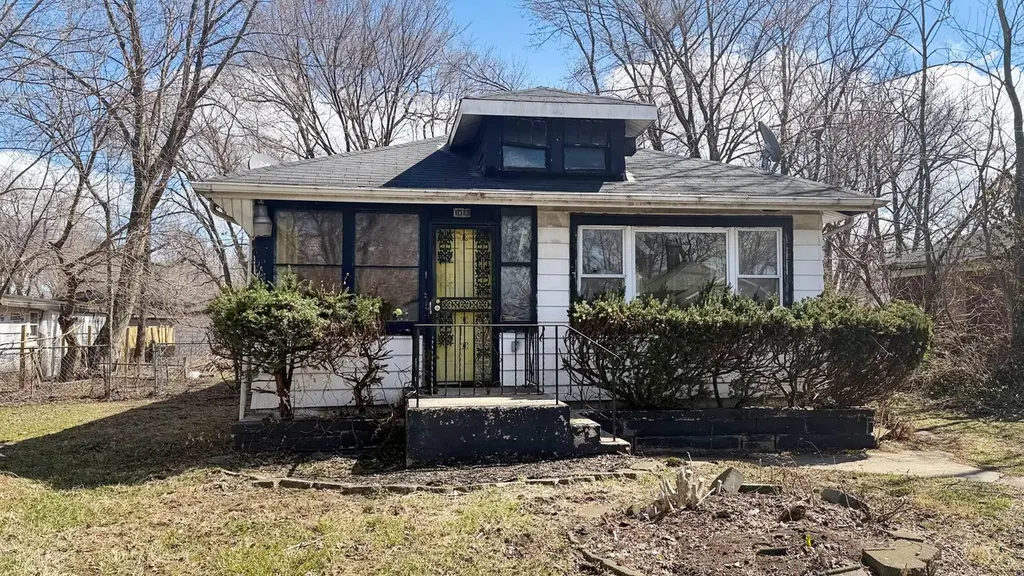
1015 New Jersey St · Gary, IN
Flood risk 1/10 · Minimal
- FEMA flood zone
- X (unshaded)
- Chance of flooding over 30 yrs
- 0.0%
- Est. flood insurance / yr
- $473 – $860
Fire risk 8/10 · Major
- Est. fire insurance / yr
- $717 – $1,331
Heat risk 2/10 · Minimal
- Hot days now (above 103°F)
- 7 days/yr
- Hot days in 30 yrs
- 15 days/yr
Wind risk 2/10 · Minimal
- Chance of severe wind over 30 yrs
- 0.0%
Air-quality risk 4/10 · Minor
- Unhealthy air days now
- 6 days/yr
- Unhealthy air days in 30 yrs
- 7 days/yr
Risk factors via First Street. Map © Google.
Why this score? — see what drove the B- grade
The composite is a weighted blend of 9 inputs, each scored 0–100. Each bar is that input's sub-score; the figure is the points it added to the 100-point composite (weight × sub-score).
- Cash flow +30.0/30.0
- 1% rule +10.0/10.0
- DSCR +10.0/10.0
- ARV discount +7.5/15.0
- Livability +3.7/5.0
- Rent growth +2.5/5.0
- Condition / age +2.5/5.0
- Schools +0.5/10.0
- Appreciation +0.0/10.0
$35,000
🖨 Deal sheet 📄 Offer letter ✓ Due diligence
Listing remarks MLS
This 2 bedrooms, 1bath home offers 1,027 square feet of potential and is ideal for buyers looking to add value with a little TLC. Featuring a full unfinished basement, there is plenty of room to expand, create added living space, or maximize storage. The property also includes a spacious two car detached garage. Bring your vision and creativity, this property is ready to be transformed into something special! Make your offer today! This is a Fannie Mae HomePath property.
Key facts
- 8,407 sq ft lot
- Garage
- Built 1952
Neighborhood map
What this means for you Summary
Snapshot
- This is a 2-bed/1.0-bath single-family listed at $35k.
Deal economics
- At list price, monthly cash flow is $819 ($10k/yr) — positive.
- The deal already cash-flows at list — no discount required.
- Meets the 1% rule at list price ($1k rent vs $35k).
- Recommended offer: $34k (1.5% below list) — sets the bar for market timing.
- Cap rate 34.4% vs local median 9.1% in Gary — top-decile yield for the area; either an underpriced asset or a hidden risk that comps aren't pricing in. Stress-test before assuming the spread holds.
Location & tenants
- Location reads 73/100 on livability (#105 in IN) — a middle-class / working-renter tenant base. Strengths: commute A+, cost of living A+, housing A+; Watch: schools F, crime F, employment F.
- Gary Community School Corporation (urban): math 3% / reading 11% proficiency, ranked #299 of 301 in IN (top 99%) — low school quality limits family demand, transient renter base, plan for 1-2y turnover; 80% free/reduced lunch — lower-income household profile, screen leases tightly.
- Market conditions: 88 active listings in the ZIP; 7 comparable units currently listed for rent nearby; rentals leasing fast (median 2d on market — plan ~1-2 weeks tenant-placement turnaround); 1,642 units permitted in Lake County in 2024 (14 in 5+ unit buildings).
- This rent runs 35% of the median local income ($46k/yr) — at the standard rent-burdened threshold; future hikes will face affordability resistance.
Forward outlook
- Local home prices are declining (-3.0%/yr); year-one equity from $242 of loan paydown is wiped out by about $1k of value loss. Plan a longer hold.
- Lake County population projected to shrink 7% by 2050 — rents likely to lag national; underwrite the cash flow, not the appreciation.
- At projected returns (-3.0% appreciation + 3.0% rent growth), your $10k cash investment doubles in ~2 years — after that, you're playing with house money.
Negotiation context
- It's been on market 29 days — a 2% lower offer ($34k) is reasonable based on typical stale-listing flexibility.
- 2 sale attempts with the ask held roughly flat each time — persistent listings suggest the price (not the market) is what's stuck; bring a comps-based counter.
Risks & watch-outs
- Watch-outs: built in 1952 — expect roof / HVAC / electrical / plumbing capex.
- Climate carrying-cost: severe wildfire risk — expect insurance premiums to compound above CPI over the hold.
Questions for the listing agent
- Built in 1952 — when were the roof, HVAC, electrical panel, plumbing, and water heater last replaced?
- Is there a deadline driving the sale (1031 exchange, divorce, estate, relocation)? That informs how much negotiation room exists.
- Schools are F-rated, which usually means shorter tenancies and higher turnover. Who's the typical renter profile here, and what's been the actual vacancy rate?
- Crime grade is F in this area — have there been break-ins, vandalism, or insurance claims at this property in the last 3 years? What carrier currently insures it and at what premium?
- What's the average days-on-market for RENTAL listings here right now (not sales)? A rising rental-DOM trend means longer vacancies and softer asking-rent achievability than the comps imply.
- What's the recent tenant-quality profile in this submarket — average credit score on applications, eviction rate, late-payment / NSF rate, and stable-employment percentage? A property-management company in the area should have these aggregated.
- How much new for-sale + rental construction is in the pipeline within 1–3 miles? Heavy new supply typically softens prices + rents 12–24 months out; constrained supply supports both.
Investment metrics
- 1% rule
- 3.84% ✓
- Cap rate
- 34.36%
- Cash-on-cash
- 100.24%
- DSCR
- 5.46
- GRM
- 2.2
CMA / ARV
- ARV (median comp)
- $94,617
- List price
- $35,000
- Delta
- -63.01%
- Verdict
- UNDERPRICED
- Comps
- 20 within 1.0 mi
Show comp detail 12 sales within ~0.75 mi
| Address | Dist | Beds/Ba | Sqft | Sold | Price | $/sf | Match |
|---|---|---|---|---|---|---|---|
| 1119 Cass St | 0.36mi | 3/1.0 (+1) | 1,066 (+4%) | 4mo | $80,000 | $75 | 68 |
| 4409 E 11th Ave | 0.19mi | 3/1.0 (+1) | 944 (-8%) | 6mo | $125,000 | $132 | 68 |
| 1118 Dearborn Cir | 0.46mi | 3/1.0 (+1) | 1,008 (-2%) | 9mo | $122,000 | $121 | 63 |
| 616 N New Hampshire St | 0.33mi | 3/1.0 (+1) | 1,073 (+4%) | 11mo | $100,000 | $93 | 63 |
| 1121 Dekalb St | 0.60mi | 3/1.0 (+1) | 1,060 (+3%) | 3mo | $127,500 | $120 | 59 |
| 1151 Benton St | 0.32mi | 3/2.0 (+1) | 936 (-9%) | 3mo | $150,000 | $160 | 59 |
| 1017 Utah St | 0.27mi | 3/1.0 (+1) | 912 (-11%) | 7mo | $60,000 | $66 | 58 |
| 3932 E 14th Ave | 0.32mi | 3/2.0 (+1) | 960 (-6%) | 10mo | $100,000 | $104 | 57 |
| 3937 E 13th Ave | 0.28mi | 3/1.0 (+1) | 884 (-14%) | 8mo | $119,900 | $136 | 52 |
| 1310 Dearborn St | 0.48mi | 3/1.0 (+1) | 1,156 (+13%) | 5mo | $82,000 | $71 | 48 |
| 5330 E 11th Pl | 0.65mi | 3/1.0 (+1) | 927 (-10%) | 10mo | $120,000 | $129 | 40 |
| 1134 Dekalb St | 0.58mi | 3/1.0 (+1) | 884 (-14%) | 8mo | $148,000 | $167 | 39 |
Match score weights: distance 35% · size 25% · config 20% · recency 20%. Top-matched comps best support the ARV.
Projected returns pro-forma
-3.0% appreciation · 3.0% rent growth · sell at horizon
- IRR
- —
- Equity multiple
- 5.74×
- Total profit
- $46,490
- Equity at exit
- $5,219
- IRR
- —
- Equity multiple
- 11.99×
- Total profit
- $107,705
- Equity at exit
- $3,026
Cash invested: $9,800 (down + closing). Projections, not guarantees.
Landlord ↔ Tenant lean methodology
- Overall (STATE)
- 90 Strongly Landlord-Friendly
- State Indiana
- 90 Strongly Landlord-Friendly · R+11
- County
- — inherits STATE
- City
- — inherits STATE
ZIP-level market 46403
- Home prices YoY
- -27.3%
- Active inventory
- 88
- Price-to-rent
- 2.2×
Monthly cashflow live
- Estimated rent
- $1,342 high interval (Pro) →
- Mortgage (P&I)
- −$184
- Tax est. 1.5%
- −$44 /mo · $525/yr
- Insurance
- −$15
- HOA
- −$0
- Vacancy / Maint / Mgmt
- −$282
- Net cashflow
- $819
Break-even live
UW: 25.0% down · 7.5% · 30yr · 1.5% tax · 5.0% vac · 8.0% maint · 8.0% mgmt
Financing live
Cash to close
- Down payment
- $8,750
- Closing costs
- $1,050
- Reserves months
- —
- Total cash needed
- —
Loan-product check · same deal, 3 products live
Conventional
25% down · 7.5% · 30yr
- Down + closing
- —
- Monthly P&I
- —
- Monthly cashflow
- —
- DSCR
- —
- Eligible?
- —
Personal DTI + credit; lowest rate.
DSCR
20% down · 8.5% · 30yr
- Down + closing
- —
- Monthly P&I
- —
- Monthly cashflow
- —
- DSCR
- —
- Eligible?
- —
No personal income docs; deal must DSCR.
Hard money
10% down · 12.0% · 12mo
- Down + closing
- —
- Monthly P&I
- —
- Monthly cashflow
- —
- DSCR
- —
- Eligible?
- —
Short-term bridge; refi at stabilization.
Rent comps 7 comps
| Address | Beds | Baths | Sqft | Rent | $/sqft | DOM | Units | Dist |
|---|---|---|---|---|---|---|---|---|
| 1118 Benton St Gary, IN | 3.0 | 1.0 | 936 | $1,245 | $1.33 | 1d | 1 | 0.30mi |
| 904 Idaho St Gary, IN | 2.0 | 1.0 | 1176 | $1,200 | $1.02 | 43d | 1 | 0.40mi |
| 1252-54 Idaho St Gary, IN | 3.0 | 1.0 | 900 | $2,200 | $2.44 | 1d | 1 | 0.46mi |
| 1041 DeKalb St Gary, IN | 3.0 | 1.0 | 1006 | $1,250 | $1.24 | 43d | 1 | 0.63mi |
| 2908 Central Dr Gary, IN | 3.0 | 1.0 | 884 | $1,525 | $1.73 | 1d | 1 | 1.29mi |
| 430 S Grand Blvd Gary, IN | 2.0 | 1.0 | 830 | $865 | $1.04 | 1d | 1 | 1.43mi |
| 283 N Hamilton St Gary, IN | 2.0 | 1.0 | 1100 | $1,100 | $1.00 | 3d | 1 | 1.46mi |
Listing history 3 events
-
2026-05-01status Active 475-char remark
Show marketing remark (475 chars)
This 2 bedrooms, 1bath home offers 1,027 square feet of potential and is ideal for buyers looking to add value with a little TLC. Featuring a full unfinished basement, there is plenty of room to expand, create added living space, or maximize storage. The property also includes a spacious two car detached garage. Bring your vision and creativity, this property is ready to be transformed into something special! Make your offer today! This is a Fannie Mae HomePath property.
-
2026-04-22status Pending 475-char remark
Show marketing remark (475 chars)
This 2 bedrooms, 1bath home offers 1,027 square feet of potential and is ideal for buyers looking to add value with a little TLC. Featuring a full unfinished basement, there is plenty of room to expand, create added living space, or maximize storage. The property also includes a spacious two car detached garage. Bring your vision and creativity, this property is ready to be transformed into something special! Make your offer today! This is a Fannie Mae HomePath property.
-
2026-04-14$36,500 Active 475-char remark
Show marketing remark (475 chars)
This 2 bedrooms, 1bath home offers 1,027 square feet of potential and is ideal for buyers looking to add value with a little TLC. Featuring a full unfinished basement, there is plenty of room to expand, create added living space, or maximize storage. The property also includes a spacious two car detached garage. Bring your vision and creativity, this property is ready to be transformed into something special! Make your offer today! This is a Fannie Mae HomePath property.
ⓘ Source: listings_history table (triggers on properties + properties_extension) + one-shot
backfill from property_details.listing_events for pre-trigger history.
Climate risk First Street
- Flood 1/10 Low FEMA zone X (unshaded) · 0% chance over 30 yrs
- Wildfire 8/10 Severe
- Heat 2/10 Low 7 d/yr ≥103°F today · 15 d/yr by 30 yrs out
- Wind 2/10 Low 0% chance of damaging wind over 30 yrs
- Air quality 4/10 Moderate 6 unhealthy d/yr today · 7 by 30 yrs out
Nearby sold comps map
Loading sold comps map…
Walkable amenities ~0.75 mi
Loading nearby amenities…
Taxation est. · year 1
- Rental income
- $16,110
- − Mortgage interest
- −$1,961
- − Property taxes
- −$525
- − Insurance
- −$175
- − Repairs & maintenance
- −$1,289
- − Management
- −$1,289
- − Depreciation
- −$1,018
- Taxable income
- $9,853
- Est. tax owed @ 24.0%
- −$2,365
- After-tax cash flow
- $7,459/yr
For passive investors: Depreciation is non-cash, so a rental often shows a tax loss while cash-flowing — sheltering income. Rental losses are passive: they offset passive income freely, and up to $25,000/yr can offset ordinary (W-2) income if you actively participate and your MAGI is under $100k (phasing out to $0 by $150k); unused losses carry forward. On sale, claimed depreciation is recaptured at up to 25%, and gains may owe capital-gains tax (a 1031 exchange can defer both). Figures are a year-1 estimate at your 24.0% rate — not tax advice; consult a CPA.
Schools (NCES district)
- District
- Gary Community School Corporation
- NCES district ID
- 1803870
- Math proficiency
- 3% ▼ -10.00%
- Reading proficiency
- 11% ▼ -6.00%
- Median HH income
- $27,739
- Composite
- 4.98/100
- National rank
- #10039
- State rank
- #299 of 301 in IN
Livability — Gary
- Score
- 73/100
- State rank
- #105
- US rank
- #5592
Category grades
Schools grade is shown separately in the Schools card above.
Census & demographics
- Census place
- Gary, IN
- County
- Lake County · 422,878 people
- City population
- 63,701
- Metro
- Chicago-Naperville-Elgin, IL-IN-WI
- Population (ZIP)
- 10,929
- Household income
- $45,991
- Rent vs Own
- Severe rent burden
- 656.0
Population outlook (Lake County) Hauer SSP2
- Today (2025)
- 484,026 people
- By 2030
- 478,091 · -1.2%
- By 2040
- 462,974 · -4.3%
- By 2050
- 449,894 · -7.1%
- By 2075
- 436,169 · -9.9%
- By 2100
- 426,607 · -11.9%
Race, ethnicity, and origin ACS 2023
- Neighborhood character
- Predominantly Black (71%)
- Race & ethnicity
- Black 71% White 18% Hispanic / Latino 9% Two or more races 4%
- Hispanic origin (detail)
- Mexican 5% Puerto Rican 4%
- Common ancestry
- Romanian 2% Hispanic 1% Iranian 1%
- Foreign-born
- 3% · Canada
- Languages at home
- 96% English-only · Spanish 2%
Political lean MEDSL · Lake
- 2024 margin
- Lean D (+5.6) · D 52.1% · R 46.5% · Other 1.5%
- 2008→2024 swing
- -28.6pp toward R · 2008: 34.3pp · 2024: 5.6pp
- All cycles
- 2024: D+5.6 2020: D+15.1 2016: D+20.6 2012: D+31.0 2008: D+34.3
Not yet ingested
- Civics
- —
Market trends
- HPI YoY
- ▼ -110.41%
- Current HPI
- 294.0935
- Rent YoY
- —
- Metro
- Chicago-Naperville-Elgin, IL-IN-WI
- State GDP YoY
- ▲ 2.90%
- F500 in state
- 18
Industry mix (Fortune 500 HQ in IN)
| Industry | F500 HQs | Revenue |
|---|---|---|
| Industrial Machinery | 2 | $37B |
|
||
| Healthcare | 1 | $177B |
|
||
| Pharmaceuticals | 1 | $45B |
|
||
| Metals / Steel | 1 | $18B |
|
||
| Agriculture | 1 | $17B |
|
||
| Packaging | 1 | $12B |
|
||
Price history
3 events — show timeline
- 2026-05-01 Relisted — NIRA MLS as Distributed by MLS Grid
- 2026-04-22 Pending — NIRA MLS as Distributed by MLS Grid
- 2026-04-14 Listed $36,500 NIRA MLS as Distributed by MLS Grid
Property tax history
+0.0%/yrLatest (2019): $60 · +0.0% YoY. Source: county tax records.
Cash-flow waterfall
monthlySold comps — $/sqft
last 12 mo · ≤1 miLoading sold comps…