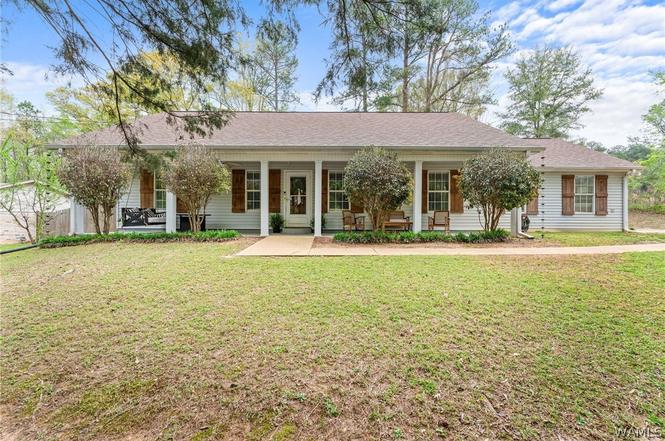
5920 Charlie Shirley Rd · Northport, AL
Flood risk 1/10 · Minimal
- FEMA flood zone
- X (unshaded)
- Chance of flooding over 30 yrs
- 0.0%
- Est. flood insurance / yr
- $507 – $1,088
Fire risk 4/10 · Minor
- Est. fire insurance / yr
- $916 – $1,700
Heat risk 7/10 · Major
- Hot days now (above 108°F)
- 7 days/yr
- Hot days in 30 yrs
- 18 days/yr
Wind risk 6/10 · Moderate
- Chance of severe wind over 30 yrs
- 55.0%
Air-quality risk 2/10 · Minimal
- Unhealthy air days now
- 2 days/yr
- Unhealthy air days in 30 yrs
- 2 days/yr
Risk factors via First Street. Map © Google.
Why this score? — see what drove the F grade
The composite is a weighted blend of 9 inputs, each scored 0–100. Each bar is that input's sub-score; the figure is the points it added to the 100-point composite (weight × sub-score).
- Cash flow +13.6/30.0
- DSCR +4.1/10.0
- Livability +3.9/5.0
- Schools +2.9/10.0
- 1% rule +2.5/10.0
- Rent growth +2.5/5.0
- Condition / age +2.5/5.0
- ARV discount +0.0/15.0
- Appreciation +0.0/10.0
$265,000
🖨 Deal sheet 📄 Offer letter ✓ Due diligence
Listing remarks
Welcome home to this cozy and charming 3-bedroom 2 bath gem that truly feels inviting from the moment you step inside. The layout is comfortable and functional, making it great for everyday living and easy entertaining. Conveniently located near shopping, dining and daily essentials, this move in ready home offers the freedom of no HOA restrictions so you can truly make it your own. Whether you are a first-time homebuyer, downsizing, or looking for a solid investment, this cute and well cared for home is ready for its next owner. Less than 6 miles to Bryant Denny Stadium! Schedule your showing today!
Key facts
- 0.34 acre lot
- Garage
- Built 1999
Property features AI
Finance
- Other: Subdivision: Northwood Lake
Exterior
- Parking: Attached garage; Concrete driveway; Garage door opener
- Utilities: Public water; Sewer connected
- Home design: Single-family residence; One level
- Construction: Vinyl siding; Shingle/composition roof; Slab foundation; Built as a residential single-family home
- Exterior features: Paved road access; Lot approximately 0.34 acres
Interior
- Kitchen: Dishwasher; Electric oven; Electric range; Microwave; Refrigerator
- Bathrooms: 2 full bathrooms
- Heating & cooling: Central heating; Central cooling
- Interior features: Dishwasher; Electric oven; Electric range; Electric water heater; Microwave; Refrigerator; No fireplace; Total of 9 rooms
- Laundry & utility: Laundry room located inside
Neighborhood map
What this means for you Summary
Snapshot
- This is a 3-bed/2.0-bath single-family listed at $265k.
Deal economics
- At list price, monthly cash flow is $14 ($165/yr) — positive.
- The deal already cash-flows at list — no discount required.
- To meet the 1% rule (rent ≥ 1% of price), the offer needs to be $199k (25.0% below list).
- Recommended offer: $199k (25.0% below list) — sets the bar for 1% rule.
- Cap rate 6.4% vs local median 4.2% in Northport — top-decile yield for the area; either an underpriced asset or a hidden risk that comps aren't pricing in. Stress-test before assuming the spread holds.
Location & tenants
- Location reads 78/100 on livability (#8 in AL, #2,686 nationally) — a middle-class / working-renter tenant base. Strengths: cost of living A+, housing A+, health & safety A+; Watch: commute F.
- Tuscaloosa County (suburban): math 21% / reading 45% proficiency, ranked #47 of 129 in AL (top 36%) — families likely to look elsewhere, expect single-tenant / working-renter base with shorter leases.
- Zoned schools: Faucettvestavia Elementary School (math 37% / reading 62%, grade D, #121 of 627 statewide, top 21%, 357 students, 58% FRL); Echols Middle School (math 13% / reading 48%, grade F, #119 of 257 statewide, top 46%, 878 students, 64% FRL); Tuscaloosa County High School (math 26% / reading 30%, grade F, #87 of 305 statewide, top 29%, 1,545 students, 55% FRL).
- Market conditions: 108 active listings in the ZIP; 2 comparable units currently listed for rent nearby; 622 units permitted in Tuscaloosa County in 2024 (69 in 5+ unit buildings).
- This rent runs 34% of the median local income ($70k/yr) — at the standard rent-burdened threshold; future hikes will face affordability resistance.
Forward outlook
- Local home prices are declining (-3.0%/yr); year-one equity from $2k of loan paydown is wiped out by about $8k of value loss. Plan a longer hold.
- Tuscaloosa County population projected at +26% by 2050 — long-run rental-demand tailwind backs the buy-and-hold thesis.
Negotiation context
- It's been on market 81 days — a 6% lower offer ($249k) is reasonable based on typical stale-listing flexibility.
- 2 sale attempts with the ask held roughly flat each time — persistent listings suggest the price (not the market) is what's stuck; bring a comps-based counter.
Risks & watch-outs
- Climate carrying-cost: major wind risk, 55% chance of damaging wind over 30y; extreme-heat days projected 7→18/yr by 2055 (HVAC capex compounding) — expect insurance premiums to compound above CPI over the hold.
Questions for the listing agent
- It's been on market 81 days. Have you received any prior offers? Is the seller open to a 25% concession, seller financing, or rate buy-down credit?
- Why hasn't it sold? Are there any deal-killer items the seller is aware of (foundation, flood, title, zoning, code violations)?
- Is there a deadline driving the sale (1031 exchange, divorce, estate, relocation)? That informs how much negotiation room exists.
- The area grade is low — what's the realistic commute time and amenity access for the typical tenant pool here? Any planned neighborhood developments (good or bad) we should know about?
- What's the average days-on-market for RENTAL listings here right now (not sales)? A rising rental-DOM trend means longer vacancies and softer asking-rent achievability than the comps imply.
- What's the recent tenant-quality profile in this submarket — average credit score on applications, eviction rate, late-payment / NSF rate, and stable-employment percentage? A property-management company in the area should have these aggregated.
- How much new for-sale + rental construction is in the pipeline within 1–3 miles? Heavy new supply typically softens prices + rents 12–24 months out; constrained supply supports both.
Investment metrics
- 1% rule
- 0.75% ✗
- Cap rate
- 6.36%
- Cash-on-cash
- 0.22%
- DSCR
- 1.01
- GRM
- 11.1
CMA / ARV
- ARV (on-the-fly)
- $223,560
- Comps found
- 3
Show comp detail 3 sales within ~0.75 mi
| Address | Dist | Beds/Ba | Sqft | Sold | Price | $/sf | Match |
|---|---|---|---|---|---|---|---|
| 5920 Charlie Shirley Rd | 0.00mi | 3/2.0 | 1,215 (0%) | 0mo | $255,000 | $210 | 100 |
| 509 Monterey Dr | 0.60mi | 3/1.5 | 1,275 (+5%) | 1mo | $234,900 | $184 | 61 |
| 5209 Northwood Lake Dr E | 0.60mi | 3/2.0 | 1,273 (+5%) | 16mo | $190,000 | $149 | 50 |
Match score weights: distance 35% · size 25% · config 20% · recency 20%. Top-matched comps best support the ARV.
Projected returns pro-forma
-3.0% appreciation · 3.0% rent growth · sell at horizon
- IRR
- -16.0%
- Equity multiple
- 0.43×
- Total profit
- $-42,204
- Equity at exit
- $39,512
- IRR
- -7.8%
- Equity multiple
- 0.51×
- Total profit
- $-36,186
- Equity at exit
- $22,912
Cash invested: $74,200 (down + closing). Projections, not guarantees.
Landlord ↔ Tenant lean methodology
- Overall (STATE)
- 90 Strongly Landlord-Friendly
- State Alabama
- 90 Strongly Landlord-Friendly · R+15
- County
- — inherits STATE
- City
- — inherits STATE
ZIP-level market 35473
- Home prices YoY
- -14.6%
- Active inventory
- 108
- Price-to-rent
- 11.1×
Monthly cashflow live
- Estimated rent
- $1,988 medium interval (Pro) →
- Mortgage (P&I)
- −$1,390
- Tax from tax record
- −$57 /mo · $678/yr
- Insurance
- −$110
- HOA
- −$0
- Vacancy / Maint / Mgmt
- −$417
- Net cashflow
- $14
Break-even live
UW: 25.0% down · 7.5% · 30yr · 1.5% tax · 5.0% vac · 8.0% maint · 8.0% mgmt
Financing live
Cash to close
- Down payment
- $66,250
- Closing costs
- $7,950
- Reserves months
- —
- Total cash needed
- —
Loan-product check · same deal, 3 products live
Conventional
25% down · 7.5% · 30yr
- Down + closing
- —
- Monthly P&I
- —
- Monthly cashflow
- —
- DSCR
- —
- Eligible?
- —
Personal DTI + credit; lowest rate.
DSCR
20% down · 8.5% · 30yr
- Down + closing
- —
- Monthly P&I
- —
- Monthly cashflow
- —
- DSCR
- —
- Eligible?
- —
No personal income docs; deal must DSCR.
Hard money
10% down · 12.0% · 12mo
- Down + closing
- —
- Monthly P&I
- —
- Monthly cashflow
- —
- DSCR
- —
- Eligible?
- —
Short-term bridge; refi at stabilization.
Rent comps 2 comps
| Address | Beds | Baths | Sqft | Rent | $/sqft | DOM | Units | Dist |
|---|---|---|---|---|---|---|---|---|
| 7651 Highway 69 N Northport, AL | 3.0 | 1.0–2.5 | 1067 | $1,605 | $1.50 | 13d | 1 | 0.69mi |
| 4909 Northwood Lake Dr E Northport, AL | 3.0 | 2.0 | 1438 | $1,800 | $1.25 | 13d | 1 | 0.79mi |
Listing history 9 events
-
2026-05-13status Pending
-
2026-05-10status Active
-
2026-04-29status Pending
-
2026-04-15price $265,000
-
2026-03-23price $269,900
-
2026-03-09price $272,000
-
2026-02-11$275,000 Active
-
2024-01-22soldstatus $238,000
-
2006-12-18soldstatus $131,000
ⓘ Source: listings_history table (triggers on properties + properties_extension) + one-shot
backfill from property_details.listing_events for pre-trigger history.
Tax reassessment forecast AL · Resets to sale price
- Current annual tax
- $678 · $57/mo
- Projected year-2 tax
- $1,086 · $91/mo
- Expected delta
- +$408/yr (+$34/mo · 60.2%)
ⓘ Screening estimate from a state-policy table — verify with the county assessor before closing.
Climate risk First Street
- Flood 1/10 Low FEMA zone X (unshaded) · 0% chance over 30 yrs
- Wildfire 4/10 Moderate
- Heat 7/10 Severe 7 d/yr ≥108°F today · 18 d/yr by 30 yrs out
- Wind 6/10 Major 55% chance of damaging wind over 30 yrs
- Air quality 2/10 Low 2 unhealthy d/yr today · 2 by 30 yrs out
Nearby sold comps map
Loading sold comps map…
Walkable amenities ~0.75 mi
Loading nearby amenities…
Taxation est. · year 1
- Rental income
- $23,854
- − Mortgage interest
- −$14,844
- − Property taxes
- −$678
- − Insurance
- −$1,325
- − Repairs & maintenance
- −$1,908
- − Management
- −$1,908
- − Depreciation
- −$7,709
- Taxable loss
- −$4,519
- Est. tax savings @ 24.0%
- +$1,085
- After-tax cash flow
- $1,250/yr
For passive investors: Depreciation is non-cash, so a rental often shows a tax loss while cash-flowing — sheltering income. Rental losses are passive: they offset passive income freely, and up to $25,000/yr can offset ordinary (W-2) income if you actively participate and your MAGI is under $100k (phasing out to $0 by $150k); unused losses carry forward. On sale, claimed depreciation is recaptured at up to 25%, and gains may owe capital-gains tax (a 1031 exchange can defer both). Figures are a year-1 estimate at your 24.0% rate — not tax advice; consult a CPA.
Schools (NCES district)
- District
- Tuscaloosa County
- NCES district ID
- 0103390
- Math proficiency
- 21% ▼ -24.00%
- Reading proficiency
- 45% ▲ 2.00%
- Median HH income
- $53,000
- Composite
- 28.88/100
- National rank
- #6641
- State rank
- #47 of 129 in AL
Livability — Northport
- Score
- 78/100
- State rank
- #8
- US rank
- #2686
Category grades
Schools grade is shown separately in the Schools card above.
Census & demographics
- Census place
- Northport, AL
- County
- Tuscaloosa County · 206,491 people
- City population
- 47,464
- Metro
- Tuscaloosa, AL
- Population (ZIP)
- 18,198
- Household income
- $69,657
- Rent vs Own
- Severe rent burden
- 740.0
Population outlook (Tuscaloosa County) Hauer SSP2
- Today (2025)
- 228,293 people
- By 2030
- 240,551 · +5.4%
- By 2040
- 263,856 · +15.6%
- By 2050
- 286,491 · +25.5%
- By 2075
- 335,783 · +47.1%
- By 2100
- 370,520 · +62.3%
Race, ethnicity, and origin ACS 2023
- Neighborhood character
- Predominantly White (69%)
- Race & ethnicity
- White 69% Black 20% Hispanic / Latino 9% Two or more races 6%
- Hispanic origin (detail)
- Mexican 4%
- Common ancestry
- Serbian 3% Slovak 1% Italian 1%
- Foreign-born
- 6% · Canada
- Languages at home
- 91% English-only · Spanish 6% German/W. Germanic 1%
Political lean MEDSL · Tuscaloosa
- 2024 margin
- Strong R (+20.4) · D 39.4% · R 59.8%
- 2008→2024 swing
- -4.4pp toward R · 2008: -16.0pp · 2024: -20.4pp
- All cycles
- 2024: R+20.4 2020: R+14.8 2016: R+19.5 2012: R+17.4 2008: R+16.0
Not yet ingested
- Civics
- —
Market trends
- HPI YoY
- ▼ -37.92%
- Current HPI
- 222.5458
- Rent YoY
- —
- Metro
- Tuscaloosa, AL
- State GDP YoY
- ▲ 2.94%
- F500 in state
- 4
Industry mix (Fortune 500 HQ in AL)
| Industry | F500 HQs | Revenue |
|---|---|---|
| Financial Services | 1 | $8B |
|
||
| Healthcare | 1 | $5B |
|
||
Price history
+102.3% since first listed9 events — show timeline
- 2026-05-13 Pending — WAMLS
- 2026-05-10 Relisted — WAMLS
- 2026-04-29 Pending — WAMLS
- 2026-04-15 Price Changed $265,000 WAMLS
- 2026-03-23 Price Changed $269,900 WAMLS
- 2026-03-09 Price Changed $272,000 WAMLS
- 2026-02-11 Listed $275,000 WAMLS
- 2024-01-22 Sold (Public Records) $238,000 Public Records
- 2006-12-18 Sold (Public Records) $131,000 Public Records
Property tax history
+29.9%/yrLatest (2025): $678 · +29.9% YoY. Source: county tax records.
Cash-flow waterfall
monthlySold comps — $/sqft
last 12 mo · ≤1 miLoading sold comps…