306 Padua Ave · Ravenna, NE
Flood risk 1/10 · Minimal
- FEMA flood zone
- X (unshaded)
- Chance of flooding over 30 yrs
- 0.0%
- Est. flood insurance / yr
- $473 – $860
Fire risk 4/10 · Minor
- Est. fire insurance / yr
- $1,161 – $2,155
Heat risk 3/10 · Minor
- Hot days now (above 102°F)
- 7 days/yr
- Hot days in 30 yrs
- 16 days/yr
Wind risk 2/10 · Minimal
- Chance of severe wind over 30 yrs
- —
Air-quality risk 2/10 · Minimal
- Unhealthy air days now
- 1 days/yr
- Unhealthy air days in 30 yrs
- 1 days/yr
Risk factors via First Street. Map © Google.
Why this score? — see what drove the D- grade
The composite is a weighted blend of 9 inputs, each scored 0–100. Each bar is that input's sub-score; the figure is the points it added to the 100-point composite (weight × sub-score).
- Cash flow +11.2/30.0
- Appreciation +5.0/10.0
- Schools +4.8/10.0
- Livability +3.6/5.0
- 1% rule +3.3/10.0
- DSCR +3.3/10.0
- ARV discount +2.7/15.0
- Rent growth +2.5/5.0
- Condition / age +1.0/5.0
$149,900
🖨 Deal sheet (PDF) 📄 Offer letter ✓ Due diligence
Listing remarks MLS
Cozy home with a garage/man cave building on the north lot. Lots of updates including flooring, windows & roof. Huge double lot.
Key facts
- Close to school
- Close to ballparks
- Close to downtown
Tags
Property features AI
Exterior
- Home design: Single-family residence
- Construction: Property type: Residential
- Exterior features: Zoned residential
Interior
- Bathrooms: One main-level bathroom
- Interior features: Basement
Neighborhood map
What this means for you Summary
Snapshot
- This is a 3-bed/1.0-bath single-family listed at $150k. Condition is rated poor.
Deal economics
- At list price, monthly cash flow is $-58 ($-698/yr) — negative.
- To cash-flow at today's rent, offer at most $141k (5.6% below list).
- To meet the 1% rule (rent ≥ 1% of price), the offer needs to be $124k (17.4% below list).
- Recommended offer: $124k (17.4% below list) — sets the bar for 1% rule.
Location & tenants
- Location reads 71/100 on livability (#199 in NE) — a middle-class / working-renter tenant base. Strengths: crime A+, cost of living A+, housing A+; Watch: health & safety C-, amenities F, commute F.
- Ravenna Public Schools (rural): math 60% / reading 50% proficiency, ranked #113 of 245 in NE (top 46%) — acceptable for families but not a draw, mixed tenant base, ~2y average lease.
- Zoned schools: Ravenna Elementary School (math 72% / reading 57%, grade B, #78 of 502 statewide, top 18%, 244 students, 45% FRL); Ravenna Senior High (math 57% / reading 57%, grade C, #70 of 261 statewide, top 30%, 169 students, 43% FRL) — zoned schools average 44% FRL vs 27% district-wide (16 pts higher); higher-poverty schools than district average — tighter screening recommended.
- Market conditions: 1 active listings in the ZIP; 125 units permitted in Buffalo County in 2024 (0 in 5+ unit buildings).
Forward outlook
- In year one you build about $6k of equity ($1k loan paydown + $4k appreciation (3.0% local appreciation)).
- Buffalo County population projected at +31% by 2050 — long-run rental-demand tailwind backs the buy-and-hold thesis.
- At projected returns (3.0% appreciation + 3.0% rent growth), your $42k cash investment doubles in ~7 years — after that, you're playing with house money.
- By year 7, paydown + projected appreciation supports a ~$35k cash-out refi (75% LTV) — recoverable capital for the next deal without selling this one.
Negotiation context
- It's been on market 36 days — a 3% lower offer ($145k) is reasonable based on typical stale-listing flexibility.
- 2 sale attempts since 9y ago with the ask held roughly flat each time — persistent listings suggest the price (not the market) is what's stuck; bring a comps-based counter.
- Current owner paid $118k; 27% above their basis — modest negotiation headroom, anchor on the comps not their cost.
Risks & watch-outs
- Watch-outs: built in 1920 — expect roof / HVAC / electrical / plumbing capex.
Questions for the listing agent
- What do current leases actually rent for vs. the listed asking? Can we see a recent rent roll and the last 12 months of T-12 income?
- It's been on market 36 days. Have you received any prior offers? Is the seller open to a 17% concession, seller financing, or rate buy-down credit?
- Have any recent inspections been done? Can we get a copy of the seller's disclosures and any deferred-maintenance estimates?
- Built in 1920 — when were the roof, HVAC, electrical panel, plumbing, and water heater last replaced?
- Is there a deadline driving the sale (1031 exchange, divorce, estate, relocation)? That informs how much negotiation room exists.
- The area grade is low — what's the realistic commute time and amenity access for the typical tenant pool here? Any planned neighborhood developments (good or bad) we should know about?
- What's the average days-on-market for RENTAL listings here right now (not sales)? A rising rental-DOM trend means longer vacancies and softer asking-rent achievability than the comps imply.
- What's the recent tenant-quality profile in this submarket — average credit score on applications, eviction rate, late-payment / NSF rate, and stable-employment percentage? A property-management company in the area should have these aggregated.
- How much new for-sale + rental construction is in the pipeline within 1–3 miles? Heavy new supply typically softens prices + rents 12–24 months out; constrained supply supports both.
Investment metrics
- 1% rule
- 0.83% ✗
- Cap rate
- 5.83%
- Cash-on-cash
- -1.66%
- DSCR
- 0.93
- GRM
- 10.1
CMA / ARV
- ARV (on-the-fly)
- $135,408
- Comps found
- 6
Show comp detail 6 sales within ~0.75 mi
| Address | Dist | Beds/Ba | Sqft | Sold | Price | $/sf | Match |
|---|---|---|---|---|---|---|---|
| 502 Kufus Ave | 0.15mi | 2/1.0 (-1) | 1,404 (-4%) | 7mo | $121,000 | $86 | 76 |
| 307 Padua Ave | 0.03mi | 3/2.0 | 1,560 (+7%) | 12mo | $175,000 | $112 | 73 |
| 323 Milan Ave | 0.33mi | 3/1.0 | 1,284 (-12%) | 5mo | $60,000 | $47 | 61 |
| 323 Padua Ave | 0.05mi | 3/2.0 | 1,256 (-14%) | 18mo | $102,000 | $81 | 56 |
| 320 Sicily Ave | 0.37mi | 4/2.0 (+1) | 1,632 (+12%) | 3mo | $164,900 | $101 | 52 |
| 508 Padua Ave | 0.14mi | 2/2.0 (-1) | 1,288 (-12%) | 23mo | $120,000 | $93 | 46 |
Match score weights: distance 35% · size 25% · config 20% · recency 20%. Top-matched comps best support the ARV.
Projected returns pro-forma
3.0% appreciation · 3.0% rent growth · sell at horizon
- IRR
- 6.0%
- Equity multiple
- 1.34×
- Total profit
- $14,373
- Equity at exit
- $67,402
- IRR
- 8.9%
- Equity multiple
- 2.34×
- Total profit
- $56,405
- Equity at exit
- $103,874
Cash invested: $41,972 (down + closing). Projections, not guarantees.
Landlord ↔ Tenant lean methodology
- Overall (STATE)
- 83 Strongly Landlord-Friendly
- State Nebraska
- 83 Strongly Landlord-Friendly · R+13
- County
- — inherits STATE
- City
- — inherits STATE
ZIP-level market 69969
- Active inventory
- 1
- Price-to-rent
- 10.1×
Monthly cashflow live
- Estimated rent
- $1,238 medium interval (Pro) →
- Mortgage (P&I)
- −$786
- Tax est. 1.5%
- −$187 /mo · $2,248/yr
- Insurance
- −$62
- HOA
- −$0
- Vacancy / Maint / Mgmt
- −$260
- Net cashflow
- $-58
Break-even live
Sensitivity live
| Price | -10% $45 | -5% $-6 | +0% $-58 | +5% $-110 | +10% $-162 |
|---|---|---|---|---|---|
| Rent | -10% $-156 | -5% $-107 | +0% $-58 | +5% $-9 | +10% $40 |
| Rate | -1.0pp $17 | -0.5pp $-20 | base $-58 | +0.5pp $-97 | +1.0pp $-137 |
UW: 25.0% down · 7.5% · 30yr · 1.5% tax · 5.0% vac · 8.0% maint · 8.0% mgmt
Financing live
Cash to close
- Down payment
- $37,475
- Closing costs
- $4,497
- Reserves months
- —
- Total cash needed
- —
Loan-product check · same deal, 3 products live
Conventional
25% down · 7.5% · 30yr
- Down + closing
- —
- Monthly P&I
- —
- Monthly cashflow
- —
- DSCR
- —
- Eligible?
- —
Personal DTI + credit; lowest rate.
DSCR
20% down · 8.5% · 30yr
- Down + closing
- —
- Monthly P&I
- —
- Monthly cashflow
- —
- DSCR
- —
- Eligible?
- —
No personal income docs; deal must DSCR.
Hard money
10% down · 12.0% · 12mo
- Down + closing
- —
- Monthly P&I
- —
- Monthly cashflow
- —
- DSCR
- —
- Eligible?
- —
Short-term bridge; refi at stabilization.
Listing history 20 events
-
2026-06-22days on market $149,900 Active 36 DOM
-
2026-06-21days on market $149,900 Active 35 DOM
-
2026-06-21days on market $149,900 Active 34 DOM
-
2026-06-18days on market $149,900 Active 32 DOM
-
2026-06-17days on market $149,900 Active 31 DOM
-
2026-06-16days on market $149,900 Active 30 DOM
-
2026-06-15days on market $149,900 Active 29 DOM
-
2026-06-13days on market $149,900 Active 27 DOM
-
2026-06-12days on market $149,900 Active 26 DOM
-
2026-06-09days on market $149,900 Active 23 DOM
-
2026-06-08days on market $149,900 Active 22 DOM
-
2026-06-07days on market $149,900 Active 21 DOM
-
2026-06-05days on market $149,900 Active 19 DOM
-
2026-06-04days on market $149,900 Active 17 DOM
-
2026-06-02days on market $149,900 Active 16 DOM
-
2026-06-01days on market $149,900 Active 15 DOM
-
2026-05-31days on market $149,900 Active 14 DOM
-
2026-05-16$149,900 Active
-
2018-07-13soldstatus $118,000 134-char remark
Show marketing remark (134 chars)
Cozy home with a garage/man cave building on the north lot. Lots of updates including flooring, windows & roof. Huge double lot.
-
2017-10-06$124,900 134-char remark
Show marketing remark (134 chars)
Cozy home with a garage/man cave building on the north lot. Lots of updates including flooring, windows & roof. Huge double lot.
ⓘ Source: listings_history table (triggers on properties + properties_extension) + one-shot
backfill from property_details.listing_events for pre-trigger history.
Climate risk First Street
- Flood 1/10 Low FEMA zone X (unshaded) · 0% chance over 30 yrs
- Wildfire 4/10 Moderate
- Heat 3/10 Moderate 7 d/yr ≥102°F today · 16 d/yr by 30 yrs out
- Wind 2/10 Low
- Air quality 2/10 Low 1 unhealthy d/yr today · 1 by 30 yrs out
Nearby sold comps map
Loading sold comps map…
Walkable amenities ~0.75 mi
Loading nearby amenities…
Taxation est. · year 1
- Rental income
- $14,852
- − Mortgage interest
- −$8,397
- − Property taxes
- −$2,248
- − Insurance
- −$750
- − Repairs & maintenance
- −$1,188
- − Management
- −$1,188
- − Depreciation
- −$4,361
- Taxable loss
- −$3,280
- Est. tax savings @ 24.0%
- +$787
- After-tax cash flow
- $89/yr
For passive investors: Depreciation is non-cash, so a rental often shows a tax loss while cash-flowing — sheltering income. Rental losses are passive: they offset passive income freely, and up to $25,000/yr can offset ordinary (W-2) income if you actively participate and your MAGI is under $100k (phasing out to $0 by $150k); unused losses carry forward. On sale, claimed depreciation is recaptured at up to 25%, and gains may owe capital-gains tax (a 1031 exchange can defer both). Figures are a year-1 estimate at your 24.0% rate — not tax advice; consult a CPA.
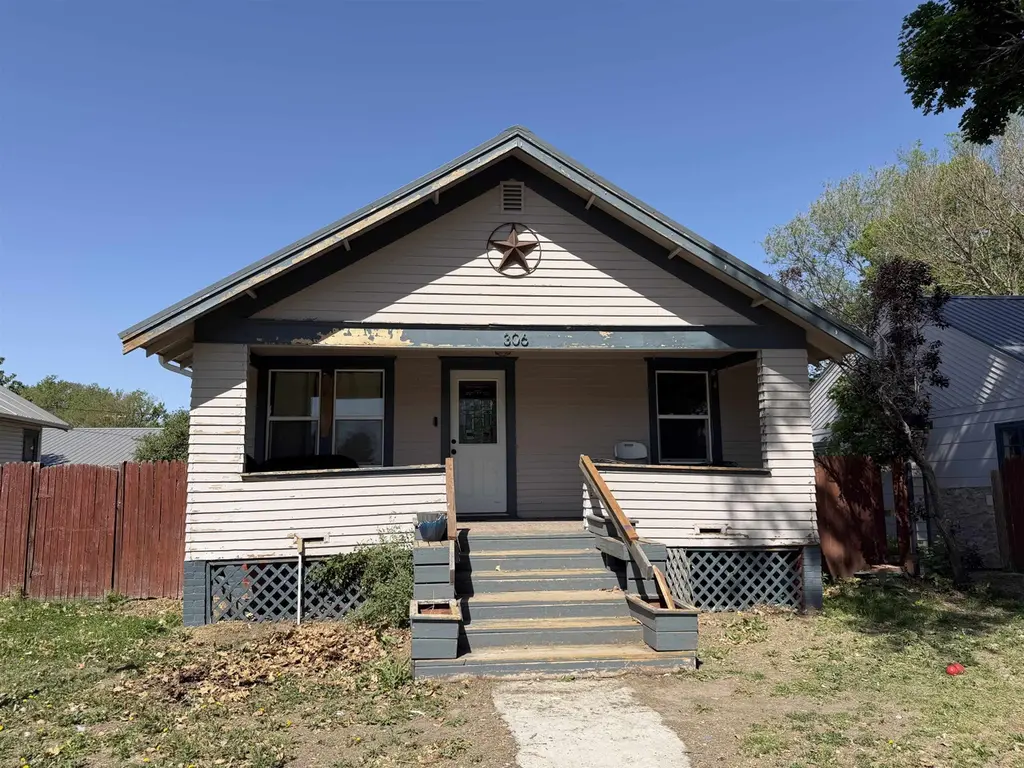
Condition & rehab AI · 1 photo
This home requires extensive repairs and maintenance, including roof replacement and exterior repairs, to become move-in ready and increase its value.
Repairs flagged
- Major roof — Exposed roof structure, missing shingles
- Major exterior siding — Weathered siding
- Major steps and handrails — Damaged
- Major landscaping — Overgrown vegetation
Value-add opportunities
- Both repair roof — Critical to the structural integrity and safety of the home
- Both repair exterior siding — Improves the home's appearance and value
- Both repair steps and handrails — Ensures safety and enhances curb appeal
- Both landscaping — Enhances curb appeal and adds value
Renovation cost estimate screening
| Repair item | Severity | Est. cost |
|---|---|---|
| roof · Exposed roof structure, missing shingles | Major | $15,000–50,000 |
| exterior siding · Weathered siding | Major | $15,000–50,000 |
| steps and handrails · Damaged | Major | $15,000–50,000 |
| landscaping · Overgrown vegetation | Major | $15,000–50,000 |
| Total estimated repair cost · 4 items | $60,000–200,000 |
Value-add ROI direction
- Both repair roof — Critical to the structural integrity and safety of the home ↑
- Both repair exterior siding — Improves the home's appearance and value ↑
- Both repair steps and handrails — Ensures safety and enhances curb appeal ↑
- Both landscaping — Enhances curb appeal and adds value ↑
ⓘ Cost ranges are severity-bucket heuristics (US national rule-of-thumb). Get contractor quotes + a written scope before underwriting a rehab budget.
Schools (NCES district)
- District
- Ravenna Public Schools
- NCES district ID
- 3175960
- Math proficiency
- 60% ▲ 15.00%
- Reading proficiency
- 50% ▼ -1.00%
- Median HH income
- $42,945
- Composite
- 48.09/100
- National rank
- #4760
- State rank
- #113 of 245 in NE
Livability — Ravenna
- Score
- 71/100
- State rank
- #199
- US rank
- #7147
Category grades
Schools grade is shown separately in the Schools card above.
Census & demographics
- Census place
- Ravenna, NE
Population outlook (Buffalo County) Hauer SSP2
- Today (2025)
- 54,980 people
- By 2030
- 58,298 · +6.0%
- By 2040
- 64,975 · +18.2%
- By 2050
- 72,054 · +31.1%
- By 2075
- 90,838 · +65.2%
- By 2100
- 106,838 · +94.3%
Not yet ingested
- Political lean
- —
- Race & ethnicity
- —
- Common origin
- —
- Civics
- —
Market trends
- HPI YoY
- —
- Current HPI
- —
- Rent YoY
- —
- Metro
- —
- State GDP YoY
- ▲ 0.68%
- F500 in state
- 2
Industry mix (Fortune 500 HQ in NE)
| Industry | F500 HQs | Revenue |
|---|---|---|
| Conglomerate | 1 | $371B |
|
||
Price history
+20.0% since first listed3 events — show timeline
- 2026-05-16 Listed $149,900 GMNMLS
- 2018-07-13 Sold (MLS) $118,000 GMNMLS
- 2017-10-06 Listed $124,900 GMNMLS
Cash-flow waterfall
monthlySold comps — $/sqft
last 12 mo · ≤1 miLoading sold comps…