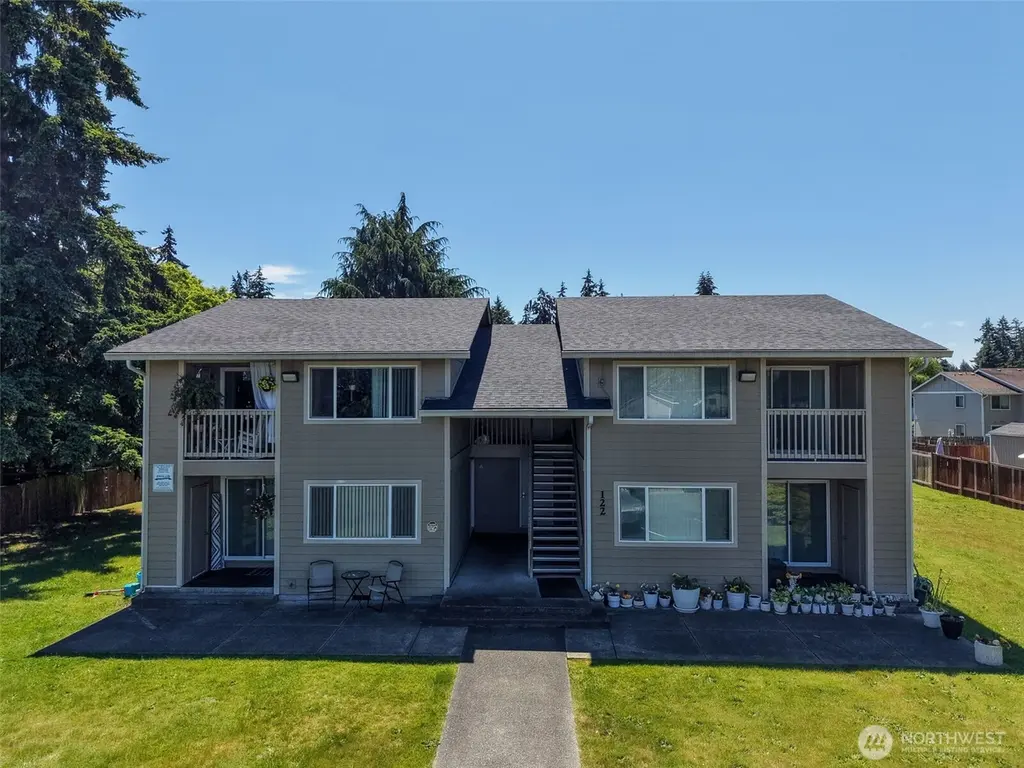
 Fourplex
122 169th St E · Spanaway, WA
Flood risk 1/10 · Minimal
- FEMA flood zone
- X (unshaded)
- Chance of flooding over 30 yrs
- 0.0%
- Est. flood insurance / yr
- $507 – $1,088
Fire risk 1/10 · Minimal
- Est. fire insurance / yr
- $604 – $1,122
Heat risk 3/10 · Minor
- Hot days now (above 87°F)
- 7 days/yr
- Hot days in 30 yrs
- 16 days/yr
Wind risk 1/10 · Minimal
- Chance of severe wind over 30 yrs
- —
Air-quality risk 7/10 · Major
- Unhealthy air days now
- 9 days/yr
- Unhealthy air days in 30 yrs
- 10 days/yr
Risk factors via First Street. Map © Google.
Why this score? — see what drove the D grade
The composite is a weighted blend of 9 inputs, each scored 0–100. Each bar is that input's sub-score; the figure is the points it added to the 100-point composite (weight × sub-score).
- Cash flow +13.4/30.0
- ARV discount +7.5/15.0
- Schools +4.9/10.0
- DSCR +4.0/10.0
- Livability +3.7/5.0
- Rent growth +3.6/5.0
- 1% rule +3.2/10.0
- Condition / age +2.5/5.0
- Appreciation +0.0/10.0
$999,950
🖨 Deal sheet (PDF) 📄 Offer letter ✓ Due diligence
Multi-family units
County records classify this as Multi-Family (2-4 Unit). Listing-text estimate: 4 units. confirmed
Listing remarks
Looking for a great investment? This clean 4 plex is just what you've been waiting for. Each unit has 2 bedrooms and 1 bath, good size living area and dining area. All units are in great shape and the roof is only a few months old! All remodeled inside and out several years ago, but they are still looking like new. Quartz countertops, stainless appliances and white cabinets. Laundry room on each floor, lot's of parking, huge lot, partial fenced. Close to schools, shopping, restaurants, bus, Spanaway Lake and JBLM. Great location! If your looking to build your portfolio, come take a look.
Key facts
- Quartz countertops
- White cabinets
- Stainless appliances
Tags
Property features AI
Finance
- Other: Calculated building area: 3,220 square feet; Total of 4 units in the building; Unit rents reported: #A $1,500; #C $1,500; #D $1,400; #E $1,500
- Financial info: Total monthly income reported: $5,900; Total expenses reported: $14,457; Insurance expense: $2,940; Listing terms: Cash or Conventional
Exterior
- Parking: 10 uncovered parking spaces
- Security: Partially fenced for security/privacy
- Utilities: Electric service; Public water (Spanaway Water); Septic tank sewer (Pierce County); Xfinity cable connected
- Home design: Quadruplex (residential income, multi-family); 2-story building; Has a view; Built/updated effectively in 1977
- Construction: Cement and wood construction; Composition roof; Poured concrete foundation; Effective year built 1977
- Exterior features: Cement/concrete and wood product exterior; Deck; Patio; Partially fenced lot; Paved site
Interior
- Kitchen: Each unit includes a range/oven; Each unit includes a refrigerator; Each unit includes a dishwasher
- Bedrooms: Four 2-bedroom units (#A, #C, #D, #E)
- Flooring: Vinyl flooring; Carpet flooring
- Bathrooms: Each unit has 1 bathroom
- Heating & cooling: Baseboard heating; No central air
- Interior features: Vinyl and carpet flooring; Baseboard heating; Partially fenced
- Laundry & utility: Each unit has washer/dryer hookups
Neighborhood map
What this means for you Summary
Snapshot
- This is a 4 × 2-bed/1.0-bath units multifamily listed at $1000k.
Deal economics
- At list price, monthly cash flow is $17 ($203/yr) — positive. Per door: $4/mo.
- The deal already cash-flows at list — no discount required.
- To meet the 1% rule (rent ≥ 1% of price), the offer needs to be $816k (18.4% below list).
- Recommended offer: $816k (18.4% below list) — sets the bar for 1% rule.
- Cap rate 6.3% vs local median 3.6% in Spanaway — top-decile yield for the area; either an underpriced asset or a hidden risk that comps aren't pricing in. Stress-test before assuming the spread holds.
Location & tenants
- Location reads 74/100 on livability (#184 in WA, #4,891 nationally) — a middle-class / working-renter tenant base. Strengths: housing A+, employment A, commute A-; Watch: cost of living C-, health & safety C-, crime D-.
- Bethel School District (suburban): math 47% / reading 59% proficiency, ranked #103 of 291 in WA (top 35%) — acceptable for families but not a draw, mixed tenant base, ~2y average lease.
- Zoned schools: Chester H Thompson Elementary (624 students, 68% FRL); Spanaway Middle School (720 students, 70% FRL); Spanaway Lake High School (1,817 students, 64% FRL) — zoned schools average 67% FRL vs 36% district-wide (31 pts higher); higher-poverty schools than district average — tighter screening recommended.
- Market conditions: Rents rising fast (+4.2%/yr); 388 active listings in the ZIP; solid renter incomes; 3,209 units permitted in Pierce County in 2024 (1,269 in 5+ unit buildings).
- At $8,161/mo this rent would consume 92% of the median local household income ($107k/yr) (locally 807% of renters already pay >50% of income on rent) — very limited rent-growth headroom before tenants either downsize or default.
Forward outlook
- Local home prices are declining (-3.0%/yr); year-one equity from $7k of loan paydown is wiped out by about $30k of value loss. Plan a longer hold.
- Pierce County population projected at +26% by 2050 — long-run rental-demand tailwind backs the buy-and-hold thesis.
Negotiation context
- Only 8 days on market — expect competitive offers; lowballing is unlikely to land.
- 3 sale attempts since 2y ago with the ask held roughly flat each time — persistent listings suggest the price (not the market) is what's stuck; bring a comps-based counter.
- Current owner paid $188k; list at $1000k implies a 433% gain — meaningful room to come down on a strong offer.
Questions for the listing agent
- Can we see the unit-by-unit rent roll, current vacancy, and any below-market leases? What's the average tenancy length?
- What capital expenditures (roof, boiler, parking lot, exteriors) have been made in the last 5 years, and what's planned in the next 2?
- Built in 1977 — when were the roof, HVAC, electrical panel, plumbing, and water heater last replaced?
- Is there a deadline driving the sale (1031 exchange, divorce, estate, relocation)? That informs how much negotiation room exists.
- Schools are B-rated — typically a magnet for longer-tenancy family renters. What's the average tenant stay here, and is there a school-zone premium baked into asking?
- Crime grade is D in this area — have there been break-ins, vandalism, or insurance claims at this property in the last 3 years? What carrier currently insures it and at what premium?
- The area grade is low — what's the realistic commute time and amenity access for the typical tenant pool here? Any planned neighborhood developments (good or bad) we should know about?
- What's the average days-on-market for RENTAL listings here right now (not sales)? A rising rental-DOM trend means longer vacancies and softer asking-rent achievability than the comps imply.
- What's the recent tenant-quality profile in this submarket — average credit score on applications, eviction rate, late-payment / NSF rate, and stable-employment percentage? A property-management company in the area should have these aggregated.
- How much new apartment / multifamily construction is in the pipeline within 1–3 miles? Heavy new supply (>2% of stock underway) typically softens rents 12–24 months out; light construction supports rent growth.
Investment metrics
- 1% rule
- 0.82% ✗
- Cap rate
- 6.31%
- Cash-on-cash
- 0.07%
- DSCR
- 1.00
- GRM
- 10.2
CMA / ARV
No comps found within radius.
Projected returns pro-forma
-3.0% appreciation · 4.24% rent growth · sell at horizon
- IRR
- -14.9%
- Equity multiple
- 0.46×
- Total profit
- $-150,825
- Equity at exit
- $149,096
- IRR
- -4.5%
- Equity multiple
- 0.69×
- Total profit
- $-87,271
- Equity at exit
- $86,457
Cash invested: $279,986 (down + closing). Projections, not guarantees.
Landlord ↔ Tenant lean methodology
- Overall (STATE)
- 28 Tenant-Leaning
- State Washington
- 28 Tenant-Leaning · D+8
- County
- — inherits STATE
- City
- — inherits STATE
ZIP-level market 98387
- Rents YoY
- 4.2%
- Active inventory
- 388
- Price-to-rent
- 40.8×
Monthly cashflow live
- Estimated rent
- $8,161 high interval (Pro) →
- Mortgage (P&I)
- −$5,244
- Tax from tax record
- −$770 /mo · $9,238/yr
- Insurance
- −$417
- HOA
- −$0
- Vacancy / Maint / Mgmt
- −$1,714
- Net cashflow
- $17
Break-even live
Sensitivity live
| Price | -10% $583 | -5% $300 | +0% $17 | +5% $-266 | +10% $-549 |
|---|---|---|---|---|---|
| Rent | -10% $-628 | -5% $-305 | +0% $17 | +5% $339 | +10% $662 |
| Rate | -1.0pp $520 | -0.5pp $271 | base $17 | +0.5pp $-242 | +1.0pp $-506 |
4-unit breakdown (identical units grouped — click to expand)
| Units | Beds | Baths | Est. rent |
|---|---|---|---|
| 4× units | 2 | 1 | $8,160 |
| #1 | 2 | 1 | $2,040 |
| #2 | 2 | 1 | $2,040 |
| #3 | 2 | 1 | $2,040 |
| #4 | 2 | 1 | $2,040 |
| Total (4 units) | $8,161 | ||
UW: 25.0% down · 7.5% · 30yr · 1.5% tax · 5.0% vac · 8.0% maint · 8.0% mgmt
Financing live
Cash to close
- Down payment
- $249,988
- Closing costs
- $29,998
- Reserves months
- —
- Total cash needed
- —
Loan-product check · same deal, 3 products live
Conventional
25% down · 7.5% · 30yr
- Down + closing
- —
- Monthly P&I
- —
- Monthly cashflow
- —
- DSCR
- —
- Eligible?
- —
Personal DTI + credit; lowest rate.
DSCR
20% down · 8.5% · 30yr
- Down + closing
- —
- Monthly P&I
- —
- Monthly cashflow
- —
- DSCR
- —
- Eligible?
- —
No personal income docs; deal must DSCR.
Hard money
10% down · 12.0% · 12mo
- Down + closing
- —
- Monthly P&I
- —
- Monthly cashflow
- —
- DSCR
- —
- Eligible?
- —
Short-term bridge; refi at stabilization.
Listing history 7 events
-
2026-06-21days on market $999,950 Active 8 DOM
-
2026-06-18days on market $999,950 Active 5 DOM
-
2026-06-17days on market $999,950 Active 4 DOM
-
2026-06-16days on market $999,950 Active 3 DOM
-
2026-06-15days on market $999,950 Active 2 DOM
-
2026-06-13remarks 594-char remark
-
2026-06-13$999,950 Active 1 DOM
ⓘ Source: listings_history table (triggers on properties + properties_extension) + one-shot
backfill from property_details.listing_events for pre-trigger history.
Tax reassessment forecast WA · Resets to sale price
- Current annual tax
- $9,238 · $770/mo
- Projected year-2 tax
- $9,800 · $817/mo
- Expected delta
- +$562/yr (+$47/mo · 6.1%)
ⓘ Screening estimate from a state-policy table — verify with the county assessor before closing.
Climate risk First Street
- Flood 1/10 Low FEMA zone X (unshaded) · 0% chance over 30 yrs
- Wildfire 1/10 Low
- Heat 3/10 Moderate 7 d/yr ≥87°F today · 16 d/yr by 30 yrs out
- Wind 1/10 Low
- Air quality 7/10 Severe 9 unhealthy d/yr today · 10 by 30 yrs out
Nearby sold comps map
Loading sold comps map…
Walkable amenities ~0.75 mi
Loading nearby amenities…
Taxation est. · year 1
- Rental income
- $97,932
- − Mortgage interest
- −$56,013
- − Property taxes
- −$9,238
- − Insurance
- −$5,000
- − Repairs & maintenance
- −$7,835
- − Management
- −$7,835
- − Depreciation
- −$29,089
- Taxable loss
- −$17,077
- Est. tax savings @ 24.0%
- +$4,098
- After-tax cash flow
- $4,301/yr
For passive investors: Depreciation is non-cash, so a rental often shows a tax loss while cash-flowing — sheltering income. Rental losses are passive: they offset passive income freely, and up to $25,000/yr can offset ordinary (W-2) income if you actively participate and your MAGI is under $100k (phasing out to $0 by $150k); unused losses carry forward. On sale, claimed depreciation is recaptured at up to 25%, and gains may owe capital-gains tax (a 1031 exchange can defer both). Figures are a year-1 estimate at your 24.0% rate — not tax advice; consult a CPA.
Schools (NCES district)
- District
- Bethel School District
- NCES district ID
- 5300480
- Math proficiency
- 47% ▬ 0.00%
- Reading proficiency
- 59% ▲ 2.00%
- Median HH income
- $65,872
- Composite
- 48.66/100
- National rank
- #4568
- State rank
- #103 of 291 in WA
Livability — Spanaway
- Score
- 74/100
- State rank
- #184
- US rank
- #4891
Category grades
Schools grade is shown separately in the Schools card above.
Census & demographics
- Census place
- Spanaway, WA
- County
- Pierce County · 788,257 people
- City population
- 50,774
- Metro
- Seattle-Tacoma-Bellevue, WA
- Population (ZIP)
- 50,774
- Household income
- $106,872
- Rent vs Own
- Severe rent burden
- 807.0
Population outlook (Pierce County) Hauer SSP2
- Today (2025)
- 956,648 people
- By 2030
- 1,010,862 · +5.7%
- By 2040
- 1,113,170 · +16.4%
- By 2050
- 1,206,524 · +26.1%
- By 2075
- 1,436,425 · +50.2%
- By 2100
- 1,563,654 · +63.5%
Race, ethnicity, and origin ACS 2023
- Neighborhood character
- Diverse neighborhood (Simpson 0.68)
- Race & ethnicity
- White 53% Two or more races 18% Hispanic / Latino 16% Black 10% Asian 6% Pacific Islander 4%
- Hispanic origin (detail)
- Mexican 10% Puerto Rican 2%
- Common ancestry
- Portuguese 3% Italian 3% Slovak 2%
- Foreign-born
- 11% · Canada, South Korea
- Languages at home
- 82% English-only · Spanish 7% Russian/Polish/Slavic 2% Other Asian/Pacific 2%
Political lean MEDSL · Pierce
- 2024 margin
- D (+10.8) · D 53.9% · R 43.1% · Other 3.0%
- 2008→2024 swing
- -1.4pp toward R · 2008: 12.2pp · 2024: 10.8pp
- All cycles
- 2024: D+10.8 2020: D+11.2 2016: D+7.5 2012: D+11.0 2008: D+12.2
Not yet ingested
- Civics
- —
Market trends
- HPI YoY
- ▼ -208.94%
- Current HPI
- 308.0462
- Rent YoY
- ▲ 4.24%
- Metro
- Seattle-Tacoma-Bellevue, WA
- State GDP YoY
- ▲ 4.65%
- F500 in state
- 22
Industry mix (Fortune 500 HQ in WA)
| Industry | F500 HQs | Revenue |
|---|---|---|
| Retail | 2 | $269B |
|
||
| Technology / Retail | 1 | $638B |
|
||
| Technology | 1 | $245B |
|
||
| Telecommunications | 1 | $38B |
|
||
| Food / Beverage | 1 | $36B |
|
||
| Automotive / Trucks | 1 | $34B |
|
||
Price history
+433.3% since first listed6 events — show timeline
- 2026-06-13 Listed $999,950 NWMLS as Distributed by MLS Grid
- 2025-08-02 Rental Removed $1,500 TURBOTENANT
- 2025-07-03 Listed for Rent $1,500 TURBOTENANT
- 2024-11-16 Rental Removed $1,450 TURBOTENANT
- 2024-09-17 Listed for Rent $1,450 TURBOTENANT
- 2000-05-26 Sold (Public Records) $187,500 Public Records
Property tax history
+5.0%/yrLatest (2026): $9,238 · +0.8% YoY. Source: county tax records.
Cash-flow waterfall
monthlySold comps — $/sqft
last 12 mo · ≤1 miLoading sold comps…