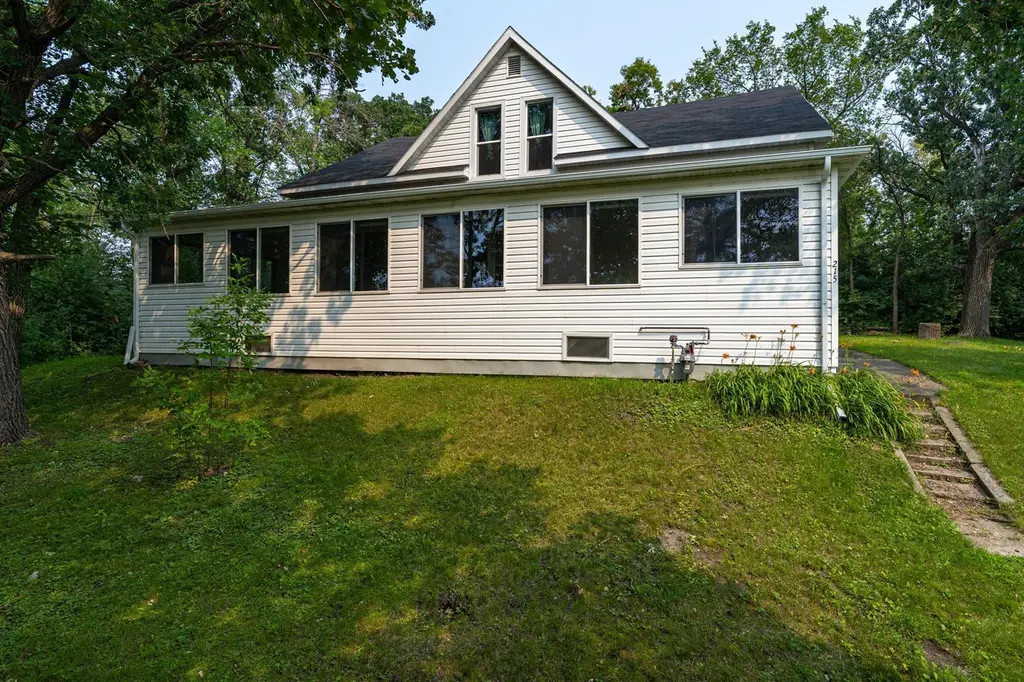
215 Main Ave N · Red Lake Falls, MN
Flood risk 1/10 · Minimal
- FEMA flood zone
- X (unshaded)
- Chance of flooding over 30 yrs
- 0.0%
- Est. flood insurance / yr
- $473 – $860
Fire risk 3/10 · Minor
- Est. fire insurance / yr
- $888 – $1,650
Heat risk 1/10 · Minimal
- Hot days now (above 96°F)
- 7 days/yr
- Hot days in 30 yrs
- 12 days/yr
Wind risk 1/10 · Minimal
- Chance of severe wind over 30 yrs
- —
Air-quality risk 4/10 · Minor
- Unhealthy air days now
- 4 days/yr
- Unhealthy air days in 30 yrs
- 4 days/yr
Risk factors via First Street. Map © Google.
Why this score? — see what drove the C+ grade
The composite is a weighted blend of 9 inputs, each scored 0–100. Each bar is that input's sub-score; the figure is the points it added to the 100-point composite (weight × sub-score).
- Cash flow +24.2/30.0
- ARV discount +11.6/15.0
- DSCR +7.8/10.0
- 1% rule +6.1/10.0
- Schools +4.0/10.0
- Livability +3.9/5.0
- Rent growth +2.5/5.0
- Condition / age +2.5/5.0
- Appreciation +0.0/10.0
$129,000
🖨 Deal sheet 📄 Offer letter ✓ Due diligence
Listing remarks MLS
Beautiful, original hardwood floors and woodwork throughout this unique home! Foyer with open staircase. Three bedrooms upstairs with an extra room over the garage for storage. Large kitchen with plenty of cabinet space and main floor laundry. Enjoy the privacy of this location!
Key facts
- Open staircase
- Main floor laundry
- 0.49 acre lot
Tags
Neighborhood map
What this means for you Summary
Snapshot
- This is a 3-bed/2.0-bath single-family listed at $129k.
Deal economics
- At list price, monthly cash flow is $257 ($3k/yr) — positive.
- The deal already cash-flows at list — no discount required.
- Meets the 1% rule at list price ($1k rent vs $129k).
- Recommended offer: $114k (12.0% below list) — sets the bar for market timing.
Location & tenants
- Location reads 77/100 on livability (#142 in MN, #3,078 nationally) — a middle-class / working-renter tenant base. Strengths: crime A+, cost of living A+, housing A+; Watch: amenities F, commute F.
- Red Lake Falls Public School District (rural): math 46% / reading 48% proficiency, ranked #156 of 301 in MN (top 52%) — families likely to look elsewhere, expect single-tenant / working-renter base with shorter leases.
- Market conditions: 13 active listings in the ZIP; 2 units permitted in Red Lake County in 2024 (0 in 5+ unit buildings).
Forward outlook
- Local home prices are declining (-3.0%/yr); year-one equity from $892 of loan paydown is wiped out by about $4k of value loss. Plan a longer hold.
- Red Lake County population projected at -13% by 2050 — secular population decline; favor cash flow + early exit over multi-decade hold.
Negotiation context
- It's been on market 321 days — a 12% lower offer ($114k) is reasonable based on typical stale-listing flexibility.
- 2 sale attempts with the ask held roughly flat each time — persistent listings suggest the price (not the market) is what's stuck; bring a comps-based counter.
Risks & watch-outs
- Watch-outs: built in 1912 — expect roof / HVAC / electrical / plumbing capex.
Questions for the listing agent
- It's been on market 321 days. Have you received any prior offers? Is the seller open to a 12% concession, seller financing, or rate buy-down credit?
- Built in 1912 — when were the roof, HVAC, electrical panel, plumbing, and water heater last replaced?
- Why hasn't it sold? Are there any deal-killer items the seller is aware of (foundation, flood, title, zoning, code violations)?
- Is there a deadline driving the sale (1031 exchange, divorce, estate, relocation)? That informs how much negotiation room exists.
- Schools are B-rated — typically a magnet for longer-tenancy family renters. What's the average tenant stay here, and is there a school-zone premium baked into asking?
- What's the average days-on-market for RENTAL listings here right now (not sales)? A rising rental-DOM trend means longer vacancies and softer asking-rent achievability than the comps imply.
- What's the recent tenant-quality profile in this submarket — average credit score on applications, eviction rate, late-payment / NSF rate, and stable-employment percentage? A property-management company in the area should have these aggregated.
- How much new for-sale + rental construction is in the pipeline within 1–3 miles? Heavy new supply typically softens prices + rents 12–24 months out; constrained supply supports both.
Investment metrics
- 1% rule
- 1.11% ✓
- Cap rate
- 8.69%
- Cash-on-cash
- 8.54%
- DSCR
- 1.38
- GRM
- 7.5
CMA / ARV
- ARV (median comp)
- $142,077
- List price
- $129,000
- Delta
- -9.20%
- Verdict
- FAIR
- Comps
- 3 within 1.0 mi
Show comp detail 1 sale within ~0.75 mi
| Address | Dist | Beds/Ba | Sqft | Sold | Price | $/sf | Match |
|---|---|---|---|---|---|---|---|
| 602 Falls Ave SW | 0.68mi | 4/2.0 (+1) | 2,160 (-14%) | 13mo | $235,000 | $109 | 28 |
Match score weights: distance 35% · size 25% · config 20% · recency 20%. Top-matched comps best support the ARV.
Projected returns pro-forma
-3.0% appreciation · 3.0% rent growth · sell at horizon
- IRR
- -3.3%
- Equity multiple
- 0.88×
- Total profit
- $-4,513
- Equity at exit
- $19,234
- IRR
- 6.4%
- Equity multiple
- 1.48×
- Total profit
- $17,207
- Equity at exit
- $11,154
Cash invested: $36,120 (down + closing). Projections, not guarantees.
Landlord ↔ Tenant lean methodology
- Overall (STATE)
- 46 Balanced
- State Minnesota
- 46 Balanced · D+2
- County
- — inherits STATE
- City
- — inherits STATE
ZIP-level market 56750
- Home prices YoY
- -20.5%
- Active inventory
- 13
- Price-to-rent
- 7.5×
Monthly cashflow live
- Estimated rent
- $1,433 medium interval (Pro) →
- Mortgage (P&I)
- −$676
- Tax from tax record
- −$145 /mo · $1,736/yr
- Insurance
- −$54
- HOA
- −$0
- Vacancy / Maint / Mgmt
- −$301
- Net cashflow
- $257
Break-even live
UW: 25.0% down · 7.5% · 30yr · 1.5% tax · 5.0% vac · 8.0% maint · 8.0% mgmt
Financing live
Cash to close
- Down payment
- $32,250
- Closing costs
- $3,870
- Reserves months
- —
- Total cash needed
- —
Loan-product check · same deal, 3 products live
Conventional
25% down · 7.5% · 30yr
- Down + closing
- —
- Monthly P&I
- —
- Monthly cashflow
- —
- DSCR
- —
- Eligible?
- —
Personal DTI + credit; lowest rate.
DSCR
20% down · 8.5% · 30yr
- Down + closing
- —
- Monthly P&I
- —
- Monthly cashflow
- —
- DSCR
- —
- Eligible?
- —
No personal income docs; deal must DSCR.
Hard money
10% down · 12.0% · 12mo
- Down + closing
- —
- Monthly P&I
- —
- Monthly cashflow
- —
- DSCR
- —
- Eligible?
- —
Short-term bridge; refi at stabilization.
Listing history 17 events
-
2026-06-18days on market $129,000 Active 321 DOM
-
2026-06-17days on market $129,000 Active 320 DOM
-
2026-06-16days on market $129,000 Active 319 DOM
-
2026-06-15days on market $129,000 Active 318 DOM
-
2026-06-13days on market $129,000 Active 316 DOM
-
2026-06-12days on market $129,000 Active 315 DOM
-
2026-06-09days on market $129,000 Active 312 DOM
-
2026-06-08days on market $129,000 Active 311 DOM
-
2026-06-07days on market $129,000 Active 310 DOM
-
2026-06-07days on market $129,000 Active 309 DOM
-
2026-06-04days on market $129,000 Active 306 DOM
-
2026-06-02days on market $129,000 Active 305 DOM
-
2026-06-01days on market $129,000 Active 304 DOM
-
2026-05-31days on market $129,000 Active 303 DOM
-
2026-05-31days on market $129,000 Active 302 DOM
-
2025-08-01$129,000 Active 279-char remark
Show marketing remark (279 chars)
Beautiful, original hardwood floors and woodwork throughout this unique home! Foyer with open staircase. Three bedrooms upstairs with an extra room over the garage for storage. Large kitchen with plenty of cabinet space and main floor laundry. Enjoy the privacy of this location!
ⓘ Source: listings_history table (triggers on properties + properties_extension) + one-shot
backfill from property_details.listing_events for pre-trigger history.
Tax reassessment forecast MN · Partial reset (capped growth)
- Current annual tax
- $1,736 · $145/mo
- Projected year-2 tax
- $1,736 · $145/mo
- Expected delta
- $0/yr ($0/mo · 0.0%)
ⓘ Screening estimate from a state-policy table — verify with the county assessor before closing.
Climate risk First Street
- Flood 1/10 Low FEMA zone X (unshaded) · 0% chance over 30 yrs
- Wildfire 3/10 Moderate
- Heat 1/10 Low 7 d/yr ≥96°F today · 12 d/yr by 30 yrs out
- Wind 1/10 Low
- Air quality 4/10 Moderate 4 unhealthy d/yr today · 4 by 30 yrs out
Nearby sold comps map
Loading sold comps map…
Walkable amenities ~0.75 mi
Loading nearby amenities…
Taxation est. · year 1
- Rental income
- $17,196
- − Mortgage interest
- −$7,226
- − Property taxes
- −$1,736
- − Insurance
- −$645
- − Repairs & maintenance
- −$1,376
- − Management
- −$1,376
- − Depreciation
- −$3,753
- Taxable income
- $1,085
- Est. tax owed @ 24.0%
- −$260
- After-tax cash flow
- $2,826/yr
For passive investors: Depreciation is non-cash, so a rental often shows a tax loss while cash-flowing — sheltering income. Rental losses are passive: they offset passive income freely, and up to $25,000/yr can offset ordinary (W-2) income if you actively participate and your MAGI is under $100k (phasing out to $0 by $150k); unused losses carry forward. On sale, claimed depreciation is recaptured at up to 25%, and gains may owe capital-gains tax (a 1031 exchange can defer both). Figures are a year-1 estimate at your 24.0% rate — not tax advice; consult a CPA.
Schools (NCES district)
- District
- Red Lake Falls Public School District
- NCES district ID
- 2730450
- Math proficiency
- 46% ▼ -9.00%
- Reading proficiency
- 48% ▼ -7.00%
- Median HH income
- $50,088
- Composite
- 40.3/100
- National rank
- #3756
- State rank
- #156 of 301 in MN
Livability — Red Lake Falls
- Score
- 77/100
- State rank
- #142
- US rank
- #3078
Category grades
Schools grade is shown separately in the Schools card above.
Census & demographics
- Census place
- Red Lake Falls, MN
- Population (ZIP)
- 2,280
Population outlook (Red Lake County) Hauer SSP2
- Today (2025)
- 3,902 people
- By 2030
- 3,807 · -2.4%
- By 2040
- 3,587 · -8.1%
- By 2050
- 3,382 · -13.3%
- By 2075
- 3,091 · -20.8%
- By 2100
- 2,881 · -26.2%
Race, ethnicity, and origin ACS 2023
- Neighborhood character
- Predominantly White (91%)
- Race & ethnicity
- White 91% Two or more races 4% Hispanic / Latino 3% Native American 2%
- Common ancestry
- Portuguese 20% Lithuanian 18% Italian 3%
- Foreign-born
- 1% · Canada, South Korea
- Languages at home
- 97% English-only · Spanish 2% French/Haitian/Cajun 1%
Political lean MEDSL · Red Lake
- 2024 margin
- Solid R (+37.1) · D 30.4% · R 67.5% · Other 2.0%
- 2008→2024 swing
- -43.4pp toward R · 2008: 6.2pp · 2024: -37.1pp
- All cycles
- 2024: R+37.1 2020: R+34.7 2016: R+32.1 2012: R+2.5 2008: D+6.2
Not yet ingested
- Civics
- —
Market trends
- HPI YoY
- ▼ -35.35%
- Current HPI
- 137.2603
- Rent YoY
- —
- Metro
- —
- State GDP YoY
- ▲ 2.41%
- F500 in state
- 34
Industry mix (Fortune 500 HQ in MN)
| Industry | F500 HQs | Revenue |
|---|---|---|
| Healthcare | 2 | $407B |
|
||
| Retail | 2 | $150B |
|
||
| Consumer Goods | 2 | $32B |
|
||
| Industrial Machinery | 2 | $6B |
|
||
| Agriculture | 1 | $40B |
|
||
| Healthcare / Medical Devices | 1 | $32B |
|
||
Price history
+0.0% since first listed2 events — show timeline
- 2025-08-01 Listed $129,000 GFAAR
- 2025-08-01 Listed $129,000 NORTHSTARMLS as Distributed by MLS Grid
Property tax history
+1.3%/yrLatest (2026): $1,736 · -1.3% YoY. Source: county tax records.
Cash-flow waterfall
monthlySold comps — $/sqft
last 12 mo · ≤1 miLoading sold comps…