300 Falmouth Rd · Mashpee, MA
Flood risk No data
- FEMA flood zone
- —
- Chance of flooding over 30 yrs
- —
- Est. flood insurance / yr
- —
Fire risk No data
- Est. fire insurance / yr
- —
Heat risk No data
- Hot days now (above threshold)
- —
- Hot days in 30 yrs
- —
Wind risk No data
- Chance of severe wind over 30 yrs
- —
Air-quality risk No data
- Unhealthy air days now
- —
- Unhealthy air days in 30 yrs
- —
Risk factors via First Street. Map © Google.
Why this score? — see what drove the C+ grade
The composite is a weighted blend of 9 inputs, each scored 0–100. Each bar is that input's sub-score; the figure is the points it added to the 100-point composite (weight × sub-score).
- Cash flow +24.6/30.0
- ARV discount +15.0/15.0
- DSCR +7.9/10.0
- 1% rule +6.4/10.0
- Schools +3.8/10.0
- Rent growth +2.5/5.0
- Livability +2.5/5.0
- Condition / age +2.2/5.0
- Appreciation +0.0/10.0
$352,000
🖨 Deal sheet 📄 Offer letter ✓ Due diligence
Listing remarks MLS
Very spacious colonial style condo located in Summerwood. This interior unit offers versatility with a full basement. Convenient to everything the Cape has to offer anyone can enjoy this unit year round or just for your own summer use. Sold As is.
Key facts
- Plenty of storage
- New pergo floors
- Built 1982
Tags
Neighborhood map
What this means for you Summary
Snapshot
- This is a 2-bed/2.0-bath single-family listed at $352k. Condition is rated fair.
Deal economics
- At list price, monthly cash flow is $727 ($9k/yr) — positive.
- The deal already cash-flows at list — no discount required.
- Meets the 1% rule at list price ($4k rent vs $352k).
Location & tenants
- Location reads: area grade C — affects rentability + tenant quality, not the cash-flow math above.
- Mashpee (suburban): math 34% / reading 51% proficiency, ranked #183 of 302 in MA (top 61%) — families likely to look elsewhere, expect single-tenant / working-renter base with shorter leases.
- Market conditions: 144 active listings in the ZIP; 1 comparable units currently listed for rent nearby; 657 units permitted in Barnstable County in 2024 (178 in 5+ unit buildings).
Forward outlook
- Local home prices are declining (-3.0%/yr); year-one equity from $2k of loan paydown is wiped out by about $11k of value loss. Plan a longer hold.
- Barnstable County population projected at -20% by 2050 — secular population decline; favor cash flow + early exit over multi-decade hold.
Negotiation context
- Only 13 days on market — expect competitive offers; lowballing is unlikely to land.
- 5 sale attempts since 26y ago with the ask held roughly flat each time — persistent listings suggest the price (not the market) is what's stuck; bring a comps-based counter.
- Current owner paid $114k; list at $352k implies a 209% gain — meaningful room to come down on a strong offer.
Questions for the listing agent
- Have any recent inspections been done? Can we get a copy of the seller's disclosures and any deferred-maintenance estimates?
- Is there a deadline driving the sale (1031 exchange, divorce, estate, relocation)? That informs how much negotiation room exists.
- What's the average days-on-market for RENTAL listings here right now (not sales)? A rising rental-DOM trend means longer vacancies and softer asking-rent achievability than the comps imply.
- What's the recent tenant-quality profile in this submarket — average credit score on applications, eviction rate, late-payment / NSF rate, and stable-employment percentage? A property-management company in the area should have these aggregated.
- How much new for-sale + rental construction is in the pipeline within 1–3 miles? Heavy new supply typically softens prices + rents 12–24 months out; constrained supply supports both.
Investment metrics
- 1% rule
- 1.14% ✓
- Cap rate
- 8.77%
- Cash-on-cash
- 8.86%
- DSCR
- 1.39
- GRM
- 7.3
CMA / ARV
- ARV (on-the-fly)
- $552,780
- Comps found
- 9
Show comp detail 9 sales within ~0.75 mi
| Address | Dist | Beds/Ba | Sqft | Sold | Price | $/sf | Match |
|---|---|---|---|---|---|---|---|
| 145 Quinaquisset Ave | 0.46mi | 3/1.0 (+1) | 1,124 (+1%) | 0mo | $500,000 | $445 | 67 |
| 43 Ships Lantern Dr | 0.44mi | 3/2.0 (+1) | 1,110 (0%) | 22mo | $575,000 | $518 | 56 |
| 25 Rainbow Ln | 0.62mi | 3/1.5 (+1) | 1,152 (+4%) | 3mo | $600,000 | $521 | 56 |
| 7 Ships Rudder Dr | 0.57mi | 3/1.5 (+1) | 1,144 (+3%) | 24mo | $540,000 | $472 | 41 |
| 28 Compass Dr | 0.53mi | 3/1.5 (+1) | 1,188 (+7%) | 20mo | $480,000 | $404 | 40 |
| 11 Chatham Ln | 0.36mi | 3/1.0 (+1) | 960 (-14%) | 21mo | $500,000 | $521 | 34 |
| 31 Mashpee Neck Rd | 0.58mi | 2/2.5 | 1,274 (+15%) | 16mo | $585,000 | $459 | 33 |
| 18 Ships Lantern Dr | 0.50mi | 3/1.0 (+1) | 989 (-11%) | 23mo | $493,000 | $498 | 30 |
| 7 Porthole Dr | 0.65mi | 2/1.0 | 944 (-15%) | 22mo | $475,000 | $503 | 22 |
Match score weights: distance 35% · size 25% · config 20% · recency 20%. Top-matched comps best support the ARV.
Projected returns pro-forma
-3.0% appreciation · 3.0% rent growth · sell at horizon
- IRR
- -2.9%
- Equity multiple
- 0.89×
- Total profit
- $-10,650
- Equity at exit
- $52,484
- IRR
- 6.8%
- Equity multiple
- 1.51×
- Total profit
- $50,627
- Equity at exit
- $30,435
Cash invested: $98,560 (down + closing). Projections, not guarantees.
Landlord ↔ Tenant lean methodology
- Overall (STATE)
- 20 Strongly Tenant-Friendly
- State Massachusetts
- 20 Strongly Tenant-Friendly · D+15
- County
- — inherits STATE
- City
- — inherits STATE
ZIP-level market 02649
- Home prices YoY
- -32.6%
- Active inventory
- 144
- Price-to-rent
- 7.3×
Monthly cashflow live
- Estimated rent
- $4,000 medium interval (Pro) →
- Mortgage (P&I)
- −$1,846
- Tax est. 1.5%
- −$440 /mo · $5,280/yr
- Insurance
- −$147
- HOA
- −$0
- Vacancy / Maint / Mgmt
- −$840
- Net cashflow
- $727
Break-even live
UW: 25.0% down · 7.5% · 30yr · 1.5% tax · 5.0% vac · 8.0% maint · 8.0% mgmt
Financing live
Cash to close
- Down payment
- $88,000
- Closing costs
- $10,560
- Reserves months
- —
- Total cash needed
- —
Loan-product check · same deal, 3 products live
Conventional
25% down · 7.5% · 30yr
- Down + closing
- —
- Monthly P&I
- —
- Monthly cashflow
- —
- DSCR
- —
- Eligible?
- —
Personal DTI + credit; lowest rate.
DSCR
20% down · 8.5% · 30yr
- Down + closing
- —
- Monthly P&I
- —
- Monthly cashflow
- —
- DSCR
- —
- Eligible?
- —
No personal income docs; deal must DSCR.
Hard money
10% down · 12.0% · 12mo
- Down + closing
- —
- Monthly P&I
- —
- Monthly cashflow
- —
- DSCR
- —
- Eligible?
- —
Short-term bridge; refi at stabilization.
Rent comps 1 comps
| Address | Beds | Baths | Sqft | Rent | $/sqft | DOM | Units | Dist |
|---|---|---|---|---|---|---|---|---|
| 87 Park Place Way Mashpee, MA | 3.0 | 2.0 | 1056 | $4,000 | $3.79 | 44d | 1 | 1.21mi |
Listing history 10 events
-
2026-06-18days on market $352,000 Active 13 DOM
-
2026-06-17days on market $352,000 Active 12 DOM
-
2026-06-16days on market $352,000 Active 11 DOM
-
2026-06-15days on market $352,000 Active 10 DOM
-
2026-06-13days on market $352,000 Active 8 DOM
-
2026-06-12days on market $352,000 Active 7 DOM
-
2026-06-09days on market $352,000 Active 4 DOM
-
2026-06-08days on market $352,000 Active 3 DOM
-
2026-06-07remarks 532-char remark
-
2026-06-07$352,000 Active 2 DOM
ⓘ Source: listings_history table (triggers on properties + properties_extension) + one-shot
backfill from property_details.listing_events for pre-trigger history.
Nearby sold comps map
Loading sold comps map…
Walkable amenities ~0.75 mi
Loading nearby amenities…
Taxation est. · year 1
- Rental income
- $48,000
- − Mortgage interest
- −$19,717
- − Property taxes
- −$5,280
- − Insurance
- −$1,760
- − Repairs & maintenance
- −$3,840
- − Management
- −$3,840
- − Depreciation
- −$10,240
- Taxable income
- $3,323
- Est. tax owed @ 24.0%
- −$797
- After-tax cash flow
- $7,931/yr
For passive investors: Depreciation is non-cash, so a rental often shows a tax loss while cash-flowing — sheltering income. Rental losses are passive: they offset passive income freely, and up to $25,000/yr can offset ordinary (W-2) income if you actively participate and your MAGI is under $100k (phasing out to $0 by $150k); unused losses carry forward. On sale, claimed depreciation is recaptured at up to 25%, and gains may owe capital-gains tax (a 1031 exchange can defer both). Figures are a year-1 estimate at your 24.0% rate — not tax advice; consult a CPA.
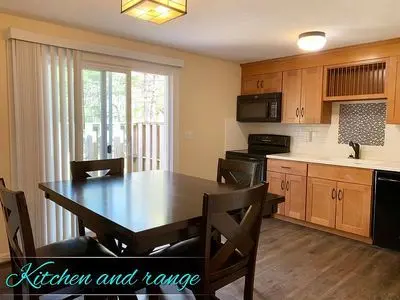
Condition & rehab AI · 2 photos
The home is in fair condition with some minor repairs needed, particularly in the kitchen. Painting the exterior and replacing cabinets would significantly increase its resale value.
Repairs flagged
- Minor Kitchen cabinets — Slight wear on some cabinet doors.
- Minor Kitchen countertops — Scratches visible on some countertops.
Value-add opportunities
- Resale Paint exterior — Fresh paint can significantly improve curb appeal.
- Resale Replace kitchen cabinets — New cabinets can enhance the kitchen's aesthetic and functionality.
- Rental Clean kitchen countertops — Clean countertops can attract renters and maintain a good first impression.
Renovation cost estimate screening
| Repair item | Severity | Est. cost |
|---|---|---|
| Kitchen cabinets · Slight wear on some cabinet doors. | Minor | $500–3,000 |
| Kitchen countertops · Scratches visible on some countertops. | Minor | $500–3,000 |
| Total estimated repair cost · 2 items | $1,000–6,000 |
Value-add ROI direction
- Resale Paint exterior — Fresh paint can significantly improve curb appeal. ↑
- Resale Replace kitchen cabinets — New cabinets can enhance the kitchen's aesthetic and functionality. ↑
- Rental Clean kitchen countertops — Clean countertops can attract renters and maintain a good first impression. ↑
ⓘ Cost ranges are severity-bucket heuristics (US national rule-of-thumb). Get contractor quotes + a written scope before underwriting a rehab budget.
Schools (NCES district)
- District
- Mashpee
- NCES district ID
- 2507440
- Math proficiency
- 34% ▼ -16.00%
- Reading proficiency
- 51% ▼ -2.00%
- Median HH income
- $65,376
- Composite
- 37.97/100
- National rank
- #4299
- State rank
- #183 of 302 in MA
Livability — Mashpee
No livability data for this city. (Only ~50 U.S. cities are tracked.)
Census & demographics
- Population (ZIP)
- 15,234
Population outlook (Barnstable County) Hauer SSP2
- Today (2025)
- 208,497 people
- By 2030
- 202,530 · -2.9%
- By 2040
- 184,936 · -11.3%
- By 2050
- 167,489 · -19.7%
- By 2075
- 144,938 · -30.5%
- By 2100
- 117,312 · -43.7%
Race, ethnicity, and origin ACS 2023
- Neighborhood character
- Predominantly White (88%)
- Race & ethnicity
- White 88% Two or more races 5% Black 2% Hispanic / Latino 2% Native American 2%
- Common ancestry
- Lithuanian 5% Russian 5% Romanian 4%
- Foreign-born
- 5% · Canada
- Languages at home
- 95% English-only · Spanish 2% Other Indo-European 1% Russian/Polish/Slavic 1%
Political lean MEDSL · Barnstable
- 2024 margin
- Strong D (+20.8) · D 59.6% · R 38.9% · Other 1.5%
- 2008→2024 swing
- +6.7pp toward D · 2008: 14.0pp · 2024: 20.8pp
- All cycles
- 2024: D+20.8 2020: D+24.4 2016: D+13.4 2012: D+7.6 2008: D+14.0
Not yet ingested
- Civics
- —
Market trends
- HPI YoY
- ▼ -159.04%
- Current HPI
- 328.8662
- Rent YoY
- —
- Metro
- —
- State GDP YoY
- ▲ 2.28%
- F500 in state
- 38
Industry mix (Fortune 500 HQ in MA)
| Industry | F500 HQs | Revenue |
|---|---|---|
| Technology | 3 | $17B |
|
||
| Insurance | 2 | $84B |
|
||
| Retail | 2 | $76B |
|
||
| Life Sciences | 1 | $43B |
|
||
| Energy Technology | 1 | $31B |
|
||
| Aerospace / Defense | 1 | $18B |
|
||
Price history
+252.4% since first listed11 events — show timeline
- 2026-06-06 Listed $352,000 FSBO.com
- 2019-09-04 Listing Removed — CCIMLS
- 2017-03-21 Sold (MLS) $114,000 MLS PIN
- 2017-01-27 Pending — MLS PIN
- 2017-01-11 Listed $144,000 MLS PIN
- 2016-09-12 Sold (MLS) $171,000 CCIMLS
- 2016-09-06 Pending — CCIMLS
- 2016-07-26 Listed — CCIMLS
- 2006-04-28 Listed $227,000 CCIMLS
- 2000-05-11 Sold (MLS) $105,000 CCIMLS
- 2000-03-22 Listed $99,900 CCIMLS
Cash-flow waterfall
monthlySold comps — $/sqft
last 12 mo · ≤1 miLoading sold comps…