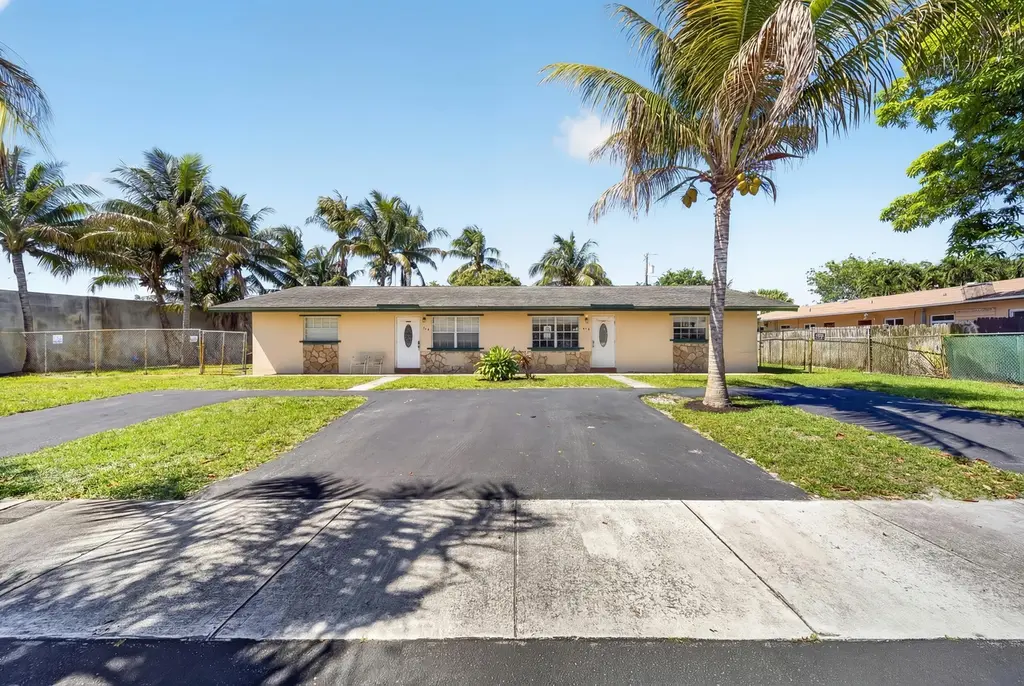
121 NW 56th Ct Unit 1-2 · Oakland Park, FL
Flood risk 1/10 · Minimal
- FEMA flood zone
- AH
- Chance of flooding over 30 yrs
- 0.0%
- Est. flood insurance / yr
- $1,142 – $2,507
Fire risk 1/10 · Minimal
- Est. fire insurance / yr
- $947 – $1,759
Heat risk 9/10 · Severe
- Hot days now (above 106°F)
- 7 days/yr
- Hot days in 30 yrs
- 25 days/yr
Wind risk 10/10 · Severe
- Chance of severe wind over 30 yrs
- 99.0%
Air-quality risk 2/10 · Minimal
- Unhealthy air days now
- 1 days/yr
- Unhealthy air days in 30 yrs
- 2 days/yr
Risk factors via First Street. Map © Google.
Why this score? — see what drove the F grade
The composite is a weighted blend of 9 inputs, each scored 0–100. Each bar is that input's sub-score; the figure is the points it added to the 100-point composite (weight × sub-score).
- ARV discount +7.5/15.0
- Cash flow +5.9/30.0
- Schools +4.1/10.0
- Livability +3.9/5.0
- Condition / age +2.5/5.0
- Rent growth +2.4/5.0
- 1% rule +1.4/10.0
- DSCR +0.3/10.0
- Appreciation +0.0/10.0
$625,000
🖨 Deal sheet (PDF) 📄 Offer letter ✓ Due diligence
Listing remarks
Income-producing duplex in a high-demand Oakland Park location. EachMinutes from Wilton Manors, Fort Lauderdale Airport, and the beaches, offering immediate cash flow and long-term upside. Built in 1980 with CBS construction, the property features separate water and electric meters, lowering expenses and simplifying management. Additional highlights include in-unit washer/dryer connections, privacy fencing, and well-water irrigation with a new pump and motor (March 2026). Key Capital improvements: HVAC (2019), water heater (2019), and new stove. UNIT A - 800 Sq. Ft. 2 BD, 1 BA, LAUNDRY ROOM + Privacy fence and backyard (LEASED| UNIT B - 800 Sq. Ft. 2BD, 1 BA, LAUNDRY ROOM + Privacy fence an
Key facts
- 9331 acre lot
- Built 1976
- Listed 61 days
Property features AI
Finance
- Financial info: Two-unit property; Gross income reported as $25,200; Tenants are responsible for electricity, water and sewer; Pets allowed (cats and dogs OK)
Exterior
- Utilities: Public water; Public sewer; Water connected; Sewer connected; Two separate electric meters; Two separate water meters
- Home design: Duplex; Single-story; Resale condition
- Construction: Built with stucco, concrete block (CBS), and stone; Other roof
- Exterior features: Fenced backyard; Cul-de-sac setting; Corner lot; Fruit trees on the property; Paved public road frontage
Interior
- Flooring: Tile flooring
- Heating & cooling: Central heating (electric) with separate meters; Central air conditioning (electric); Wall/window unit(s)
- Interior features: Satellite dish
- Laundry & utility: Laundry room with washer hookup
Neighborhood map
What this means for you Summary
Snapshot
- This is a 4-bed/2.0-bath condo listed at $625k.
Deal economics
- At list price, monthly cash flow is $-1k ($-16k/yr) — negative.
- To cash-flow at today's rent, offer at most $384k (38.5% below list).
- To meet the 1% rule (rent ≥ 1% of price), the offer needs to be $400k (36.0% below list).
- Recommended offer: $384k (38.5% below list) — sets the bar for cash-flow.
Location & tenants
- Location reads 77/100 on livability (#193 in FL, #3,082 nationally) — a middle-class / working-renter tenant base. Strengths: commute A+, housing A+, health & safety A+; Watch: amenities F.
- Broward (suburban): math 42% / reading 53% proficiency, ranked #46 of 73 in FL (top 63%) — families likely to look elsewhere, expect single-tenant / working-renter base with shorter leases.
- Zoned schools: North Andrews Gardens Elementary School (math 40% / reading 48%, grade F, #1,330 of 2,144 statewide, top 63%, 780 students, 77% FRL); James S. Rickards Middle School (math 18% / reading 31%, grade F, #522 of 571 statewide, top 93%, 755 students, 75% FRL); Northeast High School (math 12% / reading 37%, grade F, #505 of 667 statewide, top 79%, 1,552 students, 69% FRL) — zoned schools average 74% FRL vs 51% district-wide (23 pts higher); higher-poverty schools than district average — tighter screening recommended.
- Zoned-school proficiency averages 31% at this address vs 48% district-wide (-16 pts) — the specific schools serving this property underperform the Broward average; the district grade overstates school quality for this exact location.
- Market conditions: Rents soft (-0.5%/yr); 341 active listings in the ZIP; 32 comparable units currently listed for rent nearby; rentals at typical pace (median 26d on market — plan ~3-4 weeks tenant-placement turnaround); solid renter incomes; 2,111 units permitted in Broward County in 2024 (1,265 in 5+ unit buildings).
- At $3,999/mo this rent would consume 62% of the median local household income ($77k/yr) (locally 1596% of renters already pay >50% of income on rent) — very limited rent-growth headroom before tenants either downsize or default.
Forward outlook
- Local home prices are declining (-3.0%/yr); year-one equity from $4k of loan paydown is wiped out by about $19k of value loss. Plan a longer hold.
- Broward County population projected at +34% by 2050 — long-run rental-demand tailwind backs the buy-and-hold thesis.
Negotiation context
- It's been on market 62 days — a 6% lower offer ($588k) is reasonable based on typical stale-listing flexibility.
- Current owner paid $290k; list at $625k implies a 116% gain — meaningful room to come down on a strong offer.
Risks & watch-outs
- Watch-outs: flood insurance adds $152/mo.
- Climate carrying-cost: in FEMA flood zone AH (mandatory federal flood insurance); severe wind risk, 99% chance of damaging wind over 30y; extreme-heat days projected 7→25/yr by 2055 (HVAC capex compounding) — expect insurance premiums to compound above CPI over the hold.
Questions for the listing agent
- What do current leases actually rent for vs. the listed asking? Can we see a recent rent roll and the last 12 months of T-12 income?
- It's been on market 62 days. Have you received any prior offers? Is the seller open to a 39% concession, seller financing, or rate buy-down credit?
- Built in 1976 — when were the roof, HVAC, electrical panel, plumbing, and water heater last replaced?
- What's the actual annual flood-insurance premium (NFIP or private), and is the property in a SFHA with mandatory coverage?
- Any open or pending special assessments — roof, HVAC, plumbing, elevator, façade? What's the per-unit balance and payoff schedule, and is the seller paying it off at close or rolling it to the buyer?
- Why hasn't it sold? Are there any deal-killer items the seller is aware of (foundation, flood, title, zoning, code violations)?
- Is there a deadline driving the sale (1031 exchange, divorce, estate, relocation)? That informs how much negotiation room exists.
- Schools are D-rated, which usually means shorter tenancies and higher turnover. Who's the typical renter profile here, and what's been the actual vacancy rate?
- The area grade is low — what's the realistic commute time and amenity access for the typical tenant pool here? Any planned neighborhood developments (good or bad) we should know about?
- What's the average days-on-market for RENTAL listings here right now (not sales)? A rising rental-DOM trend means longer vacancies and softer asking-rent achievability than the comps imply.
- What's the recent tenant-quality profile in this submarket — average credit score on applications, eviction rate, late-payment / NSF rate, and stable-employment percentage? A property-management company in the area should have these aggregated.
- How much new apartment / multifamily construction is in the pipeline within 1–3 miles? Heavy new supply (>2% of stock underway) typically softens rents 12–24 months out; light construction supports rent growth.
Investment metrics
- 1% rule
- 0.64% ✗
- Cap rate
- 3.97%
- Cash-on-cash
- -8.30%
- DSCR
- 0.63
- GRM
- 13.0
CMA / ARV
No comps found within radius.
Projected returns pro-forma
-3.0% appreciation · 0.0% rent growth · sell at horizon
- IRR
- -36.5%
- Equity multiple
- -0.14×
- Total profit
- $-199,575
- Equity at exit
- $93,190
- IRR
- -75.5%
- Equity multiple
- -0.89×
- Total profit
- $-330,051
- Equity at exit
- $54,039
Cash invested: $175,000 (down + closing). Projections, not guarantees.
Landlord ↔ Tenant lean methodology
- Overall (STATE)
- 87 Strongly Landlord-Friendly
- State Florida
- 87 Strongly Landlord-Friendly · R+3
- County
- — inherits STATE
- City
- — inherits STATE
ZIP-level market 33309
- Home prices YoY
- -26.6%
- Rents YoY
- -0.5%
- Active inventory
- 341
- Price-to-rent
- 13.0×
Monthly cashflow live
- Estimated rent
- $3,999 high interval (Pro) →
- Mortgage (P&I)
- −$3,278
- Tax from tax record
- −$832 /mo · $9,980/yr
- Insurance
- −$260
- Flood insurance flood zone
- −$152 /mo · $1,824/yr
- HOA
- −$0
- Vacancy / Maint / Mgmt
- −$840
- Net cashflow
- $-1,362
Break-even live
Sensitivity live
| Price | -10% $-1,008 | -5% $-1,185 | +0% $-1,362 | +5% $-1,539 | +10% $-1,716 |
|---|---|---|---|---|---|
| Rent | -10% $-1,678 | -5% $-1,520 | +0% $-1,362 | +5% $-1,204 | +10% $-1,046 |
| Rate | -1.0pp $-1,048 | -0.5pp $-1,203 | base $-1,362 | +0.5pp $-1,524 | +1.0pp $-1,689 |
UW: 25.0% down · 7.5% · 30yr · 1.5% tax · 5.0% vac · 8.0% maint · 8.0% mgmt
Financing live
Cash to close
- Down payment
- $156,250
- Closing costs
- $18,750
- Reserves months
- —
- Total cash needed
- —
Loan-product check · same deal, 3 products live
Conventional
25% down · 7.5% · 30yr
- Down + closing
- —
- Monthly P&I
- —
- Monthly cashflow
- —
- DSCR
- —
- Eligible?
- —
Personal DTI + credit; lowest rate.
DSCR
20% down · 8.5% · 30yr
- Down + closing
- —
- Monthly P&I
- —
- Monthly cashflow
- —
- DSCR
- —
- Eligible?
- —
No personal income docs; deal must DSCR.
Hard money
10% down · 12.0% · 12mo
- Down + closing
- —
- Monthly P&I
- —
- Monthly cashflow
- —
- DSCR
- —
- Eligible?
- —
Short-term bridge; refi at stabilization.
Rent comps 32 comps
| Address | Beds | Baths | Sqft | Rent | $/sqft | DOM | Units | Dist |
|---|---|---|---|---|---|---|---|---|
| 5409 NE 4th Ave Fort Lauderdale, FL | 3.0 | 2.0 | 1178 | $3,200 | $2.72 | 26d | 1 | 0.49mi |
| 320 NW 51st Ct Fort Lauderdale, FL | 3.0 | 2.0 | 1396 | $3,500 | $2.51 | 26d | 1 | 0.49mi |
| 5655 NE 5th Ter Fort Lauderdale, FL | 3.0 | 2.0 | 1178 | $3,250 | $2.76 | 17d | 1 | 0.55mi |
| 5655 NE 5th Ter Fort Lauderdale, FL | 3.0 | 2.0 | 1178 | $3,250 | $2.76 | 26d | 1 | 0.55mi |
| 5225 NE 4th Ave Fort Lauderdale, FL | 3.0 | 2.0 | 1650 | $3,300 | $2.00 | 13d | 1 | 0.59mi |
| 240 NW 48th Ct Fort Lauderdale, FL | 3.0 | 2.0 | 1240 | $3,100 | $2.50 | 5d | 1 | 0.69mi |
| 5157 NE 5th Ave Unit 1 Fort Lauderdale, FL | 3.0 | 2.0 | 1250 | $3,500 | $2.80 | 4d | 1 | 0.70mi |
| 540 NE 61st Ct Fort Lauderdale, FL | 3.0 | 2.0 | 1272 | $3,395 | $2.67 | 4d | 1 | 0.71mi |
| 4650 NE 2nd Ave Fort Lauderdale, FL | 3.0 | 2.0 | 1356 | $3,950 | $2.91 | 26d | 1 | 0.92mi |
| 4680 NE 5th Ave Fort Lauderdale, FL | 3.0 | 2.0 | 1300 | $3,800 | $2.92 | 9d | 1 | 1.00mi |
| 50 NE 45th Ct Fort Lauderdale, FL | 4.0 | 2.0 | 1600 | $3,300 | $2.06 | 26d | 1 | 1.01mi |
| 4580 NE 3rd Ave Fort Lauderdale, FL | 3.0 | 2.0 | 1192 | $3,300 | $2.77 | 22d | 1 | 1.01mi |
| 4601 NE 4th Ave Unit 1261561P Fort Lauderdale, FL | 3.0 | 2.0 | 1097 | $4,430 | $4.04 | 26d | 1 | 1.03mi |
| 4780 NE 8th Ter Oakland Park, FL | 3.0 | 2.0 | 1130 | $4,200 | $3.72 | 26d | 1 | 1.09mi |
| 1419 NE 57th St Fort Lauderdale, FL | 4.0 | 2.5 | 2176 | $7,500 | $3.45 | 15d | 1 | 1.17mi |
| 1424 NE 53rd Ct Fort Lauderdale, FL | 3.0 | 2.0 | 1584 | $7,500 | $4.73 | 26d | 1 | 1.21mi |
| 1466 NE 57th Ct Unit 1044539P Fort Lauderdale, FL | 3.0 | 2.0 | 2012 | $6,185 | $3.07 | 9d | 1 | 1.28mi |
| 1466 NE 57th Ct Fort Lauderdale, FL | 3.0 | 2.0 | 2020 | $8,200 | $4.06 | 26d | 1 | 1.28mi |
| 1465 NE 53rd St Fort Lauderdale, FL | 4.0 | 2.0 | 1893 | $12,000 | $6.34 | 26d | 1 | 1.31mi |
| 1465 NE 53rd St Fort Lauderdale, FL | 4.0 | 2.0 | 1893 | $12,000 | $6.34 | 0d | 1 | 1.31mi |
| 1478 NE 57th St Fort Lauderdale, FL | 3.0 | 2.0 | 1590 | $5,400 | $3.40 | 26d | 1 | 1.32mi |
| 333 NW 41st St #337 Oakland Park, FL | 3.0 | 2.5 | 2000 | $3,950 | $1.98 | 16d | 1 | 1.33mi |
| 333 NW 41st St #331 Oakland Park, FL | 3.0 | 2.5 | 2000 | $3,700 | $1.85 | 26d | 1 | 1.33mi |
| 116 NW 41st St Unit 104 Oakland Park, FL | 3.0 | 2.5 | 2025 | $3,500 | $1.73 | 26d | 1 | 1.35mi |
| 682 NE 43rd St Oakland Park, FL | 3.0 | 2.5 | 1694 | $4,200 | $2.48 | 26d | 1 | 1.37mi |
| 5921 NE 15th Ave Fort Lauderdale, FL | 3.0 | 3.0 | 1977 | $4,600 | $2.33 | 26d | 1 | 1.42mi |
| 554 NW 40th Ct Oakland Park, FL | 5.0 | 2.0 | 1475 | $4,564 | $3.09 | 26d | 1 | 1.43mi |
| 5800 NE 15th Ave Fort Lauderdale, FL | 4.0 | 3.0 | 2076 | $6,000 | $2.89 | 5d | 1 | 1.43mi |
| 5800 NE 15th Ave Fort Lauderdale, FL | 4.0 | 3.0 | 2076 | $6,000 | $2.89 | 7d | 1 | 1.43mi |
| 5200 NE 15th Ave Fort Lauderdale, FL | 3.0 | 2.0 | 1585 | $4,600 | $2.90 | 26d | 1 | 1.46mi |
| 4511 NE 13th Ave Oakland Park, FL | 3.0 | 3.0 | 1416 | $4,300 | $3.04 | 5d | 1 | 1.48mi |
| 4511 NE 13th Ave Oakland Park, FL | 3.0 | 3.0 | 1416 | $4,300 | $3.04 | 26d | 1 | 1.48mi |
HOA detail condo
- Monthly dues
- $0 · $0/yr
- Likely covers
- waterelectric
- Assessments
- None detected in remarks — confirm with the listing agent.
Listing history 18 events
-
2026-06-21days on market $625,000 Active 62 DOM
-
2026-06-18days on market $625,000 Active 59 DOM
-
2026-06-17days on market $625,000 Active 58 DOM
-
2026-06-16days on market $625,000 Active 57 DOM
-
2026-06-15days on market $625,000 Active 56 DOM
-
2026-06-13days on market $625,000 Active 54 DOM
-
2026-06-09days on market $625,000 Active 50 DOM
-
2026-06-08days on market $625,000 Active 49 DOM
-
2026-06-07days on market $625,000 Active 48 DOM
-
2026-06-04days on market $625,000 Active 45 DOM
-
2026-06-03days on market $625,000 Active 44 DOM
-
2026-06-02days on market $625,000 Active 43 DOM
-
2026-06-01days on market $625,000 Active 42 DOM
-
2026-05-31days on market $625,000 Active 41 DOM
-
2026-04-16$630,000 Active
-
2004-12-22soldstatus $290,000
-
1996-03-22soldstatus $77,000
-
1986-11-01soldstatus $74,000
ⓘ Source: listings_history table (triggers on properties + properties_extension) + one-shot
backfill from property_details.listing_events for pre-trigger history.
Tax reassessment forecast FL · Resets to sale price
- Current annual tax
- $9,980 · $832/mo
- Projected year-2 tax
- $9,980 · $832/mo
- Expected delta
- $0/yr ($0/mo · -0.0%)
ⓘ Screening estimate from a state-policy table — verify with the county assessor before closing.
Climate risk First Street
- Flood 1/10 Low FEMA zone AH · 0% chance over 30 yrs
- Wildfire 1/10 Low
- Heat 9/10 Extreme 7 d/yr ≥106°F today · 25 d/yr by 30 yrs out
- Wind 10/10 Extreme 99% chance of damaging wind over 30 yrs
- Air quality 2/10 Low 1 unhealthy d/yr today · 2 by 30 yrs out
Nearby sold comps map
Loading sold comps map…
Walkable amenities ~0.75 mi
Loading nearby amenities…
Taxation est. · year 1
- Rental income
- $47,991
- − Mortgage interest
- −$35,010
- − Property taxes
- −$9,980
- − Insurance
- −$4,950
- − Repairs & maintenance
- −$3,839
- − Management
- −$3,839
- − Depreciation
- −$18,182
- Taxable loss
- −$27,808
- Est. tax savings @ 24.0%
- +$6,674
- After-tax cash flow
- $-9,673/yr
For passive investors: Depreciation is non-cash, so a rental often shows a tax loss while cash-flowing — sheltering income. Rental losses are passive: they offset passive income freely, and up to $25,000/yr can offset ordinary (W-2) income if you actively participate and your MAGI is under $100k (phasing out to $0 by $150k); unused losses carry forward. On sale, claimed depreciation is recaptured at up to 25%, and gains may owe capital-gains tax (a 1031 exchange can defer both). Figures are a year-1 estimate at your 24.0% rate — not tax advice; consult a CPA.
Schools (NCES district)
- District
- Broward
- NCES district ID
- 1200180
- Math proficiency
- 42% ▼ -18.00%
- Reading proficiency
- 53% ▼ -5.00%
- Median HH income
- $52,139
- Composite
- 40.88/100
- National rank
- #3621
- State rank
- #46 of 73 in FL
Livability — Oakland Park
- Score
- 77/100
- State rank
- #193
- US rank
- #3082
Category grades
Schools grade is shown separately in the Schools card above.
Census & demographics
- Census place
- Oakland Park, FL
- County
- Broward County · 1,963,430 people
- City population
- 68,410
- Metro
- Miami-Fort Lauderdale-Pompano Beach, FL
- Population (ZIP)
- 37,475
- Household income
- $77,321
- Rent vs Own
- Severe rent burden
- 1596.0
Population outlook (Broward County) Hauer SSP2
- Today (2025)
- 2,207,033 people
- By 2030
- 2,360,704 · +7.0%
- By 2040
- 2,661,208 · +20.6%
- By 2050
- 2,946,698 · +33.5%
- By 2075
- 3,602,273 · +63.2%
- By 2100
- 3,970,984 · +79.9%
Race, ethnicity, and origin ACS 2023
- Neighborhood character
- Diverse neighborhood (Simpson 0.68)
- Race & ethnicity
- Black 43% Hispanic / Latino 28% White 22% Two or more races 20% Asian 2%
- Hispanic origin (detail)
- Mexican 4% Puerto Rican 4% Cuban 3% Dominican 1%
- Common ancestry
- Hispanic 15% Lithuanian 1% Romanian 1%
- Foreign-born
- 38% · Canada, Jamaica, Dominican Republic
- Languages at home
- 55% English-only · Spanish 25% French/Haitian/Cajun 17% Other Indo-European 2%
Political lean MEDSL · Broward
- 2024 margin
- D (+17.0) · D 58.0% · R 41.0%
- 2008→2024 swing
- -17.8pp toward R · 2008: 34.7pp · 2024: 17.0pp
- All cycles
- 2024: D+17.0 2020: D+29.8 2016: D+35.0 2012: D+34.9 2008: D+34.7
Not yet ingested
- Civics
- —
Market trends
- HPI YoY
- ▼ -158.71%
- Current HPI
- 439.091
- Rent YoY
- ▼ -0.50%
- Metro
- Miami-Fort Lauderdale-Pompano Beach, FL
- State GDP YoY
- ▲ 3.28%
- F500 in state
- 36
Industry mix (Fortune 500 HQ in FL)
| Industry | F500 HQs | Revenue |
|---|---|---|
| Industrial Technology | 2 | $29B |
|
||
| Insurance | 2 | $17B |
|
||
| Retail | 1 | $60B |
|
||
| Technology Distribution | 1 | $58B |
|
||
| Homebuilding | 1 | $35B |
|
||
| Technology Manufacturing | 1 | $35B |
|
||
Price history
+751.4% since first listed4 events — show timeline
- 2026-04-16 Listed $630,000 Beaches MLS
- 2004-12-22 Sold (Public Records) $290,000 Public Records
- 1996-03-22 Sold (Public Records) $77,000 Public Records
- 1986-11-01 Sold (Public Records) $74,000 Public Records
Property tax history
+8.3%/yrLatest (2025): $9,980 · +8.4% YoY. Source: county tax records.
Cash-flow waterfall
monthlySold comps — $/sqft
last 12 mo · ≤1 miLoading sold comps…